2-METHOXYETHANOL (METHYL CELLOSOLVE, 2ME)
2-METHOXYETHYL ACETATE (METHYL CELLOSOLVE ACETATE, 2MEA)
2-ETHOXYETHANOL (CELLOSOLVE, 2EE)
2-ETHOXYETHYL ACETATE (CELLOSOLVE ACETATE, 2EEA)
| Method no.: | 79 | |||
| Matrix: | Air | |||
| Procedure: | Samples are collected by drawing air through standard size coconut shell charcoal tubes. Samples are desorbed with 95/5 (v/v) methylene chloride/methanol and analyzed by gas chromatography using a flame ionization detector. | |||
| Recommended air volume and sampling rate: |
48 L at 0.1 L/min for TWA samples 15 L at 1.0 L/min for STEL samples | |||
|
| ||||
| 2ME | 2MEA | 2EE | 2EEA | |
|
| ||||
| Target conc.: ppm (mg/m3) | 0.1 (0.3) | 0.1 (0.5) | 0.5 (1.8) | 0.5 (2.7) |
| Reliable quantitation limit: ppb (µg/m3) |
6.7 (21) | 1.7 (8.4) | 2.1 (7.8) | 1.2 (6.5) |
| Standard error of estimate at target concentration: (Section 4.7.) |
6.0% | 5.7% | 6.2% | 5.7% |
|
| ||||
| Special requirements: | As indicated in OSHA Method 53 (Ref. 5.1.), samples for 2MEA and 2EEA should be refrigerated upon receipt by the laboratory to minimize hydrolysis. | |||
| Status of method: | Evaluated method. This method has been subjected to the established evaluation procedures of the Organic Methods Evaluation Branch. | |||
| Date: January 1990 | Chemist: Carl J. Elskamp | |||
Organic Methods Evaluation Branch
OSHA Analytical
Laboratory
Salt Lake City, Utah
1. General Discussion
- The recommended air volume for TWA samples was increased from 10 L to 48 L. This allows for lower detection limits and increases the TWA sampling time to a more convenient 480 min (8 h) when sampling at 0.1 L/min.
- A capillary GC column was substituted for a packed column to attain higher resolution. This was especially helpful in achieving better separation of 2ME and me thylene chloride, a major component of the desorption solvent.
- It was found that the desorption efficiency from wet charcoal was significantly lower for 2ME, and to a lesser extent for 2EE, at these lower concentrations. This problem was overcome by adding about 125 mg of anhydrous magnesium sulfate to each desorption vial to remove the desorbed water. Because charcoal will always collect some water from sampled air, all 2ME and 2EE air samples must be treated in this manner.
1.1. Background
1.1.1. History
An air sampling and analytical procedure for 2ME, 2MEA, 2EE, and
2EEA (OSHA Method
53) was previously evaluated by the Organic Methods Evaluation
Branch of the OSHA Analytical Laboratory. (Ref.
5.1.) The target concentration for all four analytes in that
method was 5 ppm. OSHA is now in the process of 6(b) rulemaking to
consider reducing occupational exposure to these glycol ethers.
Because the proposed exposure limits may be significantly lower than
the target concentrations in Method
53, the methodology was
A number of changes were made to Method
53 to accommodate the lower target concentrations.
Utilizing these three major modifications of Method 53, a successful evaluation was performed for these glycol ethers at the lower target concentrations. Also, a minor modification was made in the determination of desorption efficiencies. Aqueous instead of methanolic stock solutions were used to determine the desorption efficiencies for 2MEA and 2EEA. It was found that at these lower levels, when stock methanolic solutions are spiked on dry Lot 120 charcoal, part of the 2MEA and 2EEA react with the methanol to form methyl acetate and 2ME and 2EE respectively. The reaction, which is analogous to hydrolysis, is called transesterification (alcoholysis) and is catalyzed by acid or base. The surface of dry Lot 120 charcoal is basic and the reaction was verified to occur by quantitatively determining methyl acetate and the corresponding alcohol (2ME for 2MEA samples, 2EE for 2EEA samples) from spiked samples. Transesterification was not observed when methanolic stock solutions were spiked onto wet charcoal. Therefore, transesterification is not expected to occur for samples collected from workplace air containing methanol as well as 2MEA or 2EEA because workplace atmospheres are seldom completely dry.
Because of the number of modifications and the extensive amount of data generated in this evaluation, the findings are presented as a separate method instead of a revision of Method 53. This method supersedes Method 53, although Method 53 is still valid at the higher analyte concentrations. Although hydrolysis of 2MEA and 2EEA does not appear to be a problem at lower concentrations, as a precautionary measure, the special requirement that 2MEA and 2EEA samples should be refrigerated upon receipt by the laboratory was retained from Method 53.
1.1.2. Toxic effects (This section is for information only and should not be taken as the basis of OSHA policy.)
As reported in the Documentation of Threshold Limit Values (Refs.
The following is quoted from NIOSH Current Intelligence Bulletin 39. (Ref. 5.7.)
The National Institute for Occupational Safety and Health (NIOSH) recommends that
2-methoxyethanol (2ME) and2-ethoxyethanol (2EE) be regarded in the workplace as having the potential to cause adverse reproductive effects in male and female workers. These recommendations are based on the results of several recent studies that have demonstrateddose-related embryo-toxicity and other reproductive effects in several species of animals exposed by different routes of administration. Of particular concern are those studies in which exposure of pregnant animals to concentrations of 2ME or 2EE at or below their respective Occupational Safety and Health Administration (OSHA) Permissible Exposure Limits (PELs) led to increased incidences of embryonic death, teratogenesis, or growth retardation. Exposure of male animals resulted in testicular atrophy and sterility. In each case the animals had been exposed to 2ME or 2EE at concentrations at or below their respective OSHA PELs. Therefore, appropriate controls should be instituted to minimize worker exposure to both compounds.
On May 20, 1986, EPA referred these four analytes to OSHA in accordance with the Toxic Substances Control Act (TSCA). On April 2, 1987, OSHA issued an Advanced Notice of Proposed Rulemaking (ANPR) which summarized the information currently available to OSHA concerning the uses, health effects, estimates of employee exposure and risk determinations for these glycol ethers. OSHA invited comments from interested parties and based on the gathered information will decide on appropriate action. (Ref. 5.8.)
1.1.3. Workplace exposure
2ME- It is used as a solvent for many purposes: cellulose esters, dyes, resins, lacquers, varnishes, and stains; and as a perfume fixative and jet fuel deicing additive. (Ref. 5.2.)
2MEA- It is used in photographic films, lacquers, textile printing, and as a solvent for waxes, oils, various gums and resins, cellulose acetate, and nitrocellulose. (Ref. 5.3.)
2EE- It is used as a solvent for nitrocellulose, natural
and synthetic resins, and as a mutual solvent for the formulation of
soluble oils. It is also used in lacquers, in the dyeing and
printing of textiles, in varnish removers, cleaning solutions, in
products for the treatment of leather, and as an
2EEA- It is used as a blush retardant in lacquers; as a solvent for nitrocellulose, oils and resins; in wood stains, varnish removers, and in products for the treatment of textiles and leathers. (Ref. 5.5.)
1.1.4. Physical properties (Refs. 5.2.-5.5.)
chemical formulae:
| 2ME- CH3OCH2CH2OH | 2MEA- CH3OCH2CH2OOCCH3 |
| 2EE- CH3CH2OCH2CH20H | 2EEA- CH3CH2OCH2CH2OOCCH3 |
synonyms: (Ref. 5.9.)
2ME- Methyl Cellosolve; glycol monomethyl ether; ethylene glycol monomethyl ether; methyl oxitol; Ektasolve; Jeffersol EM
2MEA- Methyl Cellosolve Acetate; glycol monomethyl ether acetate; ethylene glycol monomethyl ether acetate
2EE- Cellosolve solvent; ethylene glycol monoethyl ether
2EEA- Cellosolve Acetate; Glycol monoethyl ether acetate; ethylene glycol monoethyl ether acetate
|
| ||||
| analyte | 2ME | 2MEA | 2EE | 2EEA |
|
| ||||
| CAS no.: | 109-86-4 | 110-49-6 | 110-80-5 | 111-15-9 |
| mol wt: | 76.09 | 118.13 | 90.11 | 132.16 |
| bp (°C): | 124.5 | 145 | 135.6 | 156.4 |
| color: | all are colorless liquids | |||
| sp gr: | 0.9663 | 1.005 | 0.931 | 0.975 |
| vp [kPa (mm Hg) at 20°C]: |
0.8(6) | 0.3(2) | 0.49(3.7) | 0.3(2) |
| (mm Hg at 20°C) flash pt.: |
43 | 49 | 40 | 49 |
| (°C, closed cup) odor: (Ref. 5.9.) |
mild, non-residual |
mild, ether-like |
sweetish | mild, non-residual |
| explosive limits, % (Ref. 5.9.) | ||||
| lower: | 2.5 | 1.1 | 1.8 | 1.7 |
| upper: | 19.8 | 8.2 | 14 | ? |
|
| ||||
The analyte air concentrations throughout this method are based on
the recommended
1.2. Limit defining parameters
1.2.1. Detection limit of the analytical procedure
The detection limits of the analytical procedure are 0.10, 0.04,
0.04, and 0.03 ng per injection
1.2.2. Detection limit of the overall procedure
The detection limits of the overall procedure are 1.0, 0.40, 0.37, and 0.31 µg per sample for 2ME, 2MEA, 2EE, and 2EEA respectively. These are the amounts of each analyte spiked on the sampling device that allow recovery of amounts of each analyte equivalent to the detection limits of the analytical procedure. These detection limits correspond to air concentrations of 6.7 ppb (21 µg/m3), 1.7 ppb (8.4 µg/m3), 2.1 ppb (7.8 µg/m3), and 1.2 ppb (6.5 µg/m3) for 2ME, 2MEA, 2EE, and 2EEA respectively. (Section 4.2.)
1.2.3. Reliable quantitation limit
The reliable quantitation limits are the same as the detection limits of the overall procedure because the desorption efficiencies are essentially 100% at these levels. These are the smallest amounts of each analyte that can be quantitated within the requirements of recoveries of at least 75% and precisions (±1.96 SD) of ±25% or better. (Section 4.3.)
The reliable quantitation limits and detection limits reported in the method are based upon optimization of the GC for the smallest possible amounts of each analyte. When the target concentration of an analyte is exceptionally higher than these limits, they may not be attainable at the routine operating parameters.
1.2.4. Instrument response to the analyte
The instrument response over the concentration ranges of 0.5 to 2 times the target concentrations is linear for all four analytes. (Section 4.4.)
1.2.5. Recovery
The recovery of 2ME, 2MEA, 2EE, and 2EEA from samples used in a
1.2.6. Precision (analytical procedure)
The pooled coefficients of variation obtained from replicate determinations of analytical standards at 0.5, 1, and 2 times the target concentrations are 0.022, 0.004, 0.002, and 0.002 for 2ME, 2MEA, 2EE, and 2EEA respectively. (Section 4.6.)
1.2.7. Precision (overall procedure)
The precisions at the 95% confidence level for the ambient
temperature
1.2.8. Reproducibility
Six samples for each analyte collected from controlled test atmospheres and a draft copy of this procedure were given to a chemist unassociated with this evaluation. The samples were analyzed after 12 days of refrigerated storage. No individual sample result deviated from its theoretical value by more than the precision reported in Section 1.2.7. (Section 4.8.)
1.3. Advantages
1.3.1. Charcoal tubes provide a convenient method for sampling.
1.3.2. The analysis is rapid, sensitive, and precise.
1.4. Disadvantage
It may not be possible to analyze co-collected solvents using this method. Most of the other common solvents which are collected on charcoal are analyzed after desorption with carbon disulfide.
2. Sampling Procedure
2.1. Apparatus
2.1.1. Samples are collected using a personal sampling pump calibrated to within ±5% of the recommended flow rate with a sampling tube in line.
2.1.2. Samples are collected with solid sorbent sampling tubes
containing coconut shell charcoal. Each tube consists of two
sections of charcoal separated by a urethane foam plug. The front
section contains 100 mg of charcoal and the back section, 50 mg. The
sections are held in place with glass wool plugs in a glass tube
2.2. Reagents
None required
2.3. Technique
2.3.1. Immediately before sampling, break off the ends of the charcoal tube. All tubes should be from the same lot.
2.3.2. Connect the sampling tube to the sampling pump with
flexible tubing. Position the tube so that sampled air first passes
through the
2.3.3. Air being sampled should not pass through any hose or tubing before entering the sampling tube.
2.3.4. Place the sampling tube vertically (to avoid channeling) in the employee's breathing zone.
2.3.5. After sampling, seal the tubes immediately with plastic caps and wrap lengthwise with OSHA Form 21.
2.3.6. Submit at least one blank sampling tube with each sample set. Blanks should be handled in the same manner as samples, except no air is drawn through them.
2.3.7. Record sample volumes (in liters of air) for each sample, along with any potential interferences.
2.3.8. Ship any bulk sample(s) in a container separate from the air samples.
2.4. Sampler capacity
2.4.1. Sampler capacity is determined by measuring how much air
can be sampled before breakthrough of analyte occurs, i.e., the
sampler capacity is exceeded. Individual breakthrough studies were
performed on each of the four analytes by monitoring the effluent
from sampling tubes containing only the
2.4.2. A similar study as in 2.4.1. was done while sampling an atmosphere containing 10 ppm of all four analytes. The atmosphere was sampled for more than 5 h (>60 L) with no breakthrough detected. (This data was collected in the evaluation of OSHA Method 53, Ref. 5.1.)
2.5. Desorption efficiency
2.5.1. The average desorption efficiencies of 2ME, 2MEA, 2EE, and 2EEA from Lot 120 charcoal are 95.8, 97.9, 96.5, and 98.3% respectively over the range of 0.5 to 2 times the target concentrations. Desorption samples for 2MEA and 2EEA must not be determined by using methanolic stock solutions since a transesterification reaction can occur. (Section 4.9.)
2.5.2. Desorbed samples remain stable for at least 24 h. (Section 4.10.)
2.6. Recommended air volume and sampling rate
2.6.1. For TWA samples, the recommended air volume is 48 L
collected at 0.1 L/min
2.6.2. For short-term samples, the recommended air volume is 15 L
collected at 1.0 L/min
2.6.3. When short-term samples are required, the reliable quantitation limits become larger. For example, the reliable quantitation limit is 21 ppb (67 µg/m3) for 2ME when 15 L is sampled.
2.7. Interferences (sampling)
2.7.1. It is not known if any compound(s) will severely interfere with the collection of any of the four analytes on charcoal. In general, the presence of other contaminant vapors in the air will reduce the capacity of charcoal to collect the analytes.
2.7.2. Suspected interferences should be reported to the laboratory with submitted samples.
2.8. Safety precautions (sampling)
2.8.1. Attach the sampling equipment to the employee so that it will not interfere with work performance or safety.
2.8.2. Wear eye protection when breaking the ends of the charcoal tubes.
2.8.3. Follow all safety procedures that apply to the work area being sampled.
3. Analytical Procedure
3.1. Apparatus
3.1.1. A GC equipped with a flame ionization detector. For this
evaluation, a
3.1.2. A GC column capable of separating the analyte of interest
from the desorption solvent, internal standard and any
interferences. A thick film,
3.1.3. An electronic integrator or some other suitable means of
measuring peak areas or heights. A
3.1.4. Two-milliliter vials with Teflon-lined caps.
3.1.5. A dispenser capable of delivering 1.0 mL to prepare
standards and samples. If a dispenser is not available, a
3.1.6. Syringes of various sizes for preparation of standards.
3.1.7. Volumetric flasks and pipets to dilute the pure analytes in preparation of standards.
3.2. Reagents
3.2.1. 2-Methoxyethanol, 2-methoxyethyl acetate,
3.2.2. Anhydrous magnesium sulfate, reagent grade. Chempure Lot M172 KDHM was used in this evaluation.
3.2.3. Methylene chloride, chromatographic grade. American Burdick and Jackson Lot AQ098 was used in this evaluation.
3.2.4. Methanol, chromatographic grade. American Burdick and Jackson Lot AT015 was used in this evaluation.
3.2.5. A suitable internal standard, reagent grade. "Quant Grade"
3.2.6. The desorption solvent consists of methylene chloride/ methanol, 95/5 (v/v) containing an internal standard at a concentration of 20 µL/L.
3.2.7. GC grade nitrogen, air, and hydrogen.
3.3. Standard preparation
3.3.1. Prepare concentrated stock standards by diluting the pure analytes with methanol. Prepare working standards by injecting microliter amounts of concentrated stock standards into vials containing 1.0 mL of desorption solvent delivered from the same dispenser used to desorb samples. For example, to prepare a stock standard of 2ME, dilute 195 µL of pure 2ME (sp gr = 0.9663) to 50.0 mL with methanol. This stock solution would contain 3.769 µg/µL. A working standard of 15.08 µg/sample is prepared by injecting 4.0 µL of this stock into a vial containing 1.0 mL of desorption solvent.
3.3.2. Bracket sample concentrations with working standard concentrations. If samples fall outside of the concentration range of prepared standards, prepare and analyze additional standards to ascertain the linearity of response.
3.4. Sample preparation
3.4.1. Transfer each section of the samples to separate vials. Discard the glass tubes and plugs.
3.4.2. For 2ME and 2EE samples, add about 125 mg of magnesium sulfate to each vial.
3.4.3. Add 1.0 mL of desorption solvent to each vial using the same dispenser as used for preparation of standards.
3.4.4. Immediately cap the vials and shake them periodically for about 30 min.
3.5. Analysis
3.5.1. GC conditions
| zone temperatures: | column- injector- detector- |
80°C for 4 min 10°C/min to 125°C 125°C for 4 min 150°C 200°C | |
| gas flows: | hydrogen (carrier)- nitrogen (makeup)- hydrogen (flame)- air- |
2.5 (80 kPa head pressure) 20 65 400 | |
| injection volume: | 1.0 µL (with a 10:1 split) | ||
| column: | 60-m × 0.32-mm i.d. fused silica,
| ||
| retention times (min): | 2ME- 2MEA- 2EE- 2EEA- |
5.0 10.0 6.7 11.9 | |
| (3-methyl-3-pentanol- 7.5) | |||
| chromatograms: | Section 4.11. | ||
3.5.2. Peak areas (or heights) are measured by an integrator or other suitable means.
3.5.3. An internal standard (ISTD) calibration method is used.
Calibration curves are prepared by plotting micrograms of analyte
per sample versus
3.6. Interferences (analytical)
3.6.1. Any compound that responds on a flame ionization detector and has the same general retention time of the analyte or internal standard is a potential interference. Possible interferences should be reported to the laboratory with submitted samples by the industrial hygienist. These interferences should be considered before samples are desorbed.
3.6.2. GC parameters (i.e. column and column temperature) may be changed to possibly circumvent interferences.
3.6.3. Retention time on a single column is not considered proof of chemical identity. Analyte identity should be confirmed by GC/mass spectrometer if possible.
3.7. Calculations
The analyte concentration for samples is obtained from the
appropriate calibration curve in terms of micrograms per sample,
uncorrected for desorption efficiency. The air concentration is
calculated using the following formulae. The back
| mg/m3 = | (micrograms of analyte per
sample)
(liters of air sampled)(desorption efficiency) |
| where desorption efficiency = | 0.958 for 2ME, 0.979 for 2MEA 0.965 for 2EE, 0.983 for 2EEA |
| ppm = | (mg/m3)(24.46)
(molecular weight of analyte) |
| where | 24.46 = molar volume (L) at 25°C and 101.3 kPa (760 mm Hg) | |
| molecular weight = | 76.09 for 2ME, 118.13 for 2MEA 90.11 for 2EE, 132.16 for 2EEA | |
3.8. Safety precautions (analytical)
3.8.1. Avoid skin contact and inhalation of all chemicals.
3.8.2. Restrict the use of all chemicals to a fume hood when possible.
3.8.3. Wear safety glasses and a lab coat at all times while in the lab area.
4. Backup Data
4.1.
Detection limit of the analytical procedureThe injection size listed in the analytical procedure (1.0 µL with a 10:1 split) was used in the determination of the detection limits of the analytical procedure. The detection limits of 0.10, 0.04, 0.04, and 0.03 ng were determined by making injections of 1.00, 0.40, 0.37, and 0.31 ng/L standards for 2ME, 2MEA, 2EE, and 2EEA respectively. These amounts were judged to produce peaks with heights approximately 5 times the baseline noise. Chromatograms of such injections are shown in Figures 4.1.1. and 4.1.2.
4.2. Detection limit of the overall procedure
Six samples for each analyte were prepared by injecting (from
dilute aqueous standards) 1.00 µg of 2ME, 0.40 µg of 2MEA, 0.37 µg of
2EE, and 0.31 µg of 2EEA into the
|
| ||
| sample no. | µg spiked | µg recovered |
|
| ||
| 1 | 1.00 | 0.908 |
| 2 | 1.00 | 0.945 |
| 3 | 1.00 | 0.957 |
| 4 | 1.00 | 0.982 |
| 5 | 1.00 | 1.067 |
| 6 | 1.00 | 0.969 |
|
| ||
|
| ||
| sample no. | µg spiked | µg recovered |
|
| ||
| 1 | 0.40 | 0.382 |
| 2 | 0.40 | 0.392 |
| 3 | 0.40 | 0.385 |
| 4 | 0.40 | 0.402 |
| 5 | 0.40 | 0.402 |
| 6 | 0.40 | 0.408 |
|
| ||
|
| ||
| sample no. | µg spiked | µg recovered |
|
| ||
| 1 | 0.37 | 0.347 |
| 2 | 0.37 | 0.352 |
| 3 | 0.37 | 0.347 |
| 4 | 0.37 | 0.388 |
| 5 | 0.37 | 0.370 |
| 6 | 0.37 | 0.361 |
|
| ||
|
| ||
| sample no. | µg spiked | µg recovered |
|
| ||
| 1 | 0.31 | 0.301 |
| 2 | 0.31 | 0.319 |
| 3 | 0.31 | 0.304 |
| 4 | 0.31 | 0.322 |
| 5 | 0.31 | 0.328 |
| 6 | 0.31 | 0.328 |
|
| ||
4.3. Reliable quantitation limit
The reliable quantitation limits were determined by analyzing
charcoal tubes spiked with loadings equivalent to the detection limits
of the analytical procedure. Samples were prepared by injecting 1.0 µg
of 2ME, 0.40 g of 2MEA, 0.37 µg of 2EE, and 0.31 µg of 2EEA into the
|
| |||
| sample no. | percent recovered | statistics | |
|
| |||
| 1 | 90.8 | 97.1 | |
| 2 | 94.5 | ||
| 3 | 95.7 | ||
| 4 | 98.2 | SD = | 5.3 |
| 5 | 106.7 | Precision = | (1.96)(±5.3) |
| 6 | 96.9 | = | ±10.4 |
|
| |||
|
| |||
| sample no. | percent recovered | statistics | |
|
| |||
| 1 | 95.5 | 98.8 | |
| 2 | 98.0 | ||
| 3 | 96.2 | ||
| 4 | 100.5 | SD = | 2.6 |
| 5 | 100.5 | Precision = | (1.96)(±2.6) |
| 6 | 102.0 | = | ±5.1 |
|
| |||
|
| |||
| sample no. | percent recovered | statistics | |
|
| |||
| 1 | 93.8 | 97.5 | |
| 2 | 95.1 | ||
| 3 | 93.8 | ||
| 4 | 104.9 | SD = | 4.3 |
| 5 | 100.0 | Precision = | (1.96)(±4.3) |
| 6 | 97.6 | = | ±8.4 |
|
| |||
|
| |||
| sample no. | percent recovered | statistics | |
|
| |||
| 1 | 97.1 | 102.3 | |
| 2 | 102.9 | ||
| 3 | 98.1 | ||
| 4 | 103.9 | SD = | 3.8 |
| 5 | 105.8 | Precision = | (1.96)(±3.8) |
| 6 | 105.8 | = | ±7.4 |
|
| |||
4.4. Instrument response to the analyte
The instrument response to the analytes over the range of 0.5 to 2
times the target concentrations was determined from multiple
injections of analytical standards. These data are given in Tables
|
| |||
| × target conc. µg/sample ppm |
0.5× 7.537 0.050 |
1× 15.07 0.101 |
2× 30.15 0.202 |
|
| |||
| area counts | 6930.6 | 14033 | 29007 |
| 6832.1 | 14219 | 28908 | |
| 6771.4 | 14139 | 28920 | |
| 6655.9 | 14133 | 28691 | |
| 6202.5 | 14165 | 28834 | |
| 6786.0 | 14176 | 28887 | |
| 6696.4 | 14144 | 28874 | |
|
| |||
|
| |||
| × target conc. µg/sample ppm |
0.5× 11.66 0.050 |
1× 23.32 0.101 |
2× 46.63 0.201 |
|
| |||
| area counts | 11946 | 24182 | 48262 |
| 11772 | 24108 | 48302 | |
| 11987 | 24124 | 48160 | |
| 12002 | 24230 | 48281 | |
| 11954 | 24168 | 48116 | |
| 11888 | 24111 | 48250 | |
| 11925 | 24154 | 48228 | |
|
| |||
|
| |||
| × target conc. µg/sample ppm |
0.5× 44.69 0.253 |
1× 89.38 0.505 |
2× 178.8 1.01 |
|
| |||
| area counts | 54351 | 112883 | 229836 |
| 54263 | 113321 | 229797 | |
| 53870 | 113357 | 229284 | |
| 54239 | 113320 | 229292 | |
| 54102 | 113176 | 228496 | |
| 54292 | 113418 | 229250 | |
| 54186 | 113246 | 229326 | |
|
| |||
|
| |||
| × target conc. µg/sample ppm |
0.5× 64.35 0.248 |
1× 128.7 0.496 |
2× 257.4 0.992 |
|
| |||
| area counts | 84793 | 171546 | 342651 |
| 84896 | 171239 | 343419 | |
| 84718 | 171727 | 341665 | |
| 84795 | 171787 | 342505 | |
| 84446 | 171303 | 341122 | |
| 84612 | 171138 | 342812 | |
| 84710 | 171457 | 342362 | |
|
| |||
4.5. Storage test
Storage samples are normally generated by sampling the recommended
air volume at the recommended sampling rate from test atmospheres at
80% relative humidity containing the analyte at the target
concentration. Because this would require generation of
|
| |||||||
| storage time | % recovery | ||||||
| (days) | (refrigerated) | (ambient) | |||||
|
| |||||||
| 0 | 97.8 | 102.0 | 96.3 | 97.8 | 102.0 | 96.3 | |
| 0 | 99.9 | 104.2 | 94.8 | 99.9 | 104.2 | 94.8 | |
| 3 | 96.8 | 99.5 | 95.9 | 93.7 | 91.7 | 94.2 | |
| 6 | 96.3 | 96.6 | 93.3 | 92.8 | 91.4 | 92.8 | |
| 9 | 91.4 | 88.8 | 91.4 | 86.1 | 88.8 | 87.5 | |
| 12 | 89.9 | 89.8 | 88.7 | 91.3 | 93.1 | 86.9 | |
| 15 | 87.4 | 88.8 | 84.4 | 87.8 | 79.8 | 80.7 | |
|
| |||||||
|
| |||||||
| storage time | % recovery | ||||||
| (days) | (refrigerated) | (ambient) | |||||
|
| |||||||
| 0 | 101.2 | 103.5 | 101.8 | 101.2 | 103.5 | 101.8 | |
| 0 | 102.0 | 105.0 | 103.8 | 102.0 | 105.0 | 103.8 | |
| 3 | 96.8 | 99.2 | 99.4 | 94.1 | 95.0 | 93.7 | |
| 6 | 94.2 | 93.1 | 95.9 | 92.6 | 93.3 | 92.0 | |
| 9 | 96.9 | 99.7 | 98.7 | 92.0 | 90.8 | 90.2 | |
| 12 | 95.1 | 96.2 | 95.5 | 88.6 | 90.5 | 87.1 | |
| 15 | 94.0 | 95.9 | 96.1 | 89.3 | 89.4 | 89.8 | |
|
| |||||||
|
| |||||||
| storage time | % recovery | ||||||
| (days) | (refrigerated) | (ambient) | |||||
|
| |||||||
| 0 | 96.4 | 101.4 | 95.8 | 96.4 | 101.4 | 95.8 | |
| 0 | 99.8 | 100.2 | 93.9 | 99.8 | 100.2 | 93.9 | |
| 3 | 93.9 | 100.5 | 98.3 | 93.9 | 95.7 | 96.2 | |
| 6 | 96.4 | 96.9 | 96.7 | 93.4 | 96.8 | 94.0 | |
| 9 | 92.1 | 88.2 | 91.5 | 81.6 | 87.9 | 88.0 | |
| 12 | 89.2 | 89.6 | 89.1 | 92.6 | 92.3 | 86.1 | |
| 15 | 88.6 | 88.4 | 84.1 | 90.1 | 80.4 | 80.0 | |
|
| |||||||
|
| |||||||
| storage time | % recovery | ||||||
| (days) | (refrigerated) | (ambient) | |||||
|
| |||||||
| 0 | 99.7 | 101.7 | 101.8 | 99.7 | 101.7 | 101.8 | |
| 0 | 100.9 | 104.1 | 102.2 | 100.9 | 104.1 | 102.2 | |
| 3 | 94.5 | 96.7 | 103.6 | 92.8 | 94.2 | 91.6 | |
| 6 | 92.7 | 92.2 | 95.7 | 91.4 | 91.5 | 90.8 | |
| 9 | 96.2 | 98.7 | 98.0 | 90.3 | 88.9 | 88.8 | |
| 12 | 93.5 | 94.6 | 94.7 | 87.0 | 88.8 | 84.9 | |
| 15 | 92.9 | 95.0 | 95.2 | 87.6 | 87.6 | 87.6 | |
|
| |||||||
4.6. Precision (analytical procedure)
The precision of the analytical procedure for each analyte is the
pooled coefficient of variation determined from replicate injections
of standards. The precision of the analytical procedure for each
analyte is given in Tables
|
| |||
| × target conc. µg/sample ppm |
0.5× 7.537 0.050 |
1× 15.07 0.101 |
2× 30.15 0.202 |
|
| |||
| SD (area counts) | 257.9 | 62.5 | 106.0 |
| CV | 0.0385 | 0.0044 | 0.0037 |
|
| |||
|
| |||
| × target conc. µg/sample ppm |
0.5× 11.66 0.050 |
1× 23.32 0.101 |
2× 46.63 0.201 |
|
| |||
| SD (area counts) | 84.7 | 48.2 | 73.6 |
| CV | 0.0071 | 0.0020 | 0.0015 |
|
| |||
|
| |||
| × target conc. µg/sample ppm |
0.5× 44.69 0.253 |
1× 89.38 0.505 |
2× 178.8 1.01 |
|
| |||
| SD (area counts) | 175.6 | 194.8 | 485.7 |
| CV | 0.0032 | 0.0017 | 0.0021 |
|
| |||
|
| |||
| × target conc. µg/sample ppm |
0.5× 64.35 0.248 |
1× 128.7 0.496 |
2× 257.4 0.992 |
|
| |||
| SD (area counts) | 160.0 | 269.3 | 830.3 |
| CV | 0.0019 | 0.0016 | 0.0024 |
|
| |||
4.7. Precision (overall procedure)
The precision of the overall procedure is determined from the storage data. The determination of the standard error of estimate (SEE) for a regression line plotted through the graphed storage data allows the inclusion of storage time as one of the factors affecting overall precision. The SEE is similar to the standard deviation, except it is a measure of dispersion of data about a regression line instead of about a mean. It is determined with the following equation:

| where | |
| n = k = k = |
total no. of data points 2 for linear regression 3 for quadratic regression |
| Yobs = | observed % recovery at a given time |
| Yest = | estimated % recovery from the regression line at the same given time |
An additional 5% for pump error is added to the SEE by the addition
of variances. The SEEs are 6.0%, 5.7%, 6.2%, and 5.7% for 2ME, 2MEA,
2EE, and 2EEA respectively. The precision of the overall procedure is
the precision at the 95% confidence level, which is obtained by
multiplying the SEE (with pump error included) by 1.96 (the
4.8. Reproducibility
Six samples for each analyte, collected from controlled test
atmospheres (at about 80% R.H.,
|
| ||||
| sample no. | µg found | µg expected | % found | % deviation |
|
| ||||
| 1 | 14.90 | 14.59 | 102.1 | +2.1 |
| 2 | 15.21 | 15.36 | 99.0 | -1.0 |
| 3 | 15.06 | 14.93 | 100.9 | +0.9 |
| 4 | 15.42 | 15.38 | 100.3 | +0.3 |
| 5 | 15.41 | 15.07 | 102.3 | +2.3 |
| 6 | 15.88 | 15.54 | 102.2 | +2.2 |
|
| ||||
|
| ||||
| sample no. | µg found | µg expected | % found | % deviation |
|
| ||||
| 1 | 21.61 | 23.35 | 92.5 | -7.5 |
| 2 | 20.33 | 22.77 | 89.3 | -10.7 |
| 3 | 21.47 | 23.12 | 92.9 | -7.1 |
| 4 | 21.51 | 22.84 | 94.2 | -5.8 |
| 5 | 22.44 | 23.87 | 94.0 | -6.0 |
| 6 | 22.48 | 24.01 | 93.6 | -6.4 |
|
| ||||
|
| ||||
| sample no. | µg found | µg expected | % found | % deviation |
|
| ||||
| 1 | 83.47 | 85.55 | 97.6 | -2.4 |
| 2 | 88.22 | 90.07 | 97.9 | -2.1 |
| 3 | 84.10 | 87.57 | 96.0 | -4.0 |
| 4 | 86.57 | 90.20 | 96.0 | -4.0 |
| 5 | 84.79 | 88.40 | 95.9 | -4.1 |
| 6 | 88.90 | 91.16 | 97.5 | -2.5 |
|
| ||||
|
| ||||
| sample no. | µg found | µg expected | % found | % deviation |
|
| ||||
| 1 | 117.3 | 129.9 | 90.3 | -9.7 |
| 2 | 118.1 | 126.7 | 93.2 | -6.8 |
| 3 | 117.5 | 128.6 | 91.4 | -8.6 |
| 4 | 117.4 | 127.1 | 92.4 | -7.6 |
| 5 | 122.8 | 132.8 | 92.5 | -7.5 |
| 6 | 121.9 | 133.6 | 91.2 | -8.8 |
|
| ||||
4.9. Desorption efficiency
The desorption efficiency for each analyte was determined by injecting microliter amounts of aqueous stock standards onto the front section of charcoal tubes. Aqueous standards were used because it was found that when methanolic standards were injected onto dry charcoal, part of the 2MEA and 2EEA reacted with the methanol via transesterification (alcoholysis). The reaction was presumably catalyzed by the basic surface of the charcoal. Eighteen samples were prepared, six samples for each concentration level listed in the following tables. The samples were stored in a refrigerator and analyzed the next day.
|
| |||||||
| analyte | 2ME
|
2MA
| |||||
| × target conc. µg/sample ppm |
0.5× 7.537 0.050 |
1× 15.07 0.101 |
2× 30.15 0.202 |
0.5× 11.66 0.050 |
1× 23.32 0.101 |
2× 46.63 0.201 | |
|
| |||||||
| desorption | 92.8 | 94.5 | 96.2 | 97.6 | 97.6 | 96.7 | |
| efficiency, % | 96.8 | 97.7 | 97.0 | 98.8 | 98.0 | 98.3 | |
| 93.0 | 94.0 | 98.0 | 97.4 | 98.3 | 98.0 | ||
| 97.1 | 96.4 | 97.6 | 97.5 | 99.6 | 96.9 | ||
| 95.8 | 94.9 | 96.2 | 97.9 | 99.1 | 96.7 | ||
| 90.7 | 97.9 | 97.3 | 98.1 | 98.4 | 96.9 | ||
| 94.4 | 95.9 | 97.0 | 97.9 | 98.5 | 97.2 | ||
| 95.8 | 97.9 | ||||||
|
| |||||||
|
| |||||||
| analyte | 2EE
|
2EEA
| |||||
| × target conc. µg/sample ppm |
0.5× 44.69 0.2530 |
1× 89.38 0.505 |
2× 178.8 1.01 |
0.5× 64.35 0.248 |
1× 128.7 0.496 |
2× 257.4 0.992 | |
|
| |||||||
| desorption | 94.9 | 95.4 | 96.9 | 97.7 | 98.5 | 97.1 | |
| efficiency, % | 95.3 | 97.3 | 97.7 | 99.1 | 98.8 | 98.4 | |
| 93.1 | 94.9 | 98.4 | 98.6 | 98.8 | 98.2 | ||
| 97.3 | 97.2 | 98.3 | 98.3 | 100.2 | 97.5 | ||
| 95.4 | 97.7 | 96.9 | 98.5 | 99.5 | 96.8 | ||
| 93.0 | 98.8 | 98.1 | 97.9 | 98.9 | 97.3 | ||
| 94.8 | 96.9 | 97.7 | 98.4 | 99.1 | 97.6 | ||
| 96.5 | 98.3 | ||||||
|
| |||||||
4.10. Stability of desorbed samples
The stability of desorbed samples was checked by reanalyzing the target concentration samples from Section 4.9. one day later using fresh standards. The sample vials were resealed with new septa after the original analyses and were allowed to stand at room temperature until reanalyzed. The results are given in Table 4.10.
|
| ||||
| % desorption after 24 h
| ||||
| sample no. | 2ME | 2MEA | 2EE | 2EEA |
|
| ||||
| 1 | 95.0 | 100.9 | 98.9 | 101.6 |
| 2 | 97.7 | 99.4 | 99.0 | 101.0 |
| 3 | 98.5 | 101.3 | 99.3 | 101.6 |
| 4 | 98.4 | 101.8 | 99.0 | 101.9 |
| 5 | 99.7 | 101.2 | 100.2 | 101.4 |
| 6 | 98.5 | 101.2 | 100.2 | 101.7 |
| 98.0 | 101.0 | 99.4 | 101.5 | |
|
| ||||
4.11. Chromatograms
A chromatogram of the four analytes is shown in Figure
4.11. The chromatogram is from an injection of a standard
equivalent to a
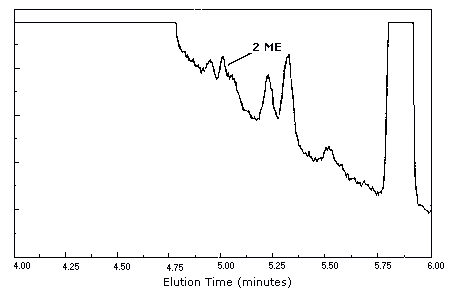
Figure 4.1.1. Detection
limit chromatogram for 2ME.
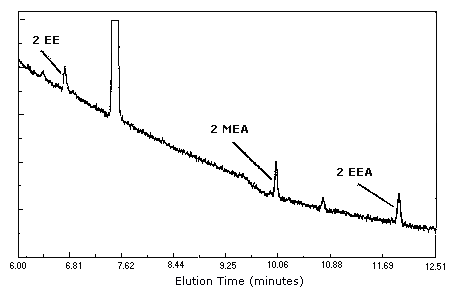
Figure 4.1.2. Detection
limit chromatogram for 2MEA, 2EE, 2EEA.
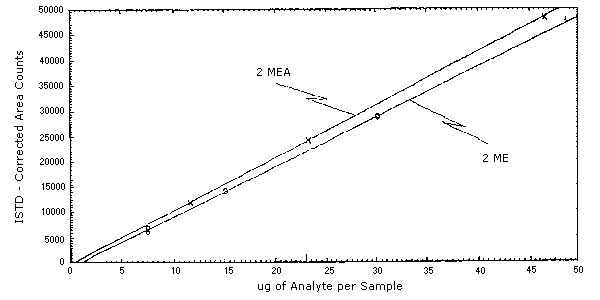
Figure 4.4.1. Instrument
response to 2ME and 2MEA.
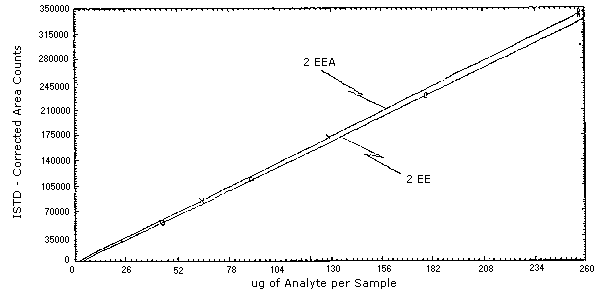
Figure 4.4.2. Instrument
response to 2EE and 2EEA.

Figure 4.5.1.1. 2ME refrigerated storage samples.
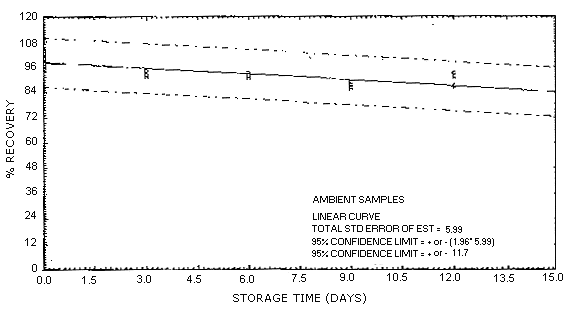
Figure 4.5.1.2. 2ME ambient storage samples.

Figure 4.5.2.1. 2MEA
refrigerated storage samples.

Figure 4.5.2.2. 2MEA ambient storage samples.

Figure 4.5.3.1. 2EE refrigerated storage samples.

Figure 4.5.3.2. 2EE ambient storage samples.
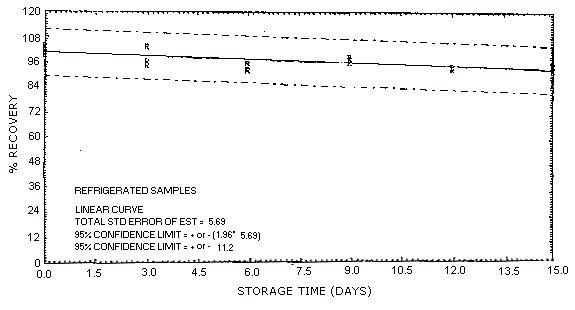
Figure 4.5.4.1. 2EEA
refrigerated storage samples.
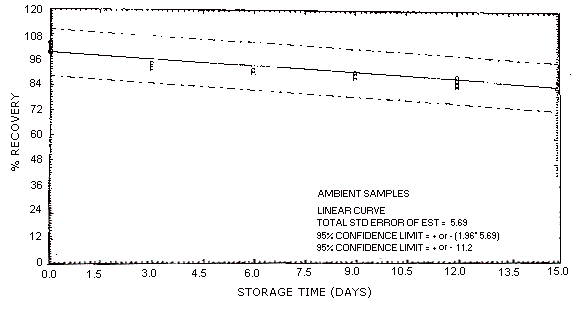
Figure 4.5.4.2. 2EEA ambient storage samples.
Figure 4.11. Chromatogram of a standard at the target concentrations.
Key: (1) 2ME, (2) 2EE, (3)3-methyl-3-pentanol, (4) 2MEA, (5) 2EEA.
Other peaks: (A) methyl alcohol, (B) methylene chloride, (C) chloroform (impurity in methylene chloride), (D) cyclohexene (preservative in methylene chloride).
5. References
5.1.
"OSHA Analytical Methods Manual" U.S. Department of Labor, Occupational Safety and Health Administration; OSHA Analytical Laboratory: Salt Lake City, UT, 1985; Method 53; American Conference of Governmental Industrial Hygienists (ACGIH): Cincinnati, OH, ISBN:5.2. "American Conference of Governmental
Industrial Hygienists: Documentation of the Threshold Limit Values,
Supplemental Documentation for 1982", pp.
5.3. "American Conference of Governmental Industrial Hygienists: Documentation of the Threshold Limit Values, Supplemental Documentation for 1982", p. 260, Cincinnati, OH (1982).
5.4. "American Conference of Governmental Industrial Hygienists: Documentation of the Threshold Limit Values, Supplemental Documentation for 1982", p. 171, Cincinnati, OH (1982).
5.5. "American Conference of Governmental Industrial Hygienists: Documentation of the Threshold Limit Values, Supplemental Documentation for 1982", p. 172, Cincinnati, OH (1982).
5.6. Nagano, K.; Nakayama, E.; Koyano, M.;
Oobayaski, H.; Adachi, H.; Yamada, T. Jap. J. Ind. Health
1979, 21,
5.7. "Current Intelligence Bulletin 39, Glycol Ethers"; May 2, 1983, U.S. Department of Health and Human Services, Public Health Service, Center for Disease Control, NI0SH.
5.8. Fed. Regist. 1987, 52 (No. 63,
Thursday, April 2),
5.9. "Pocket Guide to Chemical Hazards",
NIOSH/OSHA, Sept. 1978, DHEW (NI0SH) Publ. No.
