1. General Discussion
1.1 Background
1.1.1 History
The purpose of
this evaluation was to develop a sampling procedure for diacetyl that
gave a better storage stability than did the NIOSH Method 2557, which
used SKC Anasorb CMS as the sampling media1.The
NIOSH method requires that the samples be refrigerated immediately
after sampling, and the analysis be performed within 7 days. A more
stable sampling media was desired for OSHA samples. The following
media were tested at SLTC but all gave poor storage stability: coconut
shell charcoal Lot 2000, 4-tert-butylcatechol coated charcoal, XAD-7, and
OVS-7. Silica gel tubes (150mg/75 mg) were tried next and had an
average storage recovery of 94.9% for samples stored at room
temperature for 14 days. A sampling train of two silica gel tubes in
series was necessary because a significant amount of the diacetyl was
found on the smaller, backup section of the first tube in the
retention study. A second tube in series insures that all of the
sample will be collected on the sampling train. The desorbing solvent
of 95:5 ethyl alcohol:water with 0.25 µL/mL p-cymene internal standard gave an average
recovery of 99.1% over the concentration range of 26.5 to 529 µg of
diacetyl.
1.1.2 Toxic Effects2,3
(This section is for information only and should not be taken as
the basis of OSHA policy.)
Diacetyl is a skin, eye, mucous
membrane, and respiratory irritant, which is harmful in large
quantities if ingested. The FDA has approved the use of diacetyl as an
artificial flavoring agent, because it is naturally occurring in
butter, beer, coffee, vinegar, and other food products. NIOSH issued a
Health Hazard Alert July 2002 on the worker exposures at a popcorn
plant in Missouri4.
The workers developed a rare lung disease called bronchiolitis
obliterans. It was severe enough to require lung transplants, after
exposure to heated artificially butter flavored soybean oil. The main
volatile organic found in the workplace atmospheres was diacetyl, the
butter flavoring agent. This was chosen as a marker compound for
exposures. The other compounds found in the workplace at lower
concentrations were acetoin and nonanone. The workers at the coating
plant had exposures over 100 ppm diacetyl and exhibited marked lung
function impairment. Workers in the mixing area were exposed to 18 ppm
and showed lesser lung effects. Workers in the packing area were
exposed to 1.8 ppm and had little or no lung effects. The tentative
REL for the NIOSH method was 1 ppm diacetyl based on the exposures
found.5
1.1.3
Workplace exposure6,7
Most
exposures to diacetyl occur in the food industry. Diacetyl is a
naturally occurring chemical in bay and other oils, beer, butter,
coffee, vinegar, and other food products. It is an artificial
flavoring which adds the flavor of butter, cream or creaminess, and
butterscotch. Preliminary studies indicate diacetyl used for taste and
smell of butter may be responsible for the incident. Presently some
138 plants manufacturing butter flavor popcorn employing some 3400
employee may be at risk of contacting lung related illness. NIOSH
found that heated artificial butter flavor soybean oil caused lung
disease in many health hazard surveys of popcorn plants and
bakeries.
1.1.4 Physical properties and other descriptive
information9,10
| CAS number: |
431-03-8 |
IMIS: |
D74011 |
| RTECS number: |
EK2625000 |
molecular weight |
86.09 |
| melting point |
-3ºC |
boiling point: |
88ºC |
| appearance: |
green-yellow liquid |
molecular formula: |
C4H6O2 |
| odor: |
characteristic buttery |
flashpoint: |
6ºC |
| autoignition |
|
density (g/mL): |
0.99 |
| temperature: |
365ºC |
|
|
| solubility: |
ether; alcohol; acetone.
DMSO |
|
| synonyms: |
2,3 -butanedione; 2,3
-diketobutane; dimethyl diketone; dimethylglyoxal |
| structure: |
 |
|
This method was evaluated according to the OSHA SLTC
"Evaluation Guidelines For Air Sampling Methods Utilizing Chromatographic
Analysis"12.
The Guidelines define analytical parameters, specify required laboratory
tests, statistical calculations and acceptance criteria. The analyte air
concentrations throughout this method are based on the recommended
sampling and analytical parameters. Air concentrations listed in ppm are
referenced to 25oC and 101.3 kPa (760 mmHg).
1.2 Detection Limit of the Overall
procedure (DLOP) and Reliable Quantitation Limit (RQL)
The DLOP
is measured as mass per sample and expressed as equivalent air
concentrations, based on the recommended sampling parameters. Ten
samplers were spiked with equal descending increments of analyte, such
that the highest sampler loading was 3.7 µg diacetyl. This is the amount
spiked on a sampler that would produce a peak approximately 3 times the
response for a sample blank. These spiked samplers were analyzed with
the recommended analytical parameters, and the data obtained used to
calculate the required parameters (standard error of estimate and slope)
for the calculation of the DLOP. The slope was 13.89 and the SEE was
41.82. The RQL is considered the lower limit for precise quantitative
measurements.
Table
1.2
Detection Limit of the Overall Procedure for Diacetyl
|
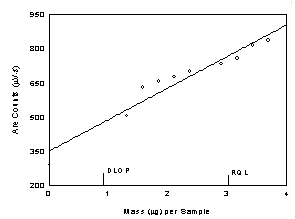
Figure
1.2.1 Plot of data to determine the DLOP/RQL for diacetyl.
(Y=139X+349) |
Mass per
sample
(µg) |
area counts
(µV-s) |
|
0.00
1.3
1.58
1.85
2.11
2.38
2.64
2.90
3.17
3.43
3.70 |
293
504
631
658
676
700
734
759
788
816
838 |
|
RQL is determined from
the regression line parameters obtained for the calculation of the DLOP,
providing 75% to 125% of the analyte is recovered. The DLOP and RQL were
0.902 µg and 3.01 µg respectively
Below is chromatogram of the
RQL level.
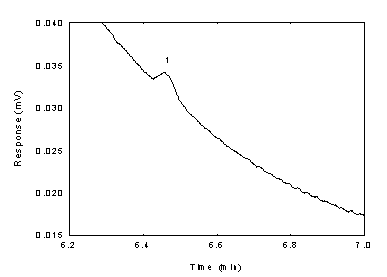
Figure
1.2.2 Chromatogram of the diacetyl standard near RQL
(key: (1)
diacetyl). | 2.
Sampling Procedure
All safety practices that apply to the work area
being sampled should be followed. The sampling equipment should be
attached to the worker in such a manner that it will not interfere with
work performance or safety.
2.1 Apparatus
2.1.1 Samples are collected using a
personal sampling pump calibrated, with the sampling device attached,
to within ±5% of the recommended flow rate.
2.1.2 Silica gel
tubes: glass tube with both ends flame sealed, 70 mm × 6-mm i.d.
containing 2 sections of 20/40 mesh silica gel separated by a 2-mm
portion of urethane foam. The adsorbing section contains 150 mg of
silica gel, the backup section 75 mg. A 3-mm portion of urethane foam
is placed between the outlet end of the tube and the backup section. A
plug of silane-treated glass wool is placed in front of the front
section( SKC No. 226-10) tubes or equivalent was used in this
evaluation. 2.2
Reagents
None required.
2.3 Technique
2.3.1 Immediately before sampling,
break off the ends of the flame-sealed tube to provide an opening
approximately half the internal diameter of the tube. Wear eye
protection when breaking ends. Use tube holders to minimize the hazard
of broken glass. All tubes should be from the same lot.
2.3.2
Connect two tubes in series to the sampling pump with flexible tubing.
The smaller sections of the silica gel tubes should be positioned
nearer the sampling pump. The tube closer to the pump is used as a
backup. A minimum amount of tubing is used to connect the two sampling
tubes together. Position the sampling pump, tube holder and tubing so
they do not impede work performance or safety.
2.3.3 Draw the
air to be sampled directly into the inlet of the tube holder. The air
being sampled is not to be passed through any hose or tubing before
entering the sampling tube.
2.3.4 After sampling for the
appropriate time, remove the adsorbent tube and seal it with plastic
end caps. Seal each sample end-to-end with an OSHA-21 form as soon as
possible.
2.3.5 Submit at least one blank sample with each set
of samples. Handle the blank sample in the same manner as the other
samples except draw no air through it.
2.3.6 Record sample air
volumes (liters), sampling time (minutes) and sampling rate (mL/min)
for each sample, along with any potential interferences on the
OSHA-91A form.
2.3.7 Submit the samples to the laboratory for
analysis as soon as possible after sampling. If delay is unavoidable,
store the samples at refrigerator temperature. Ship any bulk samples
separate from the air samples. 2.4 Extraction efficiency
The extraction efficiency
was determined by liquid-spiking silica gel tubes with diacetyl at 0.1
to 2 times the target concentration. These samples were stored overnight
at ambient temperature and then extracted for 30 minutes with occasional
shaking and analyzed. The mean extraction efficiency over the studied
range was 99.1%. The wet extraction efficiency was determined at the
target concentration by liquid spiking the analyte on the front, larger,
section of the first silica gel tube of the sampling train of two silica
gel tubes in series, and drawing 3 L humid air (absolute humidity of
15.9 mg/L of water, about 80% relative humidity at 22.2ºC) through them.
The mean recovery for the wet samples was 100.2 %
Table
2.4
Extraction Efficiency (%) of Diacetyl
|
| level |
|
sample number |
|
|
×target
concn |
µg per sample |
1 |
2 |
3 |
4 |
5 |
mean |
|
| 0.1 |
26.5 |
105.0 |
105.0 |
105.8 |
100.3 |
100.8 |
103.4 |
| 0.25 |
66.5 |
110.4 |
98.6 |
100.5 |
97.7 |
100 |
101.4 |
| 0.5 |
133 |
91.0 |
90.8 |
90.8 |
90.6 |
95.1 |
91.7 |
| 1.0 |
265 |
98.8 |
100.3 |
99.1 |
98.9 |
99.6 |
99.3 |
| 2.0 |
529 |
100.8 |
101.3 |
99.2 |
98.7 |
99.6 |
99.9 |
|
|
|
|
|
|
|
|
| 1.0 (wet) |
265 |
104.2 |
101.6 |
99.6 |
93.3 |
102.2 |
100.2 |
|
2.5 Retention
efficiency
Six silica gel tubes were spiked with 0.265 mg
(25.ppm) of diacetyl and allowed to equilibrate for 6 h at room
temperature in a drawer.. The spiked tubes were placed in series with a
second unspiked silica gel tube and had 3 L humid air (absolute humidity
of 15.9 mg/L of water, about 80% relative humidity at 22.2ºC) pulled
through them at 0.05 L/min. The samples were extracted and analyzed. The
mean retention recovery was 94.3%. There was no analyte found on the
backup section of any of the tubes.
Table 2.5
Retention Efficiency (%) of Diacetyl
|
|
|
|
sample number |
|
|
|
| section |
1 |
2 |
3 |
4 |
5 |
6 |
mean |
|
| front
(a+b) |
94.3 |
94.1 |
96.8 |
93.7 |
93.8 |
93.1 |
94.3 |
| rear (a) |
0.0 |
0.0 |
0.0 |
0.0 |
0.0 |
0.0 |
0.0 |
| rear (b) |
0.0 |
0.0 |
0.0 |
0.0 |
0.0 |
0.0 |
0.0 |
| total |
94.3 |
94.1 |
96.8 |
93.7 |
93.8 |
93.1 |
94.3 |
|
2.6 Sample
storage
Nine silica gel tubes were spiked with 0.265 mg (25.ppm)
of diacetyl and allowed to equilibrate for 6 h at room temperature in a
drawer. The tubes were placed in series with a second unspiked silica
gel tube and had 3 L humid air (absolute humidity of 15.9 mg/L of water,
about 80% relative humidity at 22.2ºC) pulled through them at 0.05
L/min. Three samples were analyzed immediately, and the rest were sealed
and stored at room temperature in a drawer. Three more were analyzed
after 7 days of storage and the remaining three after 14 days of
storage. The amounts recovered indicate good storage stability for the
time period studied.
Table 2.6
Storage Test
for Diacetyl (% Recovery)
|
|
sample number |
|
| time (days) |
1 |
2 |
3 |
mean |
|
| 0 |
99.4 |
96.9 |
96.2 |
97.5 |
| 7 |
94.5 |
97.7 |
95.0 |
95.7 |
| 14 |
97.2 |
92.8 |
94.8 |
94.9 |
|
2.7 Recommended air
volume and sampling rate.
Based on the data collected in this
evaluation, 3-L air samples should be collected at a sampling rate of
0.05 L/min for 60 minutes.
2.8 Interferences
(sampling)
2.8.1 There are no known compounds
that will severely interfere with the collection of
diacetyl.
2.8.2 Suspected interferences should be reported to
the laboratory with submitted samples.
3. Analytical
Procedure
Adhere to the rules set down in your Chemical Hygiene
Plan. Avoid skin contact and inhalation of all chemicals and review
all appropriate MSDSs.
3.1 Apparatus
3.1.1 A gas chromatograph equipped
with an FID. For this evaluation, an Agilent 6890 Plus gas
Chromatograph equipped with a 7683 Automatic Sampler was
used.
3.1.2 A GC column capable of separating diacetyl from the
desorption solvent, internal standard and any potential interferences.
A 60-m × 0.32-mm i.d. capillary DBWAX with a 0.5-µm df (J&W
Scientific) was used in the evaluation.
3.1.3 An electronic
integrator or some other suitable means of measuring peak areas. A
Waters Millennium32 Data System was used in this
evaluation.
3.1.4 Amber glass vials with
poly(tetrafluoroethylene)-lined caps. For this evaluation 2-mL vials
were used.
3.1.5 A dispenser capable of delivering 1.0 mL of
desorbing solvent to prepare standards and samples. If a dispenser is
not available, a 1.0-mL volumetric pipet may be used.
3.1.7
Volumetric flasks - 10-mL and other convenient sizes for preparing
standards.
3.1.8 Calibrated 10-µL syringe for preparing
standards. 3.2 Reagents
3.2.1 Diacetyl, Reagent grade. Aldrich
99% (lot 09122TS BO) was used in this evaluation.
3.2.2 Ethyl
alcohol, USP grade 190 proof. Aaper (lot 98G23BB ) was used for this
evaluation.
3.2.3 p-Cymene, Reagent
grade. Aldrich 99% (lot 306PZ) was used in this
evaluation.
3.2.4 The extraction solvent was 0.25 µL/mL p-cymene in ethyl alcohol:water
(95:5).
3.2.5 GC grade nitrogen, air, and hydrogen.
3.3 Standard preparation
3.3.1 Prepare working analytical
standards by injecting micro liter amounts of diacetyl into volumetric
flasks containing the extraction solvent. An analytical standard at a
concentration of 0.530 mg/mL (5.3 µL/10 mL) is equivalent to 50 ppm
based on a 3-L air volume. Stock standards were stored in amber vials
at refrigerated temperature for stability.
3.3.2 Bracket sample
concentrations with working standard concentrations. If sample
concentrations are higher than the concentration range of prepared
standards, prepare and analyze additional standards, at least as high
a concentration as the highest sample, to ascertain the linearity of
response, or dilute the sample with extracting solvent to obtain a
concentration within the existing standard range. The range of
standards used in this study was from 0.00132 to 0.60 mg/mL analyze
additional standards, at least as high a concentration as the highest
sample, to ascertain the linearity of response, or dilute the sample
with extracting solvent to obtain a concentration within the existing
standard range. The range of standards used in this study was from
0.00132 to 0.60 mg/mL. 3.4
Sample preparation
3.4.1 Remove the plastic end caps from
the sample tubes and carefully transfer both adsorbent sections from
front tube and each section of backup tube to separate labeled 2-mL
amber glass vials. Discard the glass tube and glass wool
plug.
3.4.2 Add 1.0 mL of extraction solvent to each vial using
the same dispenser as used for preparation of standards.
3.4.3
Immediately seal the vials with poly(tetrafluoroethylene)-lined
caps.
3.4.4 Place vials on shaker and agitate for 60
minutes. 3.5 Analysis
3.5.1 Analytical
conditions.
GC conditions
|
|
| injector: |
200ºC |
| detector: |
250ºC |
| run time: |
16 min |
| column gas flow: |
2.5 mL/min (hydrogen) |
| septum purge: |
1.9 mL/min (hydrogen) |
| injection size: |
1.0 µL (10:1 split) |
| column: |
60-m x 0.32-mm i.d. capillary DBWAX
(0.5-um df) |
| column
temperatures: |
50ºC for 6 min,
15ºC/min to 150ºC final time 3 min |
| retention times: |
5.51 min ethyl alcohol, 6.48 min
diacetyl, 12.46 min p-cymene |
| |
|
FID conditions
|
|
| hydrogen flow |
30mL/min |
| air flow: |
400 mL/min |
| makeup flow: |
25 mL/min (nitrogen |
|
|
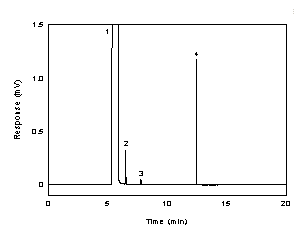
Figure 3.5.1 A chromatogram of 268 µg/ml
diacetyl in 95:5 ethyl alcohol:water with 0.25 µl of p-cymene as
internal standard. (Key: (1) ethyl alcohol, (2) diacetyl,
(3) impurity, and (4)
p-cymene). |
3.5.2 Peak areas are measured by an integrator or other
suitable means.
3.5.3 An internal standard (ISTD) calibration
method is used. A calibration curve can be constructed by plotting
ISTD-corrected response of standard injections versus micrograms of
analyte per sample. Bracket the samples with freshly prepared
analytical standards over a range of concentrations
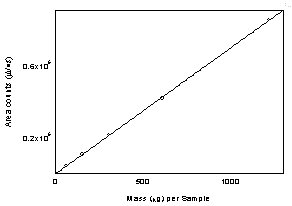
Figure
3.5.3 Calibration curve of diacetyl.
(Y = 696 x -
336) |
3.6
Interferences (analytical)
3.6.1 Any compound that produces a GC
response and has a similar retention time as the analyte is a
potential interference. If any potential interferences were reported,
they should be considered before samples are extracted. Generally,
chromatographic conditions can be altered to separate an interference
from the analyte.
3.6.2 When necessary, the identity or purity
of an analyte peak may be confirmed by mass spectrometry or by another
analytical procedure. The mass spectrum in Figure 3.6.2 was from the
NIST spectral library.
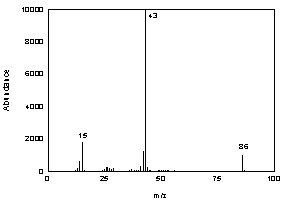
Figure 3.6.2 Mass spectrum of
diacetyl. |
3.6.3
Calculations
The amount of analyte per sampler is obtained from
the appropriate calibration curve in terms of micrograms per sample,
uncorrected for extraction efficiency. This total amount is then
corrected by subtracting the total amount (if any) found on the blank.
The air concentration is calculated using the following
formulas.
 |
where |
Cm is concentration by weight
(mg/m3) |
|
M is micro grams per sample |
|
V is liters of air sampled |
|
EE is extraction efficiency, in
decimal form |
| |
|
|
 |
where |
CV is concentration by volume
(ppm) |
|
VM is molar volume ate
25°C=24.46 |
|
CM is concentration by weight |
| |
Mr is molecular weight =
86.09 | 4. Recommendations for Further Study
Several other
tests need to be performed to make this a validated
method.
1. NIOSH Method 2557, http://www.cdc.gov/niosh,
(accessed July 2002).
2. O’Neil, M., The Merck
Index, 13th ed., Merck & Co. Inc.: Whitehouse Station, NJ,
2001, p 522.
3. Lewis, R., Sax’s Dangerous
Properties of Industrial Materials, 10th ed., Vol. 2, John Wiley
& Sons, New York, 2000, p 595.
4. NIOSH, NIOSH Evaluates Worker Exposures at a Popcorn Plant in
Missouri, Cincinnatti OH, HHE 2002-128.
5. NIOSH Method
2557, http://www.cdc.gov/niosh, (accessed July 2002).
6. O’Neil,
M., The Merck Index, 13th ed., Merck & Co.
Inc.: Whitehouse Station, NJ, 2001, p 522.
7. Lewis, R., Sax’s Dangerous Properties of Industrial Materials,
10th ed., Vol. 2, John Wiley & Sons, New York, 2000, pg 595.
8.
NIOSH HHS, www.cdc.gov/niosh accessed 01/20/03.
9. O’Neil, M.,
The Merck Index, 13th ed., Merck
& Co. Inc.: Whitehouse Station, NJ, 2001, p 522.
10. Lewis, R.,
Sax’s Dangerous Properties of Industrial
Materials, 10th ed., Vol. 2, John Wiley & Sons, New
York, 2000, p 595.
11. OSHA Chemical Sampling Guide,
http//www.osha.gov.
12. Burright, D.; Chan, Y.; Eide, M.; Elskamp,
C.; Hendricks, W.; Rose, M. C. Evaluation Guidelines
For Air Sampling Methods Utilizing Chromatographic Analysis ; OSHA
Salt Lake Technical Center, U.S. Department of Labor: Salt Lake City, UT,
1999. |

