![]()
| Method number: | 108 |
| Matrix: | Air |
| Target concentration: | 10 ppb (13 µg/m3) and 1 ppm (1.3 mg/m3) |
| OSHA PEL: | 1 ppm (1.3 mg/m3) |
| ACGIH TLV: | 10 ppb (13 µg/m3) |
| Procedure: | Samples are collected closed-face by drawing known volumes of
air through sampling devices consisting of |
| Recommended air volume and sampling rate: |
240 L at 1.0 L/min |
| Reliable quantitation limit: | 0.058 ppb (0.076 µg/m3) |
| Standard error of estimate at the target concentration: |
7.5% at 10 ppb Target Concentration 5.2% at 1 ppm Target Concentration |
| Status of method: | Evaluated method. This method has been subjected to the established evaluation procedures of the Organic Methods Evaluation Branch. |
| Date: February 1997 | Chemist: Carl J. Elskamp |
OSHA Salt Lake Technical Center
Salt Lake City, UT 84165-0200
1. General Discussion
- 1.1 Background
- 1.1.1 History
In 1980, an air sampling and analytical procedure to determine
hydrazine was validated by the OSHA Analytical Laboratory. (Ref.
5.1) The method (OSHA
Method 20) is based on a field procedure developed by the U.S.
Air Force that involves collection of samples using sulfuric acid
coated Gas Chrom R and colorimetric analysis using
After Method 20 was completed, sulfuric acid treated Gas Chrom R adsorbent tubes became commercially available. Since that time, the OSHA SLTC (Salt Lake Technical Center) has received comments from other laboratories reporting low extraction efficiencies and sample recoveries when using the commercial tubes. It was decided that these concerns would be investigated. Also, because ACGIH lowered the TLV from 100 ppb to 10 ppb (Ref. 5.3) since Method 20 was validated and because OSHA may consider lowering the PEL from 1 ppm in the future, the methodology was evaluated at lower levels with test atmospheres. It was not possible for OSHA to generate hydrazine test atmospheres when Method 20 was validated. Since that time, a controlled test atmosphere generation system was constructed at the OSHA SLTC that can be used to safely generate atmospheres from toxic compounds such as hydrazine.
A 2.1-ppm atmosphere was generated and samples were collected
using both commercial sulfuric acid treated Gas Chrom R sampling
tubes and sampling tubes that were prepared
Initial tests using sulfuric acid treated Gelman A/E filters at ppm levels of hydrazine showed collection efficiencies, recoveries, and extraction efficiencies to be essentially 100%. The recovery of hydrazine collected from test atmospheres is not quite as good at ppb levels. In an attempt to enhance recoveries, filters treated with either EDTA or Vitamin C alone or with sulfuric acid were tested with no improvement. The filters were also treated with different mineral acids, including hydrochloric, nitric and phosphoric acid, but again recoveries were no better than when just sulfuric acid was used. Gelman A/E filters were used in the methods for aromatic amines and may be suitable for hydrazine, but it was found that the thicker A/B filters formed tighter seals in the filter cassettes and they also provided slightly better collection efficiencies. The A/B filters can also be used for aromatic amines with no other change in the methods.
Improvements were also made to the analytical procedure. It was
found that the room temperature formation of benzalazine from
hydrazine and benzaldehyde proceeded to completion in less than 30
minutes at about pH 3.5. Also, the use of EDTA disodium enhanced the
stability of extracted samples, so an aqueous EDTA disodium solution
buffered to pH 3.5 is used to extract the filter samples.
Acetonitrile is now used instead of methyl alcohol as the solvent
for benzaldehyde. The recommended air volume was 20 L in Method 20,
but in order to obtain a lower reliable quantitation limit and to
have a more convenient sampling time of 4 hours, 240 L is the new
recommended air volume. The amount of benzalazine formed from
1.1.2 Toxic effects (This section is for information only and should not be taken as the basis of OSHA policy.)
Hydrazine is carcinogenic in experimental animals and is a suspected human carcinogen. (Ref. 5.3) It is corrosive to the eyes, skin, and mucous membranes. The liver, kidney, and hematopoietic system are the main target organs following repeated exposures. (Ref. 5.12)
1.1.3 Workplace exposure
Hydrazine is chiefly used as a chemical intermediate in the production of agricultural chemicals, spandex fibers and antioxidants. It is also used as a rocket fuel, oxygen scavenger in boiler water treatment, polymerization catalyst, blowing agent, and scavenger for gases. (Ref. 5.3)
1.1.4 Physical properties (Ref. 5.13 unless otherwise denoted)
| CAS number: | 302-01-2 |
| molecular weight: | 32.06 |
| boiling point: | 113.5°C |
| melting point: | 1.4°C |
| appearance: | colorless, oily, fuming liquid or white crystals |
| density: | 1.1011 at 15°C |
| molecular formula: | H4N2 |
| vapor pressure: | 1.3 kPa at 20°C (Ref. 5.3) |
| flash point: | 100°F (37.8°C) (open cup) |
| odor: | penetrating, resembling ammonia |
| lower explosive limit: | 4.7% (Ref. 5.3) |
| synonyms: | Diamide; diamine; hydrazine, anhydrous (DOT); hydrazine, aqueous solution (DOT); hydrazine base; hydrazyna (Polish); RCRA waste number U133 |
| structural formula: | H2NNH2 |
The analyte air concentrations throughout this method are based on the recommended sampling and analytical parameters. Air concentrations listed in ppb and ppm are referenced to 25°C and 101.3 kPa (760 mmHg). Although benzalazine is the actual species analyzed, all masses presented are in terms of hydrazine.
1.2 Limit defining parameters
- 1.2.1 Detection limit of the analytical procedure
The detection limit of the analytical procedure is 10.6 pg. This is the amount of analyte that will give a response that is significantly different from the background response of a reagent blank. (Sections 4.1 and 4.2)
1.2.2 Detection limit of the overall procedure
The detection limit of the overall procedure is 5.48 ng per sample (0.017 ppb or 0.023 µg/m3). This is the amount of analyte spiked on the sampler that will give a response that is significantly different from the background response of a sampler blank. (Sections 4.1 and 4.3)
1.2.3 Reliable quantitation limit
The reliable quantitation limit is 18.3 ng per sample (0.058 ppb or 0.076 µg/m3). This is the amount of analyte spiked on a sampler that will give a signal that is considered the lower limit for precise quantitative measurements. (Section 4.4)
1.2.4 Precision (analytical procedure)
The precisions of the analytical procedure, measured as the
pooled relative standard deviation over concentration ranges
equivalent to 0.5 to 2 times the target concentration, are 0.26% and
0.09% based on the
1.2.5 Precision (overall procedure)
The precisions of the overall procedure at the 95% confidence level for the ambient temperature storage tests are ±14.8% and ±10.1% at 9.4 ppb and 1.06 ppm respectively. These include an additional 5% for sampling error. (Section 4.6)
1.2.6 Recovery
The recovery of hydrazine from samples used in a 19-day storage
test remained above 78% at the
1.2.7 Reproducibility
Six samples at each target concentration that were collected from
controlled test atmospheres, along with a draft copy of this
procedure, were submitted to an SLTC service branch for analysis.
The samples were analyzed after 63 and 58 days of storage at 0°C for
the
2. Sampling Procedure
- 2.1 Apparatus
- 2.1.1 Samples are collected using a personal sampling pump
calibrated, with a sampling device attached, to within ±5% at the
recommended flow rate.
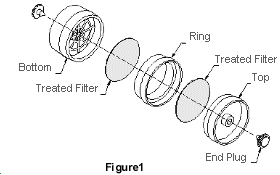 2.1.2
Samples are collected
2.2 Reagents
None required
2.3 Technique
- 2.3.1 Remove the plastic end plugs from the sampling device
immediately before sampling. Samples are collected closed-face.
2.3.2 Attach the sampling device to the sampling pump with flexible tubing and place the device in the employee's breathing zone. Position the sampler so it does not impede work performance or safety.
2.3.3 Do not pass the sampled air through any hose or tubing before it enters the sampling device.
2.3.4 Immediately after sampling, seal the sampling device with
plastic end plugs and seal and identify with a Form
2.3.5 Submit at least one blank with each sample set. Blanks should be handled in the same manner as samples, except no air is drawn through them.
2.3.6 Record sample volumes (in liters of air) for each sample. Also list any compounds considered potential interferences that could be present in the sampling area.
2.3.7 If any bulk samples are submitted for analysis, ship them in separate containers from the air samples.
2.3.8 Submit the samples to the laboratory for analysis as soon as possible after sampling. If delay is unavoidable, store the samples at reduced temperature.
2.4 Sampler capacity
Sampler capacity is determined by measuring how much air can be
sampled before breakthrough of analyte through the sampler occurs,
i.e., the sampler capacity is exceeded. Breakthrough is considered to
occur when the effluent from the sampler contains a concentration of
analyte that is 5% of the upstream concentration (5% breakthrough).
Tests for breakthrough were performed by simultaneously sampling at 1
L/min from a hydrazine atmosphere (81.5% RH, 23.6°C) at 2.1 ppm using
four samplers. The sampler flows were momentarily interrupted and the
back filters were removed and replaced with fresh filters every hour
after sampling began over a period of 8 hours. The back filters were
analyzed to determine the hydrazine concentration in the effluents. At
no time during the
2.5 Extraction efficiency
- 2.5.1 The average extraction efficiencies over the range of 0.5
to 2 times the target concentrations are 98.7% and 98.9% based on
the
2.5.2 The extraction efficiency at 0.05, 0.1, and 0.2 times the
target concentration was found to be 97.7%, 97.5%, and 96.3%
respectively based on the
2.5.3 Both extracted and extracted/derivatized samples at each target concentration remain stable for at least 24 h. (Section 4.9.2)
2.6 Recommended air volume and sampling rate
- 2.6.1 For long-term samples, sample 240 L of air at 1 L/min (4-h
samples).
2.6.2 For short-term samples, sample 15 L of air at 1 L/min (15-min samples).
2.6.3 When short-term samples are collected, the air concentration equivalent to the reliable quantitation limit becomes larger. For example, the reliable quantitation limit is 0.93 ppb (1.22 µg/m3) when 15 L of air is sampled.
2.7 Interferences (sampling)
- 2.7.1 It is not known if any compounds will severely interfere
with the collection of hydrazine on sulfuric acid treated filters.
In general, any compound in the sampled air that would react with
sulfuric acid to decrease the amount on the filter will decrease the
breakthrough volume. Also, any compound that will react with
hydrazine or hydrazine sulfate is a potential interference.
2.7.2 Suspected interferences should be reported to the laboratory with submitted samples.
2.8 Safety precautions (sampling)
- 2.8.1 Attach the sampling equipment to the employee so that it
will not interfere with work performance or safety.
2.8.2 Follow all safety procedures that apply to the work area being sampled.
3. Analytical Procedure
- 3.1 Apparatus
- 3.1.1 An LC system equipped with an ultraviolet detector. A
Hewlett-Packard 1050 Series LC consisting of a pumping system, a
programmable variable wavelength detector and an autosampler was
used in this evaluation.
3.1.2 An LC column capable of separating the analyte of interest
from any interferences. A
3.1.3 An electronic integrator or some other suitable means of measuring peak areas or heights. A Waters Millennium Networking Computer System was used in this evaluation.
3.1.4 Glass vials with Teflon®-lined caps. Kimble
Glass Co. 7-mL disposable scintillation vials (part no.
3.1.5 Hand held dispensers (repeating pipettors) capable of delivering 0.5, 1.0 and 5.0 mL for preparing and transferring standards and sample extracts and for dispensing the derivatizing solution. If dispensers are not available, volumetric pipettes may be used instead.
3.1.6 A test tube rotator to mix the samples during the extraction step.
3.1.7 A laboratory centrifuge.
3.2 Reagents
- 3.2.1 Hydrazine or hydrazine solution, reagent grade. Aldrich
Chemical (Milwaukee, WI) Lot 21131EN anhydrous hydrazine was used in
this evaluation. Hydrazine is a highly toxic sensitizer, mutagen,
and cancer suspect agent that is readily absorbed through skin. It
is also a corrosive and combustible liquid and a strong reducing
agent that should be stored under nitrogen.
Standards may alternatively be prepared from reagent grade benzalazine or from a reagent grade hydrazine salt, such as hydrazine dihydrochloride or hydrazine sulfate.
3.2.2 Acetonitrile, methanol, and water, LC grade. The
acetonitrile and methanol used in this evaluation were "Optima"
brand from Fisher Chemical (Fair Lawn, NJ) and the water was from a
Millipore
3.2.3 Benzaldehyde, reagent grade. Aldrich Lot 03628KN was used in this evaluation. Benzaldehyde is an irritant, mutagen, sensitizer, and cancer suspect agent. It is air and light sensitive and should be store under nitrogen.
3.2.4 Sodium phosphate, monobasic monohydrate (NaH2PO4· H2O), reagent grade. Fisher Lot 704979 was used in this evaluation.
3.2.5 EDTA disodium, from ethylenediaminetetraacetic acid, disodium salt dihydrate, reagent grade. Aldrich Lot 14428LZ was used in this evaluation.
3.2.6 Phosphoric acid, reagent grade.
3.2.7 Extraction solution, consisting of an aqueous solution of 0.1 M NaH2PO4· H2O/0.05 M EDTA disodium adjusted to pH 3.5 with phosphoric acid.
3.2.8 Derivatizing solution, prepared by diluting 1.0 mL of benzaldehyde to 100 mL with acetonitrile. The derivatizing solution should be prepared fresh daily.
3.3 Standard preparation
- 3.3.1 Prepare concentrated stock solutions by accurately
diluting a known amount of hydrazine with methanol. Stock solutions
are stable for at least 3 days when refrigerated. Standards can
alternatively and more conveniently be prepared from hydrazine
dihydrochloride, hydrazine sulfate or benzalazine. Stock standards
from hydrazine salts should be prepared in water, while standards
from benzalazine should be prepared in acetonitrile. If standards
are preprared from one of the salts or benzalazine, the appropriate
conversion factor to determine the equivalent mass of hydrazine must
be used. For example, if hydrazine sulfate (MW = 130.12) is used to
make standards, the mass of hydrazine sulfate weighed out must be
multiplied by 0.2464 (32.06 ÷ 130.12) to obtain the equivalent mass
of hydrazine.
3.3.2 Prepare analytical standards by injecting microliter
amounts of stock standards into
3.3.3 Derivatize the analytical standards by transferring 1.0 mL of the standards to separate autosampler vials and adding 0.5 mL of derivatizing solution to each vial. Cap each vial and shake it for a few seconds to obtain thorough mixing. Allow the vials to sit at room temperature for at least 30 min before analysis. Analyze the derivatized standards by LC.
3.3.4 Bracket sample concentrations with analytical standard
concentrations. If samples fall outside of the concentration range
of prepared standards, prepare and analyze additional standards at
the appropriate concentrations to ascertain the linearity of
response. Theoretically, there is enough benzaldehyde added to the
vials to prepare standards as high as 2.5 ppm for
3.4 Sample preparation
- 3.4.1 Transfer front and back filters to individual 7-mL vials.
3.4.2 Add 5.0 mL of extraction solution to each vial using the same dispenser or pipet as used for preparation of standards.
3.4.3 Cap the vials and mix them on a rotator for 30 min.
3.4.4 Centrifuge the sample vials for 10 min at 2000 rpm.
3.4.5 Derivatize the samples by transferring 1.0 mL of the centrifuged extracts to separate autosampler vials and adding 0.5 mL of derivatizing solution to each vial. Cap each vial and shake them for a few seconds to obtain thorough mixing. Allow the vials to sit at room temperature for at least 30 min before analysis. Analyze the derivatized samples by LC. As a precautionary step, the sample extracts should be derivatized as soon as possible after they are extracted and centrifuged.
3.5 Analysis
- 3.5.1 LC conditions
| mobile phase: | 67/33, acetonitrile/water |
| flow rate: | 1.0 mL/min |
| UV detector wavelength: | 300 nm |
| detector range: | 2 AUFS for 1-ppm target concentration 0.02 AUFS for 10-ppb target concentration |
| injection volume: | 4.5 µL |
| column: | 12.5-cm × 4-mm i.d. LiChrospher 100
|
| retention time: | 5.8 min |
3.5.2 Peak areas or heights are measured by an integrator or other suitable means.
3.5.3 An external standard (ESTD) calibration method is used. Calibration curves are prepared by plotting the amount of analyte per sample versus peak heights or area counts of the standards. Sample concentrations must be bracketed by standards.
3.6 Interferences (analytical)
- 3.6.1 Any compound that produces a response on a UV detector at
300 nm and has the same general retention time of benzalazine is a
potential interference. Possible interferences should be reported to
the laboratory with submitted samples by the industrial hygienist.
These interferences should be considered before samples are
extracted.
3.6.2 LC parameters may be changed to possibly circumvent interferences.
3.6.3 When necessary, the identity or purity of an analyte peak may be confirmed with additional analytical data, such as wavelength ratioing. As an aid in choosing appropriate wavelengths to ratio, the UV spectrum of benzalazine is given in Section 4.10.
3.7 Calculations
The hydrazine concentration for samples is obtained from the calibration curve in terms of micrograms of hydrazine per sample. The back filter of each sampler is analyzed primarily to determine if there was any breakthrough from the front filter during sampling. If a significant amount of analyte is found on the back filter, this fact should be reported with sample results. If any analyte is found on the back filter, it is added to the amount found on the front filter. This total amount is then corrected by subtracting the total amount (if any) found on the blank. The air concentration is calculated using the following formula.
mg/m³ = (µg of hydrazine per sample) / [(L of air sampled)(extraction efficiency)]
ppm = [(mg/m³)(24.46)] / 32.06 = (mg/m³)(0.7629)
3.8 Safety precautions (analytical)
- 3.8.1 Adhere to the rules set down in your Chemical Hygiene
Plan.
3.8.2 Avoid skin contact and inhalation of all chemicals.
3.8.3 Wear safety glasses and a lab coat at all times while in the lab area.
4. Backup Data
- 4.1 Determination of detection limits
Detection limits (DL), in general, are defined as the amount (or concentration) of analyte that gives a response (YDL) that is significantly different (three standard deviations (SDBR)) from the background response (YBR).
YDL - YBR = 3(SDBR)
The direct measurement of YBR and SDBR in chromatographic methods is typically inconvenient and difficult because YBR is usually extremely low. Estimates of these parameters can be made with data obtained from the analysis of a series of analytical standards or samples whose responses are in the vicinity of the background response. The regression curve obtained for a plot of instrument response versus concentration of analyte will usually be linear. Assuming SDBR and the precision of data about the curve are similar, the standard error of estimate (SEE) for the regression curve can be substituted for SDBR in the above equation. The following calculations derive a formula for DL:

| Yobs = | observed response |
| Yest = | estimated response from regression curve |
| n = | total no. of data points |
| k = | 2 for linear regression curve |
At point YDL on the regression curve
- YDL = A(DL) +
YBR
A = analytical sensitivity (slope)
therefore
| DL = | A |
Substituting 3(SEE) + YBR for YDL gives
| DL = | A |
4.2 Detection limit of the analytical procedure (DLAP)
The DLAP is measured as the mass of analyte introduced into the chromatographic column. Ten analytical standards were prepared in equal descending increments with the highest standard containing 31.88 ng of hydrazine per sample. This standard produces a peak approximately 10 times the baseline noise of a reagent blank. Standards, plus a reagent blank, were analyzed and the data obtained were used to determine the required parameters (A and SEE) for the calculation of the DLAP. Values of 2222 and 7881 were obtained for A and SEE respectively. The DLAP was calculated to be 10.6 pg.
|
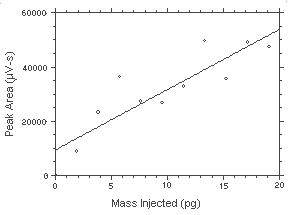 Figure 4.2. Plot of the data from Table 4.2 to determine the DLAP of 10.6 pg. The equation of the line is | |||||||||||||||
4.3 Detection limit of the overall procedure (DLOP)
The DLOP is measured as mass per sample and expressed as equivalent air concentrations, based on the recommended sampling parameters. Ten samplers were spiked with equal descending increments of hydrazine such that the highest sampler loading was 31.88 ng/sample. This is the amount, when spiked on a sampler, that would produce a peak approximately 10 times the baseline noise for a sample blank. These spiked samplers, plus a sample blank, were analyzed with the recommended analytical parameters, and the data obtained used to calculate the required parameters (A and SEE) for the calculation of the DLOP. Values of 1553 and 2839 were obtained for A and SEE respectively. The DLOP was calculated to be 5.48 ng/sample (0.017 ppb or 0.023 µg/m3).
|
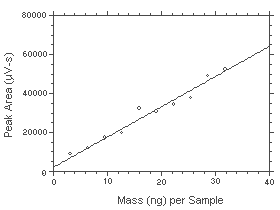 Figure 4.3. Plot of the data from Table 4.3 to determine the DLAP of 5.48 ng/sample (0017 ppb or 0.023 µg/m3). The equation of the line is | |||||||||||
4.4 Reliable quantitation limit (RQL)
| The RQL is considered the lower limit for precise
quantitative measurements. It is determined from the regression
line data obtained for the calculation of the DLOP (Section
4.3). The RQL is defined as the amount of analyte that gives
a response (YRQL) such that
YRQL - YBR = 10(SDBR) therefore
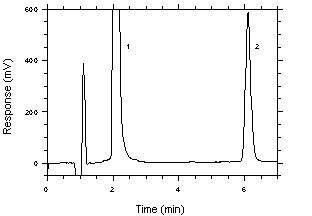
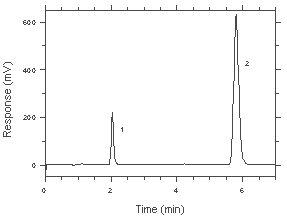
| 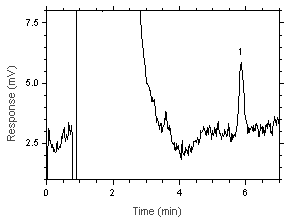 Figure 4.4. Chromatogram of the RQL. Key: (1) Benzalazine (as hydrazine) |
The RQL was calculated to be 18.3 ng/sample (0.058 ppb or 0.076 µg/m3). The recovery at this level is 90.2%.
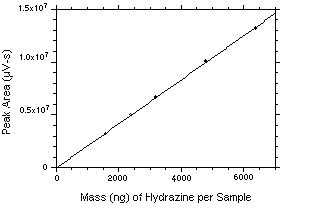
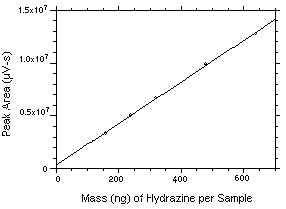
4.5 Precision (analytical method)
The precisions of the analytical procedure are defined as the
pooled relative standard deviations (RSDP).
Relative standard deviations were determined from six replicate
injections of standards at 0.5, 0.75, 1, 1.5, and 2 times the target
concentrations. After assuring that the RSDs satisfy the Cochran test
for homogeneity at the 95% confidence level, the
RSDPs were calculated to be 0.26% and 0.09%
based on the
|
| |||||
| × target concn (ng/sample) |
0.5× 1594 |
0.75× 2390 |
1.0× 3187 |
1.5× 4781 |
2.0× 6374 |
|
| |||||
| peak areas (µV· s) |
3187300 3176400 3164800 3175300 3173000 3176900 |
5022900 5002500 5006200 5001200 4991800 4996400 |
6648300 6601100 6615000 6595100 6620900 6627700 |
10115000 10032000 10035000 10043000 10017000 10026000 |
13192000 13161000 13144000 13184000 13167000 13130000 |
| mean SD RSD (%) |
3175600 7248.6 0.228 |
5003500 10745 0.215 |
6618000 19181 0.290 |
10045000 35545 0.354 |
13163000 23461 0.178 |
|
| |||||
The Cochran test for homogeneity:
| g = | largest RSD2
|
= 0.369 |
The critical value of the g statistic at the 95% confidence level for five variances, each associated with six observations, is 0.5065. Because the g statistic does not exceed this value, the RSDs can be considered equal and they can be pooled (RSDP) to give an estimated RSD for the concentration range studied.

|
| |||||
| × target concn (µg/sample) |
0.5× 159.4 |
0.75× 239.0 |
1.0× 318.7 |
1.5× 478.1 |
2.0× 637.4 |
|
| |||||
| peak areas (µV· s) |
3338300 3331000 3334800 3336100 3336200 3336800 |
5030400 5035000 5036400 5039600 5040700 5046400 |
6668100 6672700 6674500 6682700 6684100 6685400 |
9869800 9877700 9877900 9878900 9879000 9890700 |
12721000 12741000 12744000 12745000 12746000 12752000 |
| mean SD RSD (%) |
3335500 2494.5 0.075 |
5038100 5471.5 0.109 |
6677900 7104.5 0.106 |
9879000 6699.9 0.068 |
12742000 10672 0.084 |
|
| |||||
The Cochran test for homogeneity:
| g = | largest RSD2
|
= 0.294 |
The critical value of the g statistic at the 95% confidence level for five variances, each associated with six observations, is 0.5065. Because the g statistic does not exceed this value, the RSDs can be considered equal and they can be pooled (RSDP) to give an estimated RSD for the concentration range studied.

4.6 Precision (overall procedure)
The precision of the overall procedure is determined from the storage data in Section 4.7. The determination of the standard error of estimate (SEER) for a regression line plotted through the graphed storage data allows the inclusion of storage time as one of the factors affecting overall precision. The SEER is similar to the standard deviation, except it is a measure of dispersion of data about a regression line instead of about a mean. It is determined with the following equation:

| n = k = k = |
total no. of data points 2 for linear regression 3 for quadratic regression |
| Yobs = | observed % recovery at a given time |
| Yest = | estimated % recovery from the regression line at the same given time |
An additional 5% for pump error (SP) is added to the SEER by the addition of variances to obtain the total standard error of estimate.

The precision at the 95% confidence level is obtained by
multiplying the standard error of estimate (with pump error included)
by 1.96 (the z statistic from the standard normal distribution
at the 95% confidence level). The 95% confidence intervals are drawn
about their respective regression lines in the storage graphs, as
shown in Figures 4.7.1.1,
4.7.1.2,
4.7.2.1
and 4.7.2.2.
The precisions of the overall procedure of ±14.8% and ±10.1% were
obtained from Figures 4.7.1.2 and 4.7.2.2 for
Storage samples were prepared by sampling at 1 L/min from two
different controlled test atmospheres, one at 9.40 ppb and the other
at 1.06 ppm. Both atmospheres were at approximately 80% RH and at room
temperatures ranging from
|
| |||||||
| time (days) |
refrigerated storage recovery (%) |
ambient storage recovery (%) | |||||
|
| |||||||
| 0 0 3 6 11 14 19 |
90.7 90.9 82.0 90.0 92.8 91.3 86.8 |
72.4 94.9 90.1 92.6 89.3 94.6 98.2 |
84.5 85.7 81.4 86.8 83.6 82.6 89.4 |
90.7 90.9 83.8 78.9 75.8 83.3 77.9 |
72.4 94.9 87.0 90.0 77.8 79.6 74.5 |
84.5 85.7 86.6 86.9 80.3 75.2 88.7 | |
|
| |||||||
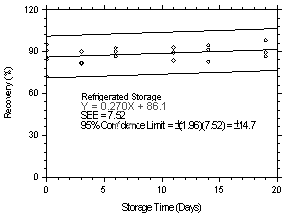 Figure 4.7.1.1. Refrigerated storage test at 9.40 ppb. |
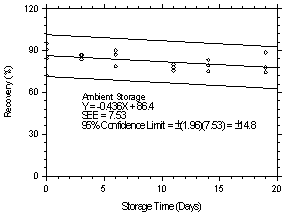 Figure 4.7.1.2. Ambient storage test at 9.40 ppb. |
|
| |||||||
| time (days) |
refrigerated storage recovery (%) |
ambient storage recovery (%) | |||||
|
| |||||||
| 0 0 3 7 10 15 20 |
96.2 95.5 94.8 102.4 98.9 97.0 99.6 |
97.8 95.8 92.7 99.2 97.6 97.8 98.4 |
95.8 97.2 93.5 100.7 97.2 99.1 99.6 |
96.2 95.5 95.3 98.7 96.3 99.5 97.6 |
97.8 95.8 93.2 97.6 96.9 98.1 98.4 |
95.8 97.2 94.2 98.1 97.1 99.3 98.1 | |
|
| |||||||
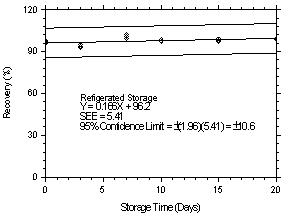 Figure 4.7.2.1. Refrigerated storage test at 1.06 ppm. |
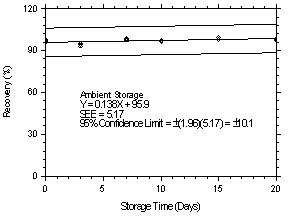 Figure 4.7.2.2. Ambient storage test at 1.06 ppm. |
Reproducibility samples were prepared by sampling at 1 L/min from
two different controlled test atmospheres, one at 9.40 ppb and the
other at 1.06 ppm. Both atmospheres were at approximately 80% RH and
at room temperatures ranging from
|
| ||||
| sample | ng reported | ng expected | percent | deviation |
|
| ||||
| 1 2 3 4 5 6 |
2497 2319 2406 2492 1880 2434 |
2657 2524 2732 2641 2780 2611 |
94.0 91.9 88.1 94.4 67.6 93.2 |
-6.0 -8.1 -11.9 -5.6 -32.4 -6.8 |
|
| ||||
|
| ||||
| sample | µg reported | µg expected | percent | deviation |
|
| ||||
| 1 2 3 4 5 6 |
340.5 331.8 293.4 340.2 286.4 330.6 |
335.5 328.8 308.9 343.2 290.7 332.8 |
101.5 100.9 95.0 99.1 98.5 99.3 |
+1.5 +0.9 -5.0 -0.9 -1.5 -0.7 |
|
| ||||
4.9 Extraction efficiency and stability of extracted samples
- 4.9.1 Extraction efficiency
The extraction efficiencies (EE) for the two levels were
determined by injecting standards onto sulfuric acid treated filters
with amounts equivalent to 0.05 to 2 times the target
concentrations. The average extraction efficiencies over the working
range of 0.5 to 2 times the target concentrations are 98.7% and
98.9% based on the
|
| ||||||
| × target concn mass spiked (ng) |
0.05× 157.4 |
0.1× 314.7 |
0.2× 629.5 |
0.5× 1574 |
1.0× 3147 |
2.0× 6295 |
|
| ||||||
| EE (%) | 98.2 96.1 96.7 96.4 101.5 97.2 |
98.4 99.0 97.7 97.0 96.4 96.3 |
96.0 96.4 97.0 95.3 96.1 97.1 |
98.4 98.6 98.8 99.0 99.0 98.9 |
98.2 98.3 98.1 98.3 98.0 97.9 |
98.6 98.7 100.4 99.3 99.0 99.0 |
| mean | 97.7 | 97.5 | 96.3 | 98.8 | 98.1 | 99.2 |
|
| ||||||
|
| ||||||
| × target concn mass spiked (µg) |
0.05× 15.74 |
0.1× 31.47 |
0.2× 62.95 |
0.5× 157.4 |
1.0× 314.7 |
2.0× 629.5 |
|
| ||||||
| EE (%) | 98.3 98.2 98.3 98.1 98.3 98.2 |
98.5 97.9 97.4 98.2 98.1 97.9 |
98.5 98.6 98.6 98.6 98.7 98.4 |
98.9 99.0 99.2 99.4 99.5 99.2 |
99.3 99.0 99.2 99.0 99.0 98.5 |
98.7 98.3 98.3 98.3 98.6 98.5 |
| mean | 98.2 | 98.0 | 98.6 | 99.2 | 99.0 | 98.4 |
|
| ||||||
4.9.2 Stability of extracted and extracted/derivatized samples
The stability of extracted samples at the two target
concentrations was investigated by analyzing subsequent aliquots of
the extracted samples 24 h after the samples were initially
extracted. Three of the extracted samples (the filters were still in
the vials) were refrigerated, and the other three were allowed to
stand at room temperature on a laboratory bench top for each target
concentration. Aliquots of the stored extracts were analyzed with
fresh standards. The average percent change was +0.8% and +0.7% for
sample extracts that were refrigerated, and +0.3% and +0.3% for
those stored at room temperature at the
|
| ||||||
| extracts refrigerated | extracts at room temperature | |||||
| initial EE (%) |
EE after one day (%) |
difference | initial EE (%) |
EE after one day (%) |
difference | |
|
| ||||||
| 98.2 98.3 98.1 98.2 |
98.8 99.0 99.3 (averages) 99.0 |
+0.6 +0.7 +1.2 +0.8 |
98.3 98.0 97.9 98.1 |
98.4 98.4 98.3 (averages) 98.4 |
+0.1 +0.4 +0.4 +0.3 | |
|
| ||||||
|
| ||||||
| extracts refrigerated | extracts at room temperature | |||||
| initial EE (%) |
EE after one day (%) |
difference | initial EE (%) |
EE after one day (%) |
difference | |
|
| ||||||
| 99.3 99.0 99.2 99.2 |
101.0 99.2 99.6 (averages) 99.9 |
+1.7 +0.2 +0.4 +0.7 |
99.0 99.0 98.5 98.8 |
99.4 98.7 99.3 (averages) 99.1 |
+0.4 -0.3 +0.8 +0.3 | |
|
| ||||||
The stability of extracted and derivatized samples was
investigated by reanalyzing the target concentration samples 24 h
after derivatization and initial analyses. After the original
analyses were performed, three vials were recapped with new septa
while the remaining three retained their punctured septa for each
target concentration set. The samples were reanalyzed with fresh
standards. The average percent change was -0.4% and -0.2% for
samples that were resealed with new septa, and -0.1% and 0.0% for
those that retained their punctured septa for samples at the
|
| ||||||
| punctured septa replaced | punctured septa retained | |||||
| initial EE (%) |
EE after one day (%) |
difference | initial EE (%) |
EE after one day (%) |
difference | |
|
| ||||||
| 98.2 98.3 98.1 98.2 |
98.2 97.7 97.6 (averages) 97.8 |
0.0 -0.6 -0.5 -0.4 |
98.3 98.0 97.9 98.1 |
98.0 98.0 98.1 (averages) 98.0 |
-0.3 0.0 +0.2 -0.1 | |
|
| ||||||
|
| ||||||
| punctured septa replaced | punctured septa retained | |||||
| initial EE (%) |
EE after one day (%) |
difference | initial EE (%) |
EE after one day (%) |
difference | |
|
| ||||||
| 99.3 99.0 99.2 99.2 |
98.7 99.1 99.1 (averages) 99.0 |
-0.6 +0.1 -0.1 -0.2 |
99.0 99.0 98.5 98.8 |
98.8 98.8 98.7 (averages) 98.8 |
-0.2 -0.2 +0.2 0.0 | |
|
| ||||||
A UV spectrum for benzalazine was obtained from a Hewlett-Packard 1050 Series programmable variable wavelength detector by injecting a standard using the same conditions given in Section 3.5.1.
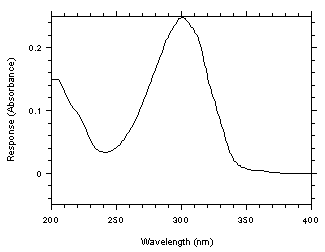
Figure
4.10. UV spectrum of benzalazine in 67/33,
acetonitrile/water.
5. References
- 5.1. OSHA Analytical Methods Manual; Vol.
1, Publ. #4542, U.S. Department of Labor, Occupational Safety and
Health Administration; OSHA Salt Lake Technical Center: Salt Lake
City, UT, 1990; Method 20: Hydrazine; American Conference of
Governmental Industrial Hygienists (ACGIH): Cincinnati, OH.
5.2. Suggs, H.J., L.J. Luskus and J.K. Herman,
Am. Ind. Hyg. Assoc. J., 1980, 41,
5.3. Documentation of the Threshold Limit Values and Biological Exposure Indices, 6th ed., on TLVs® and Other Occupational Exposure Values - 1995- CD-Rom, Publ. #9521W, American Conference of Governmental Industrial Hygienists (ACGIH): Cincinnati, OH, 1995.
5.4. OSHA Analytical Methods Manual; Vol.
3, Publ. #4542, U.S. Department of Labor, Occupational Safety and
Health Administration; OSHA Salt Lake Technical Center: Salt Lake
City, UT, 1990; Method 57:
5.5. ibid. Method 65: Benzidine,
5.6. ibid. Method 71: o-Dianisidine,
5.7. ibid. Method 73: o-, m-, and r-Toluidine.
5.8. ibid. Method 78: Diphenylamine, N-Isopropylaniline.
5.9. ibid., Vol. 4, Method 87: m-, o-, and
5.10. ibid. Method 93: 4-Aminobiphenyl,
1-Naphthylamine and
5.11. Elskamp, C.J. "OSHA Method 105:
m-Xylylenediamine and
5.12. Clayton, G.D. and F.E. Clayton, Eds. "Patty's Industrial Hygiene and Toxicology", 4th ed., Vol. 2, Part E; John Wiley & Sons, Inc.: New York, NY, 1994.
5.13. Lewis, R.J., Sr., Ed. "Sax's Dangerous Properties of Industrial Materials", 8th ed., Vol. 3; Van Nostrand Reinhold Co.: New York, NY, 1992.
