DIPROPYLENE GLYCOL METHYL ETHER
| Method number: | 101 |
| Matrix: | Air |
| Target concentration: OSHA PEL: ACGIH TLV: |
100 ppm (606 mg/m3) 100 ppm (606 mg/m3) 100 ppm (606 mg/m3) TWA, 150 ppm (909 mg/m3) STEL |
| Procedure: | Samples are collected by drawing air through standard size
|
| Recommended air volume and sampling rate: |
10 L at 0.1 L/min |
| Reliable quantitation limit: | 84 ppb (510 µg/m3) |
| Standard error of estimate at the target concentration: |
5.0% |
| Status of method: | Evaluated method. This method has been subjected to the established evaluation procedures of the Organic Methods Evaluation Branch. |
| Date: September 1993 | Chemist: Carl J. Elskamp |
Organic Methods Evaluation Branch
OSHA Salt
Lake Technical Center
Salt Lake City, UT 84165-0200
1. General Discussion
- 1.1 Background
- 1.1.1 History
Dipropylene glycol methyl ether (DPGME) is one of the most commonly used propylene glycol ethers in industry and is discussed in a recently published NEG/NIOSH document. (Ref. 5.1) DPGME is a collective term describing a mixture of structural isomers. In the past, OSHA has determined airborne concentrations based on a method validated by NIOSH (Ref. 5.2). The method specifies collection of the vapors on activated charcoal, desorption of the charcoal with carbon disulfide, and analysis by GC using flame ionization detection.
An examination of the Backup Data Report for the NIOSH method (Ref. 5.3) revealed that the desorption efficiency was not constant, the desorption efficiency of the individual isomers of DPGME was not investigated, and the desorption efficiency from wet charcoal was not addressed.
The reported desorption efficiency ranged from 60.4% at 2.954 mg to 89.1% at 12.01 mg of DPGME. In cases where the desorption efficiency is not constant, calculations to determine analyte concentrations are complicated through the use of a desorption efficiency curve. Also, a desorption efficiency less than 75% does not meet one of the evaluation requirements used by the Organic Methods Evaluation Branch of the OSHA Salt Lake Technical Center (SLTC).
For analytes such as DPGME, which are comprised as mixtures of related compounds, quantitation is accomplished by summing the peak areas of each component and treating the summed areas as one analyte. This is an accepted and convenient practice when using a flame ionization detector because the responses for all of the isomers of DPGME are identical. But if the desorption efficiencies are not the same for each isomer, they must be quantitated separately with individual desorption efficiency corrections, and then the resulting amounts are summed to determine the total amount of DPGME. This procedure is necessary for any method using charcoal collection and carbon disulfide desorption because the relative proportion of isomers in DPGME can vary by lot and manufacturer.
Because charcoal will always collect some water from sampled air,
the desorption of DPGME from wet charcoal is an important
consideration as evidenced by evaluations done at SLTC for other
chemically similar analytes. (Refs.
The present evaluation was accomplished using a desorption
solvent consisting of 95/5 (v/v) methylene chloride/methanol, which
is used for other chemically similar compounds evaluated at SLTC.
(Refs.
The use of 99/1 (v/v) carbon
1.1.2 Toxic effects (This section is for information only and should not be taken as the basis of OSHA policy.)
In the review presented in the previously mentioned NEG/NIOSH document, it was concluded that DPGME seems to lack reproductive toxicity, unlike some other chemically similar compounds. (Ref. 5.1)
At very high air concentrations, DPGME causes narcosis in
animals. It is expected that severe exposure would produce similar
effects in humans, but high concentrations are disagreeable and not
tolerated. Also, concentrations over 200 ppm (40% saturated
atmosphere) are difficult to attain, which suggests these high
concentrations would not likely be found in workplace air. DPGME at
300 ppm caused eye and nasal irritation to humans. There was no
evidence of skin irritation from prolonged or repeated contact with
the pure liquid. High vapor concentrations or direct contact of the
eyes with the liquid causes transient irritation. (Ref.
5.7) The OSHA
1.1.3 Workplace exposure
DPGME is used as a solvent for paints, lacquers, resins, dyes,
oil/greases, cleaners and cellulose and as a
1.1.4 Physical properties (Ref.
5.1 unless otherwise noted)
| CAS number: | 34590-94-8 (unspecified isomer) |
| molecular weight: | 148.2 |
| melting point: | -80°C |
| boiling point: | 189.6°C |
| flash point: | 85°C (185°F) |
| vapor pressure: | 0.05 kPa at 25°C |
| vapor density: | 5.14 (air=1) |
| saturation concentration: | 510 ppm at 25°C |
| liquid density: | 0.948 (25°C/4°C) |
| description: | clear, colorless liquid |
| odor: | sweet, ether-like |
| solubility: (Ref. 5.11) | completely miscible with water, VM&P naphtha, acetone, ethanol, benzene, carbon tetrachloride, ether, methanol, monochlorobenzene, and petroleum ether |
| synonyms: | dipropylene glycol monomethyl ether; DPGME |
| trade names: (Ref. 5.10) | Arcosolv DPM; Dowanol 50B; Dowanol DPM; Glycol Ether DPM; Propasol Solvent DM; Ucar Solvent 2LM |
| molecular formula: | C7H16O3 |
| structural formula: (Note: DPGME is a mixture of structural isomers. Also, each isomer has two asymmetrical carbon atoms, thus configurational isomers can exist. The numbers in parentheses are approximate percentages by weight of each isomer found in the DPGME used in this evaluation. The abbreviations in the brackets are used in chromatograms in this method.) | |
| 1-(2-methoxy-1-methylethoxy)-2-propanol: (69.3%)
[1-(2-M-1-ME)-2-P], CAS number: 20324-32-7 |
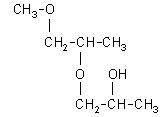 |
| 1-(2-methoxy-2-methylethoxy)-2-propanol: (27.8%)
[1-(2-M-2-ME)-2-P], CAS number: 13429-07-7 | 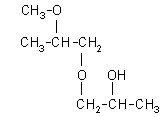 |
| 2-(2-methoxy-1-methylethoxy)-1-propanol: (1.4%)
[2-(2-M-1-ME)-1-P], CAS number: 55956-21-3 | 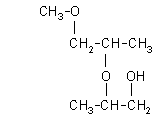 |
| 2-(2-methoxy-2-methylethoxy)-1-propanol: (1.1%)
[2-(2-M-2-ME)-1-P], CAS number: 13588-28-8 | 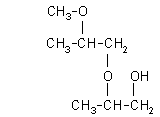
|
The analyte air concentrations throughout this method are based on the recommended sampling and analytical parameters. Air concentrations listed in ppm and ppb are referenced to 25°C and 101.3 kPa (760 mmHg).
- 1.2 Limit defining parameters
- 1.2.1 Detection limit of the analytical procedure
The detection limit of the analytical procedure is 0.13 ng. This is the amount of analyte that will give a response that is significantly different from the background response of a reagent blank. (Sections 4.1 and 4.2)
1.2.2 Detection limit of the overall procedure
The detection limit of the overall procedure is 1.5 µg per sample (25 ppb or 150 µg/m3). This is the amount of analyte spiked on the sampler that will give a response that is significantly different from the background response of a sampler blank. (Sections 4.1 and 4.3)
1.2.3 Reliable quantitation limit
The reliable quantitation limit is 5.1 µg per sample (84 ppb or 510 µg/m3). This is the amount of analyte spiked on a sampler that will give a signal that is considered the lower limit for precise quantitative measurements. (Section 4.4)
1.2.4 Precision (analytical procedure)
The precision of the analytical procedure, measured as the pooled relative standard deviation over a concentration range equivalent to 0.5 to 2 times the target concentration, is 0.14%. (Section 4.5)
1.2.5 Precision (overall procedure)
The precision of the overall procedure at the 95% confidence
level for the ambient temperature
1.2.6 Recovery
The recovery of DPGME from samples used in a 15-day storage test remained above 99% when the samples were stored at ambient temperatures. (Section 4.7)
1.2.7 Reproducibility
Six samples collected from controlled test atmospheres, with a draft copy of this procedure, were submitted to an SLTC service branch for analysis. The samples were analyzed after 27 days of storage. No individual sample result deviated from its theoretical value by more than the precision reported in Section 1.2.5. (Section 4.8)
2. Sampling Procedure
- 2.1 Apparatus
- 2.1.1 Samples are collected using a personal sampling pump
calibrated, with a sampling device attached, to within ±5% at the
recommended flow rate.
2.1.2 Samples are collected with 7-cm × 4-mm i.d. × 6-mm o.d.
glass sampling tubes packed with two sections of coconut shell
charcoal. The front section contains 100 mg and the back section
contains 50 mg of charcoal. The sections are held in place with
glass wool plugs and are separated by a urethane foam plug. For this
evaluation, commercially prepared sampling tubes were purchased from
SKC, Inc. (Fullerton, CA, Catalog No.
2.2 Reagents
None required
2.3 Technique
- 2.3.1 Immediately before sampling, break off the ends of the
charcoal tube. All tubes should be from the same lot.
2.3.2 Connect the sampling tube to the sampling pump with
flexible,
2.3.3 Air being sampled should not pass through any hose or tubing before entering the sampling tube.
2.3.4 To avoid channeling, place the sampling tube vertically in the employee's breathing zone. Position the sampler so it does not impede work performance or safety.
2.3.5 After sampling for the appropriate time, immediately remove
the sampling tube and seal it with plastic caps. Wrap each sample
lengthwise with a Form
2.3.6 Submit at least one blank sampling tube with each sample set. Blanks should be handled in the same manner as samples, except no air is drawn through them.
2.3.7 Record sample volumes (in liters of air) for each sample.
2.3.8 List any compounds that could be considered potential interferences, especially solvents, that are being used in the sampling area.
2.3.9 Ship any bulk sample(s) in a container separate from the air samples.
2.4 Sampler capacity
Sampler capacity is determined by measuring how much air can be
sampled before breakthrough of analyte through the sampler occurs,
i.e., the sampler capacity is exceeded. Breakthrough is considered to
occur when the effluent from the sampler contains a concentration of
analyte that is 5% of the upstream concentration (5% breakthrough).
Testing for breakthrough was performed by using a total hydrocarbon
analyzer to monitor the effluent from sampling tubes containing only
the 100-mg section of charcoal while sampling at 0.1 L/min from an
atmosphere containing 202 ppm of DPGME. The atmosphere was at
approximately 80% relative humidity and
2.5 Desorption efficiency
- 2.5.1 The average desorption efficiency for DPGME from Lot 120
charcoal over the range of 0.5 to 2 times the target concentration
is 99.4%. (Section 4.10.1)
2.5.2 The desorption efficiency at 0.05, 0.1, and 0.2 times the target concentration was found to be 97.0%, 98.0%, and 98.2% respectively. (Section 4.10.1)
2.5.3 Desorbed samples remain stable for at least 24 h. (Section 4.10.2)
2.6 Recommended air volume and sampling rate
- 2.6.1 For long-term samples collect 10 L of air at 0.1 L/min
2.6.2 For short-term samples collect 1.5 L at 0.1 L/min
2.6.3 When short-term samples are collected, the air concentration equivalent to the reliable quantitation limit becomes larger. For example, the reliable quantitation limit is 560 ppb (3390 µg/m3) when 1.5 L is collected.
2.7 Interferences (sampling)
- 2.7.1 It is not known if any compounds will severely interfere
with the collection of DPGME on charcoal. In general, the presence
of other contaminant vapors in the air will reduce the capacity of
charcoal to collect DPGME.
2.7.2 Suspected interferences should be reported to the laboratory with submitted samples.
2.8 Safety precautions (sampling)
- 2.8.1 Attach the sampling equipment to the employee so that it
will not interfere with work performance or safety.
2.8.2 Wear eye protection when breaking the ends of the charcoal tubes.
2.8.3 Follow all safety procedures that apply to the work area being sampled.
3. Analytical Procedure
- 3.1 Apparatus
- 3.1.1 A GC equipped with a flame ionization detector. For this
evaluation, a
3.1.2 A GC column capable of separating the analyte of interest
from the desorption solvent, internal standard and any
interferences. A
3.1.3 An electronic integrator or some other suitable means of measuring peak areas. A Waters 860 Networking Computer System was used in this evaluation.
3.1.4 Two-milliliter vials with Teflon®-lined caps.
3.1.5 A dispenser capable of delivering 1.0 mL of desorption
solvent to prepare standards and samples. If a dispenser is not
available, a
3.2 Reagents
- 3.2.1 Dipropylene glycol methyl ether, reagent grade. Aldrich
Chemical Lot 08413CY was used in this evaluation.
3.2.2 Methylene chloride, chromatographic grade. Burdick and Jackson Lot BB551 was used in this evaluation.
3.2.3 Methanol, chromatographic grade. Fisher Lot 913607 was used in this evaluation.
3.2.4 A suitable internal standard, reagent grade. Aldrich
Chemical Lot 11329LW
3.2.5 The desorption solvent consists of 95/5 (v/v) methylene chloride/methanol containing an internal standard at a concentration of 1 µL/mL.
3.2.6 GC grade nitrogen, air, and hydrogen.
3.3 Standard preparation
- 3.3.1 Prepare standards by injecting microliter amounts of DPGME
into vials containing 1.0 mL of desorption solvent delivered from
the same dispenser used to desorb samples. For example, inject 6.00
µL of DPGME into a vial containing 1.0 mL of desorption
solvent. This standard contains 5688 µg of DPGME per sample.
3.3.2 Bracket sample concentrations with working standard concentrations. If samples fall outside of the concentration range of prepared standards, prepare and analyze additional standards to ascertain the linearity of response.
3.4 Sample preparation
- 3.4.1 Transfer each section of charcoal of the samples to
separate vials. Discard the glass tubes, urethane foam plugs and
glass wool plugs.
3.4.2 Add 1.0 mL of desorption solvent to each vial using the same dispenser as used for preparation of standards.
3.4.3 Immediately cap the vials and shake them several times over the next 15 min.
3.5 Analysis
3.5.1 GC conditions
| zone temperatures: | column- injector- detector- |
110°C for 11 min, then 10°C/min to 150°C, hold
for 2 min 200°C 240°C | |
| gas flows: | hydrogen (carrier)- nitrogen (makeup)- hydrogen (flame)- air- |
3.0 mL/min (60 kPa head pressure) 37 mL/min 33 mL/min 390 mL/min | |
| signal range: | 0 | ||
| injection volume: | 1.0 µL (with a 15:1 split) | ||
| column: | 30-m × 0.32-mm i.d. fused silica,
| ||
| retention times: | 3-octanol |
6.1 min (internal standard) 9.3 min (33.9% by wt), 9.7 min (35.4%), 11.7 min (27.8%), 12.6 min (1.4%), 13.3 min (0.6%), 13.5 min (0.6%) | |
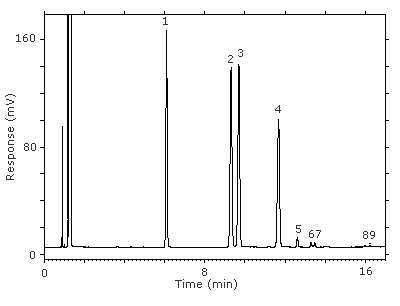
Figure 3.5.1. Chromatogram at the target concentration.
Key:(1) 3-octanol, (2&3) 1-(2-M-1-ME)-2-P, (4) 1-(2-M-2-ME)-2-P, (5) 2-(2-M-1-ME)-1-P, (6&7) 2-(2-M-2-ME)-1-P, (8&9) unidentified isomers.
3.5.2 Peak areas are measured by an integrator or other suitable means. The areas of the isomers of DPGME are summed together and treated as one analyte.
3.5.3 An internal standard (ISTD) calibration method is used. A
calibration curve is prepared by plotting micrograms of DPGME per
sample versus
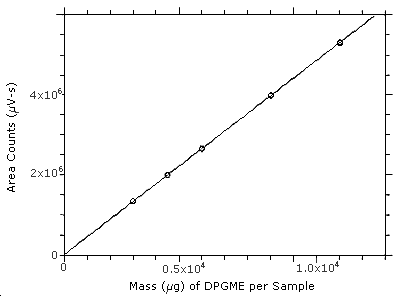
Figure 3.5.3. Calibration curve constructed from the data in Table 4.5. The equation of the line isY = 440X + 15400.
3.6 Interferences (analytical)
- 3.6.1 Any compound that produces a response on a flame
ionization detector and has the same general retention time of any
of the DPGME isomers or the internal standard is a potential
interference. Possible interferences should be reported to the
laboratory with submitted samples by the industrial hygienist. These
interferences should be considered before samples are desorbed.
3.6.2 GC parameters (i.e. column and column temperature) may be changed to possibly circumvent interferences.
3.6.3 When necessary, the identity or purity of an analyte peak may be confirmed with additional analytical data. (Section 4.11)
3.7 Calculations
The DPGME concentration for samples is obtained from the
appropriate calibration curve in terms of micrograms of analyte per
sample, uncorrected for desorption efficiency. The air concentration
is calculated using the following formulae. The back
mg/m3 = (micrograms of DPGME per sample)/((liters of air sampled)(desorption efficiency))
where the desorption efficiency = 0.994
ppm = (mg/m3)(24.46)/(molecular weight of analyte) = (mg/m3)(0.1650)
where 24.46 is the molar volume at 25°C and 101.3 kPa (760
mmHg)
and the molecular weight of DPGME = 148.2
3.8 Safety precautions (analytical)
- 3.8.1 Adhere to the rules set down in your Chemical Hygiene
Plan.
3.8.2 Avoid skin contact and inhalation of all chemicals.
3.8.3 Wear safety glasses and a lab coat at all times while in the lab area.
4. Backup Data
- 4.1 Determination of detection limits
Detection limits (DL), in general, are defined as the amount (or concentration) of analyte that gives a response (YDL) that is significantly different (three standard deviations (SDBR)) from the background response (YBR).
YDL - YBR = 3(SDBR)
The direct measurement of YBR and SDBR in chromatographic methods is typically inconvenient and difficult because YBR is usually extremely low. Estimates of these parameters can be made with data obtained from the analysis of a series of analytical standards or samples whose responses are in the vicinity of the background response. The regression curve obtained for a plot of instrument response versus concentration of analyte will usually be linear. Assuming SDBR and the precision of data about the curve are similar, the standard error of estimate (SEE) for the regression curve can be substituted for SDBR in the above equation. The following calculations derive a formula for DL:

| Yobs = | observed response |
| Yest = | estimated response from regression curve |
| n = | total no. of data points |
| k = | 2 for linear regression curve |
At point YDL on the regression
curve
| YDL = A(DL) + YBR | A = analytical sensitivity (slope) |
therefore
| DL = | (YDL - YBR)
A |
Substituting 3(SEE) + YBR for YDL gives
| DL = | 3(SEE)
A |
4.2 Detection limit of the analytical procedure (DLAP)
The DLAP is measured as the mass of analyte actually introduced
into the chromatographic column. Ten analytical standards were
prepared in equal descending increments with the highest standard
containing 12.0 µg/mL. This is the concentration that would
produce a peak approximately 10 times the baseline noise of a reagent
blank. These standards, plus a solvent blank, were analyzed with the
recommended analytical parameters
|
| ||
| concentration (µg/mL) |
mass on column (ng) |
area counts (µV-s) |
|
| ||
| 0.00 1.20 2.40 3.60 4.80 6.00 7.20 8.40 9.61 10.8 12.0 |
0.00 0.12 0.24 0.36 0.48 0.60 0.72 0.84 0.96 1.08 1.20 |
0 162 302 553 857 1227 1443 1617 2049 2267 2711 |
|
| ||
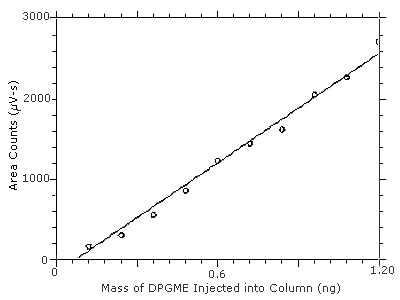
Figure 4.2. Plot of the data from Table 4.2 to determine the DLAP of 0.13 ng. The equation of the line is
Y = 2267X - 162.
4.3 Detection limit of the overall procedure (DLOP)
The DLOP is measured as mass per sample and expressed as equivalent air concentrations, based on the recommended sampling parameters. Ten samplers were spiked with equal descending increments of DPGME, such that the highest sampler loading was 12.0 µg/sample. This is the amount, when spiked on a sampler, that would produce a peak approximately 10 times the baseline noise for a sample blank. These spiked samplers, plus a sample blank, were analyzed with the recommended analytical parameters, and the data obtained used to calculate the required parameters (A and SEE) for the calculation of the DLOP. Values of 203.9 and 104.3 were obtained for A and SEE respectively. The DLOP was calculated to be 1.5 µg/sample (25 ppb, 150 µg/m3).
|
| |
| mass (µg) per sample |
area counts (µV-s) |
|
| |
| 0.00 1.20 2.40 3.60 4.80 6.00 7.20 8.40 9.61 10.8 12.0 |
0 214 352 494 768 995 1248 1660 1785 2236 2349 |
|
| |
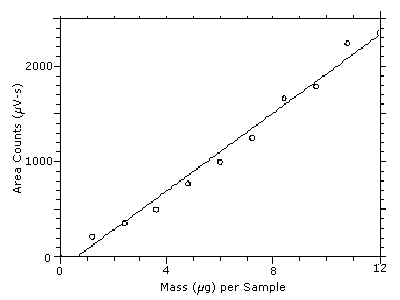
Figure 4.3. Plot of the data from Table 4.3 to determine the DLOP of 1.5 µg/sample (25 ppb, 150 µg/m3). The equation of the line is
Y = 203.9X - 124.
4.4 Reliable quantitation limit (RQL)
The RQL is considered the lower limit for precise quantitative measurements. It is determined from the regression line data obtained for the calculation of the DLOP (Section 4.3). The RQL is defined as the amount of analyte that gives a response (YRQL) such that
YRQL - YBR = 10(SDBR)
therefore
| RQL = | 10(SEE)
A |
The RQL was calculated to be 5.1 µg/sample (84 ppb, 510 µg/m3). Recovery at this concentration is 92.1%.
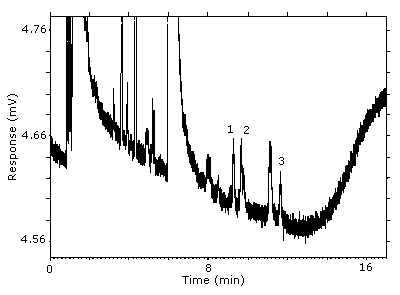
Figure 4.4. Chromatogram of the RQL.
Key: (1&2) 1-(2-M-1-ME)-2-P, (3) 1-(2-M-2-ME)-2-P.
4.5 Precision (analytical method)
The precision of the analytical procedure is defined as the pooled relative standard deviation (RSDP). Relative standard deviations were determined from six replicate injections of DPGME standards at 0.5, 0.75, 1, 1.5, and 2 times the target concentration. After assuring that the RSDs satisfy the Cochran test for homogeneity at the 95% confidence level, the RSDP was calculated to be 0.14%.
|
| |||||
| × target concn (µg/sample) |
0.5× 3002 |
0.75× 4502 |
1.0× 6003 |
1.5× 9005 |
2.0× 12006 |
|
| |||||
| area
counts (µV-s) |
1336700 1339300 1337200 1336500 1338000 1340000 |
1995500 1996700 1998900 1998200 2001300 1999600 |
2659300 2653900 2647700 2644500 2654800 2649300 |
3994400 3993700 3993200 3991600 3987700 3986500 |
5285100 5298000 5293400 5309400 5300800 5296700 |
SD RSD (%) |
1337950 1432.1 0.107 |
1998370 2070.4 0.104 |
2651580 5398.7 0.204 |
3991180 3316.3 0.083 |
5297230 8044.1 0.152 |
|
| |||||
The Cochran test for homogeneity:
 = 0.4433
Because the g statistic does not exceed the critical value of 0.5065, the RSDs can be considered equal and they can be pooled (RSDP) to give an estimated RSD for the concentration range studied.
 = 0.14%
4.6 Precision (overall procedure)
The precision of the overall procedure is determined from the storage data in Section 4.7. The determination of the standard error of estimate (SEER) for a regression line plotted through the graphed storage data allows the inclusion of storage time as one of the factors affecting overall precision. The SEER is similar to the standard deviation, except it is a measure of dispersion of data about a regression line instead of about a mean. It is determined with the following equation:

| n = k = k = |
total no. of data points 2 for linear regression 3 for quadratic regression |
| Yobs = | observed % recovery at a given time |
| Yest = | estimated % recovery from the regression line at the same given time |
An additional 5% for pump error (SP) is added to the SEER by the addition of variances to obtain the total standard error of estimate.

The precision at the 95% confidence level is obtained by
multiplying the standard error of estimate (with pump error included)
by 1.96 (the
4.7 Storage test
Storage samples were generated by sampling from test atmospheres
containing DPGME at the target concentration. Six samples were
analyzed immediately after generation, fifteen were stored in a
refrigerator at 0°C, and fifteen were stored in a closed drawer at
ambient temperatures of
|
| ||||||||
| time (days) |
refrigerated storage recovery (%) |
ambient storage recovery (%) | ||||||
|
| ||||||||
| 0 0 4 6 8 11 15 |
100.4 100.2 98.6 98.9 99.0 100.2 100.3 |
100.3 100.3 99.6 99.9 99.2 100.0 100.3 |
100.2 100.0 100.0 100.1 99.7 100.4 100.6 |
100.4 100.2 99.3 99.0 99.0 98.0 98.1 |
100.3 100.3 99.9 100.0 100.0 99.4 99.5 |
100.2 100.0 99.5 100.3 99.7 99.4 99.5 | ||
|
| ||||||||
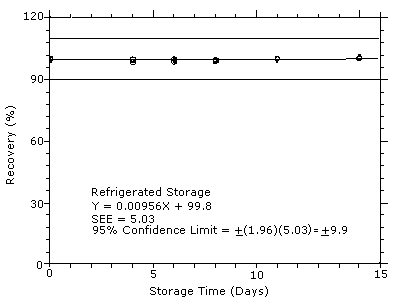
Figure 4.7.1
Refrigerated storage test for DPGME.
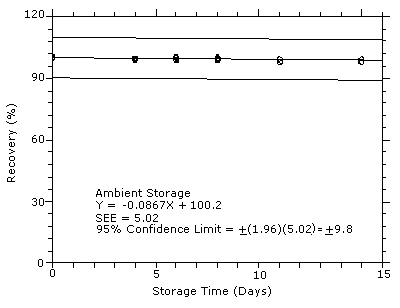
Figure 4.7.2. Ambient
storage test for DPGME.
4.8 Reproducibility
Six samples were prepared by collecting them from a controlled test
atmosphere similar to that which was used in the collection of the
storage samples. The samples were submitted to an SLTC service branch
for analysis. Samples
|
| ||||
| sample | ppm reported | ppm expected | percent | deviation |
|
| ||||
| 1 2 3 4 5 6 |
93.2 83.2 85.8 85.8 90.7 91.8 |
92.4 86.1 87.0 87.0 94.2 92.0 |
100.9
96.6 98.6 98.6 96.3 99.8 |
+0.9 -3.4 -1.4 -1.4 -3.7 -0.2 |
|
| ||||
4.9 Sampler capacity
Sampler capacity was determined by using a total hydrocarbon
analyzer to monitor the effluent from sampling tubes containing only
the
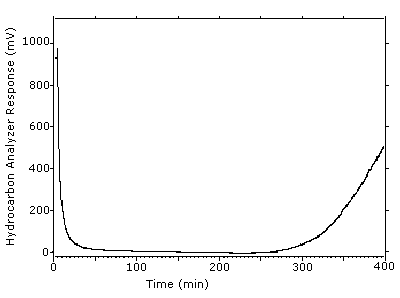
Figure 4.9. Example of one determination of the 5% breakthrough volume. The tube was put in line at 4.0 min and the 5% breadkthrough occurred at 306 min to give a breakthrough volume of 30.2 L.
4.10 Desorption efficiency and stability of desorbed samples
- 4.10.1 Desorption efficiency
The desorption efficiencies (DE) for DPGME were determined by
liquid-spiking the
|
| ||||||
| × target concn mass spiked (µg) |
0.05× 300.2 |
0.1× 600.3 |
0.2× 1201 |
0.5× 3002 |
1.0× 6003 |
2.0× 12010 |
|
| ||||||
| DE (%) |
97.0 97.3 97.3 96.8 97.6 96.0 |
97.7 98.7 98.1 98.0 97.7 97.7 |
97.9 98.4 97.3 98.6 97.8 99.2 |
98.8 98.6 99.1 98.7 99.1 98.8 |
99.6 99.6 99.6 99.4 99.5 99.5 |
99.8 99.8 99.8 99.9 99.8 99.8 |
| 97.0 | 98.0 | 98.2 | 98.8 | 99.5 | 99.8 | |
|
| ||||||
4.10.2 Stability of desorbed samples
The stability of desorbed samples was investigated by reanalyzing
the target concentration samples 24 h after initial analysis. After
the original analysis was performed three vials were recapped with
new septa while the remaining three retained their punctured septa.
The samples were reanalyzed with fresh standards. The average
percent change was +0.3% for samples that were resealed with new
septa, and +0.2% for those that retained their punctured
septa.
|
| ||||||
| punctured septa replaced | punctured septa retained | |||||
| initial DE (%) |
DE after one day (%) |
difference | initial DE (%) |
DE after one day (%) |
difference | |
|
| ||||||
| 99.6 99.6 99.6 99.6 |
100.0 100.0 99.8 (averages) 99.9 |
+0.4 +0.4 +0.2 +0.3 |
99.4 99.5 99.5 99.5 |
99.8 99.6 99.7 (averages) 99.7 |
+0.4 +0.1 +0.2 +0.2 | |
|
| ||||||
4.11 Qualitative analysis
The isomers of DPGME can easily be separated and identified by
GC/MS. Mass spectra for six of the isomers, which were separated using
similar conditions given in Section 3.5, were obtained from a
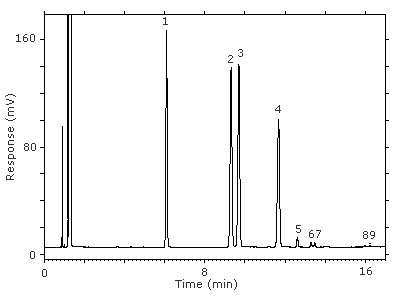
Figure 4.11.1. Chromatogram at the target concentration.
Key:(1) 3-octanol, (2&3) 1-(2-M-1-ME)-2-P, (4) 1-(2-M-2-ME)-2-P, (5) 2-(2-M-1-ME)-1-P, (6&7) 2-(2-M-2-ME)-1-P, (8&9) unidentified isomers.
&nsbsp;
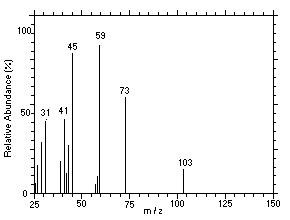 Figure 4.11.2. Mass spectrum of Peak 2 identified as |
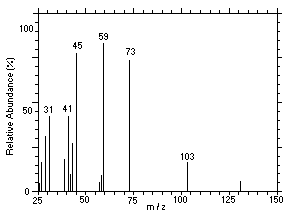 Figure 4.11.3. Mass spectrum of Peak 3 identified as |
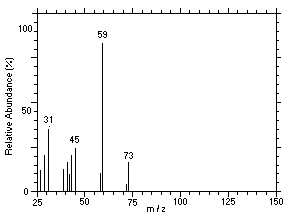 Figure 4.11.4. Mass spectrum of Peak 4 identified as |
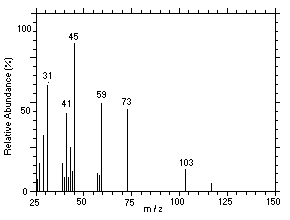 Figure 4.11.5. Mass spectrum of Peak 5 identified as |
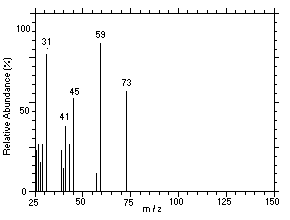 Figure 4.11.6. Mass spectrum of Peak 6 identified as |
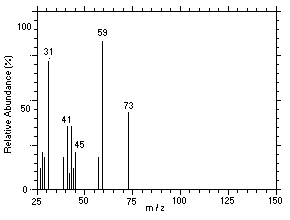 Figure 4.11.7. Mass spectrum of Peak 7 identified as |
5. References
- 5.1. "NEG and NIOSH basis for an occupational
health standard: Propylene Glycol Ethers and Their Acetates";
1991, U.S. Department of Health and Human Services, Public Health
Service, Center for Disease Control, NIOSH, Publication No.
5.2. "NIOSH Manual of Analytical Methods",
2nd ed. Vol. 2; U.S. Department of Health and Human Services, Public
Health Service, Centers for Disease Control, National Institute for
Occupational Safety and Health; Cincinnati, OH, 1977, Method S69, DHEW
(NIOSH) Publication No.
5.3. "Documentation of the NIOSH Validation
Tests"; U.S. Department of Health and Human Services, Public
Health Service, Centers for Disease Control, National Institute for
Occupational Safety and Health, Division of Physical Sciences and
Engineering; Cincinnati, OH, 1977, Backup Data Report No. S69, DHEW
(NIOSH) Publication No.
5.4. "OSHA Analytical Methods Manual" U.S.
Department of Labor, Occupational Safety and Health Administration;
OSHA Salt Lake Technical Center: Salt Lake City, UT, 1990; Method 79;
American Conference of Governmental Industrial Hygienists (ACGIH):
Cincinnati, OH, ISBN:
5.5. Elskamp, C.J. "OSHA Method No. 99;
5.6. Elskamp, C.J. "OSHA Method No. 83;
2-Butoxyethanol and
5.7. Hathaway, G.J., et al., Ed., "Proctor and Hughes' Chemical Hazards of the Workplace", 3rd ed., Van Nostrand Reinhold, New York, 1991.
5.8. Department of Labor Fed. Regist. 1993, 58 (No. 124, Wed. June 30), 35344.
5.9. "American Conference of Governmental Industrial Hygienists: Documentation of the Threshold Limit Values"; 5th ed., p. 221, Cincinnati, OH (1986).
5.10. Cheminfo Database on CCINFO
5.11 "Hawley's Condensed Chemical Dictionary"; 12th ed.; Van Nostrand Reinhold Company, New York, NY, 1993.