- 1-METHOXY-2-PROPANOL (1M2P)
2-METHOXY-1-PROPANOL (2M1P)
1-METHOXY-2-PROPYL ACETATE (1M2PA)
2-METHOXY-1-PROPYL ACETATE (2M1PA)
| Method number: | 99 | |||
| Matrix: | Air | |||
| Procedure: | Samples are collected by drawing air through standard
size |
|||
| Recommended air volume and sampling rate: |
10 L at 0.1 L/min | |||
|
| ||||
| 1M2P | 2M1P | 1M2PA | 2M1PA | |
|
| ||||
| Target concentration: | 100 ppm (368 mg/m3) |
1 ppm (3.7 mg/m3) |
100 ppm (540 mg/m3) |
1 ppm (5.4 mg/m3) |
| Reliable quantitation limit: | 20 ppb (74 µg/m3) |
20 ppb (74 µg/m3) |
20 ppb (108 µg/m3) |
20 ppb (108 µg/m3) |
| Standard error of estimate at the target concentration: |
5.3% | 5.5% | 5.1% | 5.4% |
|
| ||||
| Special requirements: | Samples for 1M2PA and 2M1PA should be refrigerated upon receipt by the laboratory to minimize hydrolysis. | |||
| Status of method: | Evaluated method. This method has been subjected to the established evaluation procedures of the Organic Methods Evaluation Branch. | |||
| Date: April 1993 | Chemist: Carl J. Elskamp | |||
OSHA Salt Lake Technical Center
Salt Lake City, UT 84165-0200
1. General Discussion
- 1.1. Background
- 1.1.1. History
Over the past several years there has been an increase in the
number of samples submitted to the OSHA Salt Lake Technical Center
for propylene glycol ethers and their acetates. This is likely due
to the increased usage of these solvents as substitutes for ethylene
glycol ethers and their acetates, which have been associated with
the potential to cause adverse reproductive effects in both male and
female workers. (Ref.
5.1.) Now there is evidence that 2M1P and 2M1PA may exhibit
analogous toxicities. (Ref.
5.2.) 2M1P and 2M1PA are present as impurities in technical
grade 1M2P and 1M2PA respectively. OSHA has adopted a
There were no reported air monitoring procedures in the
literature for these propylene glycol ethers/acetates. A method has
now been evaluated based on previous evaluations done at the OSHA
Salt Lake Technical Center for a number of ethylene glycol
ether/acetates, which are chemically similar to these compounds.
As was found for the acetates of ethylene glycol ethers
As was the case for some of the other previously evaluated
ethylene glycol ethers (Ref.
5.4.), the use of a drying agent such as magnesium sulfate is
needed to improve the desorption efficiency of 1M2P and 2M1P from
charcoal. Because MgSO4 can only be
purchased as a powder, periodically the syringe used for sample
injections into the GC may be plugged by
MgSO4 suspended in solution. This can be
avoided by centrifuging the samples or by allowing the powder to
settle out before analysis. Two granular drying agents,
Many solvent vapors collected on charcoal and analyzed at the
OSHA Salt Lake Technical Center are desorbed with 99/1 (v/v) carbon
It is felt that there will always be some amount of corresponding alcohol present in samples containing acetates because the acetates may be partially hydrolyzed in the air before collection or on the charcoal after collection. For example, 1M2P would be found in samples containing 1M2PA, and 2M1P would be found in 2M1PA samples. Also, the alcohols could be present as contaminants in the corresponding technical grade acetates. For these reasons, it would be wise to analyze for the alcohols in acetate samples. Thus, unless it is absolutely necessary to desorb with CS2/DMF for analysis of other co-collected solvents, samples for 1M2PA and 2M1PA should also be desorbed with methylene chloride/methanol in the presence of MgSO4 or Drierite® to facilitate the analysis of the corresponding alcohols.
1.1.2. Toxic effects (This section is for information only and should not be taken as the basis of OSHA policy.)
These propylene glycol ethers/acetates have low acute toxicity,
with the main effect at high doses being central nervous system
depression. There are no reported studies on the carcinogenicity of
these compounds. 1M2P and 1M2PA appear to lack reproductive
toxicity, with the critical effect being irritation of the eyes and
mucous membranes. 2M1PA is embryotoxic and teratogenic in laboratory
animals. It is very likely that 2M1P is also teratogenic because the
common metabolite of 2M1P and 2M1PA is
1.1.3. Workplace exposure
Propylene glycol ethers/acetates are used industrially as
solvents for paints, lacquers, resins, oils and fats. Their use has
increased considerably since 1985. This is probably because they are
used as substitutes for the chemically similar ethylene glycol
ethers, which have been associated with reproductive toxicity. From
NIOSH occupational surveys done from
1.1.4. Physical properties (Ref. 5.2. unless otherwise noted)
|
| |||||
| Property | 1M2P | 2M1P | 1M2PA | 2M1PA | |
|
| |||||
| CAS number: molecular weight: melting point (°C): boiling point (°C): flash point (°C): vapor pressure (kPa): vapor density (25°C, air=1): liquid density (25°C/4°C): description: miscibility with water: |
107-98-2 90.12 119.6 38 1.6 @ 25°C 3.11 0.917 colorless liquid complete |
1589-47-5 90.12 130 (Ref. 5.6.) 0.938 (Ref. 5.6.) colorless liquid complete |
108-65-6 132.16 <-67 145.8 42.2 0.5 @ 20°C 4.55 0.97 colorless liquid |
70657-70-4 132.16 colorless liquid | |
|
| |||||
Note: Commercial grade 1M2P contains mainly (95-99%) 1M2P,
with the remainder ![]() 95%) 1M2PA, with
remainder largely being 2M1PA. (Ref.
5.2.)
95%) 1M2PA, with
remainder largely being 2M1PA. (Ref.
5.2.)
structural formulae:
1-methoxy-2-propanol (1M2P): ![]()
2-methoxy-1-propanol (2M1P): ![]()
1-methoxy-2-propyl acetate (1M2PA): 
2-methoxy-1-propyl acetate (2M1PA): 
synonyms:
1-methoxy-2-propanol- 1M2P; methoxypropanol, alpha isomer; propylene glycol monomethyl ether; propylene glycol methyl ether; PGME
2-methoxy-1-propanol- 2M1P; methoxypropanol, beta isomer; propylene glycol monomethyl ether; propylene glycol methyl ether; bPGME
1-methoxy-2-propyl acetate- 1M2PA; methoxypropyl acetate, alpha isomer; propylene glycol monomethyl ether acetate; propylene glycol methyl ether acetate; PGMEA
2-methoxy-1-propyl acetate- 2M1PA; methoxypropyl acetate, beta isomer; propylene glycol monomethyl ether acetate; propylene glycol methyl ether acetate; bPGMEA
The analyte air concentrations throughout this method are based on the recommended sampling and analytical parameters. Air concentrations listed in ppm and ppb are referenced to 25°C and 101.3 Kpa (760 mmHg.)
1.2. Limit defining parameters
- 1.2.1. Detection limit of the analytical procedure
The detection limits of the analytical procedure are 48, 50, 71,
and 71 pg per injection
1.2.2. Detection limit of the overall procedure
The detection limits of the overall procedure are 0.73, 0.75, 1.1, and 1.1 µg per sample for 1M2P, 2M1P, 1M2PA, and 2M1PA respectively. These are the amounts of each analyte spiked on the sampling device that, upon analysis, produce a peak similar in size to that of the respective detection limit of the analytical procedure. These detection limits correspond to air concentrations of 20 ppb (74 µg/m³), 20 ppb (74 µg/m³), 20 ppb (108 µg/m³), and 20 ppb (108 µg/m³) for 1M2P, 2M1P, 1M2PA, and 2M1PA respectively. (Section 4.2.)
1.2.3. Reliable quantitation limit
The reliable quantitation limits are 0.73, 0.75, 1.1, and 1.1 µg per sample for 1M2P, 2M1P, 1M2PA, and 2M1PA respectively. These are the smallest amounts of each analyte that can be quantitated within the requirements of recoveries of at least 75% and precisions (±1.96 SD) of ±25% or better. These reliable quantitation limits correspond to air concentrations of 20 ppb (74 µg/m³), 20 ppb (74 µg/m³), 20 ppb (108 µg/m³), and 20 ppb (108 µg/m³) for 1M2P, 2M1P, 1M2PA, and 2M1PA respectively. (Section 4.3.)
The reliable quantitation limits and detection limits reported in the method are based upon optimization of the GC for the smallest possible amounts of each analyte. When the target concentration of an analyte is exceptionally higher than these limits, they may not be attainable at the routine operating parameters.
1.2.4. Instrument response to the analyte
The instrument response over the concentration ranges of 0.5 to 2 times the target concentrations is linear for all four analytes. (Section 4.4.)
1.2.5. Recovery
The recovery of 1M2P, 2M1P, 1M2PA, and 2M1PA from samples used in
a
1.2.6. Precision (analytical procedure)
The pooled coefficients of variation obtained from replicate determinations of analytical standards at 0.5, 1, and 2 times the target concentrations are 0.0025, 0.0045, 0.0025, and 0.0041 for 1M2P, 2M1P, 1M2PA, and 2M1PA respectively. (Section 4.6.)
1.2.7. Precision (overall procedure)
The precisions at the 95% confidence level for the ambient
temperature
1.2.8. Reproducibility
Six samples for each analyte collected from controlled test atmospheres and a draft copy of this procedure were given to a chemist unassociated with this evaluation. The samples were analyzed after nine days of refrigerated storage. No individual sample result deviated from its theoretical value by more than the precision reported in Section 1.2.7. (Section 4.8.)
2. Sampling Procedure
- 2.1. Apparatus
- 2.1.1. Samples are collected using a personal sampling pump
calibrated to within ±5% of the recommended flow rate with a
sampling tube in line.
2.1.2. Samples are collected with solid sorbent sampling tubes
containing coconut shell charcoal. Each tube consists of two
sections of charcoal separated by a urethane foam plug. The front
section contains 100 mg of charcoal and the back section, 50 mg. The
sections are held in place with glass wool plugs in a glass tube
2.2. Reagents
None required
2.3. Technique
- 2.3.1. Immediately before sampling, break off the ends of the
charcoal tube. All tubes should be from the same lot.
2.3.2. Connect the sampling tube to the sampling pump with
flexible,
2.3.3. Air being sampled should not pass through any hose or tubing before entering the sampling tube.
2.3.4. To avoid channeling, place the sampling tube vertically in the employee's breathing zone.
2.3.5. After sampling, seal the tubes immediately with plastic caps and wrap lengthwise with OSHA Form 21.
2.3.6. Submit at least one blank sampling tube with each sample set. Blanks should be handled in the same manner as samples, except no air is drawn through them.
2.3.7. Record sample volumes (in liters of air) for each sample.
2.3.8. List any compounds that could be considered potential interferences, especially solvents, that are being used in the sampling area.
2.3.9. Ship any bulk sample(s) in a container separate from the air samples.
2.4. Sampler capacity
- 2.4.1. Sampler capacity is determined by measuring how much air
can be sampled before breakthrough of analyte through the sampler
occurs, i.e., the sampler capacity is exceeded. Breakthrough is
considered to occur when the effluent from the sampler contains a
concentration of analyte that is 5% of the upstream concentration
(5% breakthrough). Testing for 1M2P breakthrough was performed by
monitoring the effluent (with a total hydrocarbon analyzer) from
sampling tubes containing only the
2.4.2. Similar studies as in 2.4.1. were done for 1M2P at 2.0 ppm and 1M2PA at 2.2 ppm. Both atmospheres were sampled for more than 6 h (>72 L) with no breakthrough detected. 1M2P and 1M2PA were used in these studies instead of 2M1P and 2M1PA because sufficient quantities of the latter analytes were not available. It is felt that the breakthrough volume for 2M1P would approximate that of 1M2P and the breakthrough volume of 2M1PA would approximate that of 1M2PA.
2.5. Desorption efficiency
- 2.5.1. Desorption with 95/5 (v/v) methylene chloride/methanol
- 2.5.1.1. The average desorption efficiencies of 1M2P, 2M1P,
1M2PA, and 2M1PA from dry Lot 120 charcoal are 100.4%, 99.7%,
101.8%, and 101.4% respectively over the range of 0.5 to 2 times
the target concentrations. (Section
4.9.)
2.5.1.2. Desorbed samples from Section 2.5.1. remain stable for at least 24 h. (Section 4.10.)
2.5.1.3. The desorption efficiencies at the target concentrations from wet charcoal are essentially the same as from dry charcoal when MgSO4 is used. The desorbed samples are stable for at least 24 h. (Section 4.11.) The use of MgSO4 is recommended for 1M2P and 2M1P samples, but is optional for 1M2PA and 2M1PA samples.
2.5.2. Desorption with 99/1 (v/v) carbon disulfide/N,N-dimethylformamide (CS2/DMF)
- 2.5.2.1. The average desorption
efficiencies of 1M2P, 2M1P, 1M2PA, and 2M1PA from dry Lot 120
charcoal are 86.3%, 80.8%, 98.4%, and 98.0% respectively over the
range of 0.5 to 2 times the target concentrations. (Section
4.12.)
2.5.2.2. All of the analytes with the exception of 2M1P were sufficiently stable for the target concentration samples from Section 2.5.2.1. The average desorption efficiency for 2M1P dropped from 82.2% to 75.8% in 24 h. (Section 4.13.)
2.5.2.3. The average desorption efficiencies at the target concentrations from wet charcoal are 79.5% for 1M2P and 70.5% for 2M1P when MgSO4 is used. These compare to 87.4% and 82.2% respectively from dry charcoal. The desorbed 1M2P samples are stable for at least 24 h, while the average desorption efficiency dropped to 64.3% for the 2M1P samples. The optional use of CS2/DMF (with MgSO4) would be acceptable for 1M2P samples but not for 2M1P samples at or around the studied loadings. (Section 4.14.)
The average desorption efficiencies at the target concentrations for 1M2PA and 2M1PA from wet charcoal using 99/1 CS2/DMF as the desorbing solvent (with MgSO4) are essentially the same as from dry charcoal. The desorbed samples are stable for at least 24 h. (Section 4.14.)
2.6. Recommended air volume and sampling rate
2.6.1. For TWA samples, the recommended air volume is 10 L
collected at 0.1 L/min
2.6.2. For short-term samples, the recommended air volume is 3 L
collected at 0.20 L/min
2.6.3. When short-term samples are required, the reliable quantitation limits become larger. For example, the quantitation limits are 67 ppb when 3 L is sampled.
2.7. Interferences (sampling)
- 2.7.1. It is not known if any compound(s) will severely
interfere with the collection of any of the four analytes on
charcoal. In general, the presence of other contaminant vapors in
the air will reduce the capacity of charcoal to collect the
analytes.
2.7.2. Suspected interferences should be reported to the laboratory with submitted samples.
2.8. Safety precautions (sampling)
- 2.8.1. Attach the sampling equipment to the employee so that it
will not interfere with work performance or safety.
2.8.2. Wear eye protection when breaking the ends of the charcoal tubes.
2.8.3. Follow all safety procedures that apply to the work area being sampled.
3. Analytical Procedure
- 3.1. Apparatus
- 3.1.1. A GC equipped with a flame ionization detector. For this
evaluation, a
3.1.2. A GC column capable of separating the analyte of interest
from the desorbing solvent, internal standard and any interferences.
A
3.1.3. An electronic integrator or some other suitable means of measuring peak areas or heights. A Waters 860 Networking Computer System was used in this evaluation.
3.1.4. Two-milliliter vials with Teflon®-lined caps.
3.1.5. A dispenser capable of delivering 1.0 mL of desorbing
solvent to prepare standards and samples. If a dispenser is not
available, a
3.2. Reagents
- 3.2.1. 1-Methoxy-2-propanol, 2-methoxy-1-propanol,
1-methoxy-2-propyl acetate, and
3.2.2. Anhydrous magnesium sulfate or 20-40 mesh Drierite® (anhydrous calcium sulfate), reagent grade. Chempure Lot M172 KDHM magnesium sulfate was used in this evaluation.
3.2.3. Methylene chloride, chromatographic grade. Burdick and Jackson Lot BB551 was used in this evaluation.
3.2.4. Methanol, chromatographic grade. Fisher Lot 913607 was used in this evaluation.
3.2.5. A suitable internal standard, reagent grade. "Quant Grade" 2-heptanol from Polyscience Corporation (Niles, IL) was used in this evaluation.
3.2.6. The desorbing solvent consists of 95/5 (v/v) methylene chloride/methanol containing an internal standard at a concentration of 1 µL/mL.
3.2.7. GC grade nitrogen, air, and hydrogen.
3.3. Standard preparation
- 3.3.1. Prepare standards by injecting microliter amounts of
analytes into vials containing 1.0 mL of desorbing solvent delivered
from the same dispenser used to desorb samples. For example, to
prepare a standard of 1M2P and 2M1P, inject 4.00 µL of a
98.97/1.03 (w/w) 1M2P/2M1P mixture (density = 0.917) into a vial
containing 1.0 mL of desorbing solvent. This standard contains 3630
µg of 1M2P and 37.78 µg of 2M1P per sample.
3.3.2. Bracket sample concentrations with working standard concentrations. If samples fall outside of the concentration range of prepared standards, prepare and analyze additional standards to ascertain the linearity of response.
3.4. Sample preparation
- 3.4.1. Transfer each section of the samples to separate vials.
Discard the glass tubes and plugs.
3.4.2. For 1M2P and 2M1P samples and for 1M2PA and 2M1PA samples
to be analyzed for 1M2P and 2M1P respectively, add about 125 mg of
anhydrous magnesium sulfate or 400 mg of
3.4.3. Add 1.0 mL of desorbing solvent to each vial using the same dispenser as used for preparation of standards.
3.4.4. Immediately cap the vials and shake them periodically for about 30 min.
3.4.5. If magnesium sulfate is used as the drying agent, centrifuge the vials or allow time for the powder to settle out to avoid plugging the syringe used for GC injections.
3.5. Analysis
- 3.5.1. GC conditions
| zone temperatures: | column- injector- detector- |
95°C 175°C 200°C | |
| gas flows: | hydrogen (carrier)- nitrogen (makeup)- hydrogen (flame)- air- |
3.0 mL/min (60 kPa head pressure) 37 mL/min 33 mL/min 390 mL/min | |
| signal range: | 0 | ||
| injection volume: | 1.0 µL (with a 15:1 split) | ||
| column: | 30-m × 0.32-mm i.d. fused silica,
Stabilwax-DA®, | ||
| retention times: | 1M2P- 2M1P- 1M2PA- 2M1PA- 2-heptanol- |
3.1 min 4.4 min 4.7 min 5.4 min 7.2 min (internal standard) | |
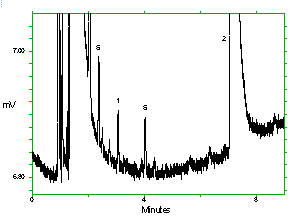
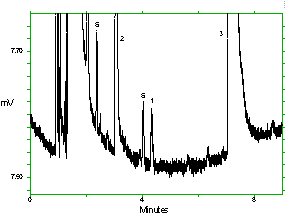
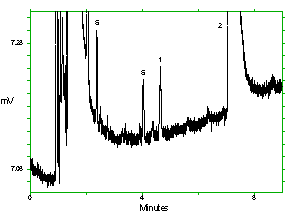
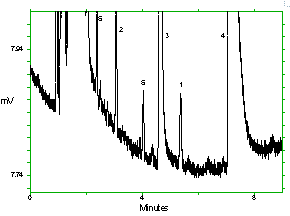
| chromatograms at the target concentrations: | |||
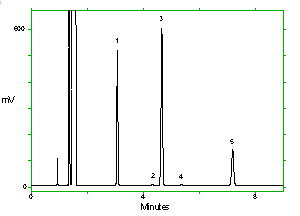 Chromatogram of the analytes at the target concentrations with 1M2P and 1M2PA at approximately full scale. Key: (1) 1M2P, (2) 2M1P, (3) 1M2PA, (4) 2M1PA, (5) |
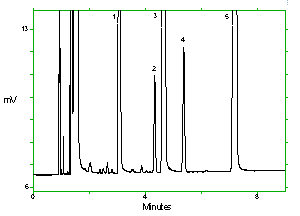 Chromatogram of the analytes at the target concentrations with 2M1P and 2M1PA at approximately full scale. Key: (1) 1M2P, (2) 2M1P, (3) 1M2PA, (4) 2M1PA, (5) |
3.5.2.Peak areas (or heights) are measured by an integrator or other suitable means.
3.5.3. An internal standard (ISTD) calibration method is used. Calibration curves are prepared by plotting micrograms of analyte per sample versus ISTD-corrected response of standard injections. Sample concentrations must be bracketed by standards.
3.6. Interferences (analytical)
- 3.6.1. Any compound that responds on a flame ionization detector
and has the same general retention time of the analyte or internal
standard is a potential interference. Possible interferences should
be reported to the laboratory with submitted samples by the
industrial hygienist. These interferences should be considered
before samples are desorbed.
3.6.2. GC parameters (i.e. column and column temperature) may be changed to possibly circumvent interferences.
3.6.3. Retention time on a single column is not considered proof of chemical identity. Analyte identity should be confirmed by GC/mass spectrometry.
3.7. Calculations
The analyte concentration for samples is obtained from the
appropriate calibration curve in terms of micrograms of analyte per
sample, uncorrected for desorption efficiency. The air concentration
is calculated using the following formulae. The back
| mg/m³ = | (µg of analyte per sample)
(L of air sampled)(desorption efficiency) |
| where desorption efficiencies = | 1.00 for 1M2P, 1.00 for 2M1P, 1.02 for 1M2PA, 1.01 for 2M1PA |
ppm = (mg/m³)(24.46) / (molecular weight of analyte)
where 24.46 is the molar volume at 25°C and 101.3 kPa (760 mmHg)
and molecular weights =
90.12 for 1M2P and
2M1P,
132.16 for 1M2PA and 2M1PA
3.8. Safety precautions (analytical)
- 3.8.1. Avoid skin contact and inhalation of all chemicals.
3.8.2. Restrict the use of all chemicals to a fume hood when possible.
3.8.3. Wear safety glasses and a lab coat at all times while in the lab area.
4. Backup Data
- 4.1. Detection limit of the analytical procedure
The detection limits of 48, 50, 71, and 71 pg per injection were determined by making injections (1.0 µL with a 15:1 split) of 726, 754, 1066, and 1066 pg/µL standards for 1M2P, 2M1P, 1M2PA, and 2M1PA respectively. These amounts were judged to produce peaks with heights approximately 5 times the baseline noise.
4.2. Detection limit of the overall procedure
The detection limits of the overall procedure of 0.73, 0.75, 1.1, and 1.1 µg per sample were determined by analyzing six samples for each analyte that had been spiked with 0.726, 0.754, 1.066, and 1.066 µg of 1M2P, 2M1P, 1M2PA, and 2M1PA respectively. The detection limits of the overall procedure correspond to air concentrations of 20 ppb (74 µg/m³), 20 ppb (74 µg/m³), 20 ppb (108 µg/m³), and 20 ppb (108 µg/m³) for 1M2P, 2M1P, 1M2PA, and 2M1PA respectively.
|
| ||||||||||||||||||||||||||||||||||||||||||||||||||||||||||||
4.3. Reliable quantitation limit
The reliable quantitation limits of 0.73, 0.75, 1.1, and 1.1 g per sample were determined by analyzing six samples for each analyte that had been spiked with 0.726, 0.754, 1.066, and 1.066 µg of 1M2P, 2M1P, 1M2PA, and 2M1PA respectively. The reliable quantitation limits correspond to air concentrations of 20 ppb (74 µg/m³), 20 ppb (74 µg/m³), 20 ppb (108 µg/m³), and 20 ppb (108 µg/m³) for 1M2P, 2M1P, 1M2PA, and 2M1PA respectively.
|
| ||||||||||||||||||||||||||||||||||||||||||||||||||||||||||||
4.4. Instrument response to the analyte
The instrument response to the analytes over the range of 0.5 to 2
times the target concentrations was determined from multiple
injections of analytical standards. The response is linear for all
four analytes with slopes (in
|
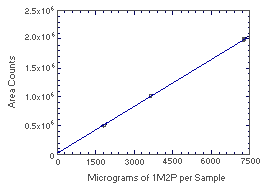 Figure 4.4.1. Instrument response to 1M2P. (Slope = 275) | |||||||||||||||||||||||||
|
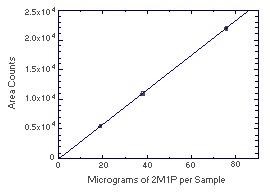 Figure 4.4.2. Instrument response to 2M1P. (Slope = 290) | |||||||||||||||||||||||||
|
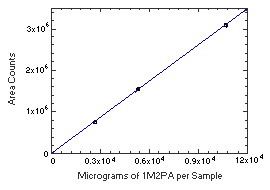 Figure 4.4.3. Instrument response to 1M2PA. (Slope = 291) | |||||||||||||||||||||||||
|
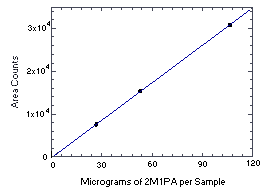 Figure 4.4.4. Instrument response to 2M1PA. (Slope = 290) | |||||||||||||||||||||||||
Storage samples were generated by sampling from atmospheres
containing the analytes at the target concentrations. 1M2P and 2M1P
were generated in the same atmosphere and 1M2PA and 2M1PA were
generated together in another atmosphere. For each set of 36 samples,
six samples were analyzed immediately after generation, fifteen were
stored in a refrigerator at 0°C and fifteen were stored in a closed
drawer at ambient temperatures of
|
| ||||||||
| days of storage |
% recovery (refrigerated) |
% recovery (ambient) | ||||||
|
| ||||||||
| 0 0 3 6 9 12 15 |
102.3 101.6 101.4 99.2 101.8 99.5 98.8 |
101.2 100.2 100.5 99.8 102.7 99.4 99.0 |
100.6 100.1 101.3 100.3 102.1 99.6 100.0 |
102.3 101.6 99.1 99.4 102.9 99.0 102.6 |
101.2 100.2 99.7 98.9 102.8 98.5 103.3 |
100.6 100.1 98.9 99.4 103.4 99.0 102.3 | ||
|
| ||||||||
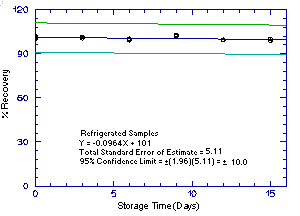 Figure 4.5.1.1. Refrigrerated 1M2P storage samples. |
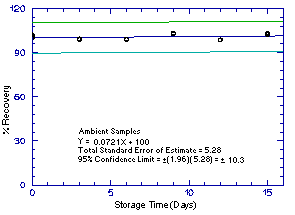 Figure 4.5.1.2. Ambient 1M2P storage samples. |
|
| ||||||||
| days of storage |
% recovery (refrigerated) |
% recovery (ambient) | ||||||
|
| ||||||||
| 0 0 3 6 9 12 15 |
105.1 100.9 101.8 96.4 95.0 98.5 94.5 |
98.8 103.0 95.9 98.8 95.7 96.6 92.3 |
96.7 100.4 98.0 98.4 95.7 97.3 96.9 |
105.1 100.9 103.2 95.9 94.8 97.4 95.8 |
98.8 103.0 100.1 98.2 93.8 97.5 94.3 |
96.7 100.4 96.8 97.2 94.6 97.2 96.0 | ||
|
| ||||||||
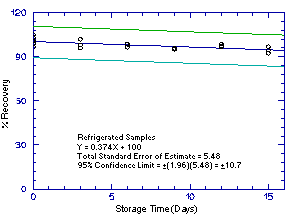 Figure 4.5.2.1. Refrigrerated 2M1P storage samples. |
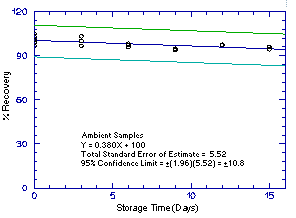 Figure 4.5.2.2. Ambient 2M1P storage samples. |
|
| ||||||||
| days of storage |
% recovery (refrigerated) |
% recovery (ambient) | ||||||
|
| ||||||||
| 0 0 3 6 9 12 15 |
101.1
99.2 96.4 98.4 96.6 96.9 99.2 |
100.5
98.8 97.5 97.3 96.8 97.5 99.1 |
98.4 99.8 97.6 97.7 92.8 97.0 100.0 |
101.1
99.2 97.2 98.8 98.7 98.8 97.8 |
100.5
98.8 97.3 98.6 98.8 98.6 97.6 |
98.4 99.8 97.2 99.1 98.1 98.7 95.6 | ||
|
| ||||||||
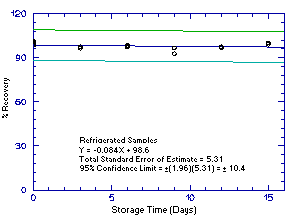 Figure 4.5.3.1. Refrigrerated 1M2PA storage samples. |
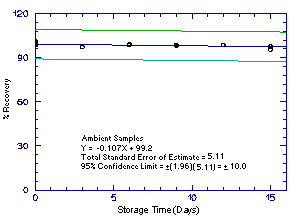 Figure 4.5.3.2. Ambient 1M2PA storage samples. |
|
| ||||||||
| days of storage |
% recovery (refrigerated) |
% recovery (ambient) | ||||||
|
| ||||||||
| 0 0 3 6 9 12 15 |
101.3
99.0 95.8 96.1 95.0 95.3 95.0 |
100.8 101.3 96.0 96.8 94.5 95.5 95.7 |
98.4 100.0 96.9 96.6 91.2 93.8 96.6 |
101.3
99.0 93.8 94.6 93.8 92.5 91.2 |
100.8 101.3 92.9 93.8 94.2 93.4 89.7 |
98.4 100.0 94.0 95.5 93.3 93.3 87.0 | ||
|
| ||||||||
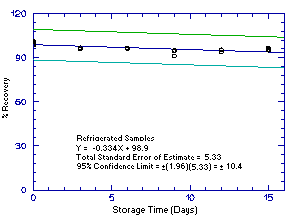 Figure 4.5.4.1. Refrigrerated 2M1PA storage samples. |
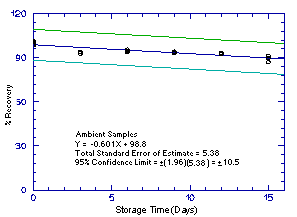 Figure 4.5.4.2. Ambient 2M1PA storage samples. |
4.6. Precision (analytical procedure)
The precision of the analytical procedure for each analyte is the pooled coefficient of variation determined from replicate injections of standards. The coefficients of variation (CV) are calculated from the data from Tables 4.4.1.-4.4.4. The pooled coefficients of variation are 0.0025, 0.0045, 0.0025, and 0.0041 for 1M2P, 2M1P, 1M2PA, and 2M1PA respectively.
|
| ||||||||||||||||||||||||||||||||||||||||
|
| ||||||||||||||||||||||||||||||||||||||||
4.7. Precision (overall procedure)
The precision of the overall procedure is determined from the storage data. The determination of the standard error of estimate (SEE) for a regression line plotted through the graphed storage data allows the inclusion of storage time as one of the factors affecting overall precision. The SEE is similar to the standard deviation, except it is a measure of dispersion of data about a regression line instead of about a mean. It is determined with the following equation:

| where | n = k = k = |
total no. of data points 2 for linear regression 3 for quadratic regression |
| Yobs = | observed percent recovery at a given time | |
| Yest = | estimated percent recovery from the regression line at the same given time |
An additional 5% for pump error is added to the SEE by the addition
of variances. The precision at the 95% confidence level is obtained by
multiplying the SEE (with pump error included) by 1.96 (the
Six samples for each analyte collected from controlled test
atmospheres (at about 80% R.H.,
|
| ||||||||||||||||||||||||||||||||||||||||
|
| ||||||||||||||||||||||||||||||||||||||||
4.9. Desorption efficiency [from dry charcoal using 95/5 (v/v) methylene chloride/methanol]
The average desorption efficiencies of 1M2P, 2M1P, 1M2PA, and 2M1PA are 100.4%, 99.7%, 101.8%, and 101.4% respectively over the range of 0.5 to 2 times the target concentrations. They were determined by injecting microliter amounts of stock standards into the front section of Lot 120 charcoal tubes. Eighteen samples were prepared, six samples for each concentration level listed in the following tables. The samples were stored in a refrigerator and analyzed the next day.
|
| |||||||
| desorption efficiency, % | |||||||
|
| |||||||
| 1M2P | 2M1P | ||||||
|
| |||||||
| × target concn µg/sample ppm |
0.5× 1815 49.3 |
1× 3630 98.5 |
2× 7260 197 |
0.5× 18.89 0.51 |
1× 37.78 1.03 |
2× 75.56 2.05 | |
|
| |||||||
| 100.8 100.3 99.5 100.2 101.5 100.7 |
99.6 101.5 100.0 100.7 100.4 100.1 |
99.9 100.5 100.1 100.5 99.7 100.3 |
99.9 98.1 97.5 97.3 99.5 101.4 |
99.7 101.2 101.8 103.1 97.4 100.6 |
99.4 100.2 97.7 100.2 98.7 100.7 | ||
| mean grand mean |
100.5 | 100.4 100.4 |
100.2 | 99.0 | 100.6 99.7 |
99.5 | |
|
| |||||||
|
| ||||||||
| desorption efficiency, % | ||||||||
|
| ||||||||
| 1M2PA | 2M1PA | |||||||
|
| ||||||||
| × target concn µg/sample ppm |
0.5× 2664 49.3 |
1× 5328 98.6 |
2× 10657 197 |
0.5× 26.64 0.49 |
1× 53.28 0.99 |
2× 106.6 1.97 | ||
|
| ||||||||
| 102.2 101.6 101.6 101.9 101.3 101.6 |
102.3 102.1 101.8 101.9 102.1 101.8 |
101.9 101.5 101.7 102.2 101.8 101.6 |
102.5 102.2 101.2 100.8 101.2 101.1 |
100.8 101.9 101.4 100.0 101.3 101.8 |
101.6 100.9 101.9 102.6 101.2 101.6 | |||
| mean grand mean |
101.7 | 102.0 101.8 |
101.8 | 101.5 | 101.2 101.4 |
101.6 | ||
|
| ||||||||
4.10. Stability of desorbed samples [from dry charcoal using 95/5 (v/v) methylene chloride/methanol]
| The stability of desorbed samples was checked by reanalyzing the target concentration samples from Section 4.9. one day later using fresh standards. The sample vials were resealed with new septa after the original analyses and were allowed to stand at room temperature until reanalyzed. |
| ||||||||||||||||||||||||||||||||||||
Studies were done at the target concentrations to determine what effect the presence of water had on the desorption efficiency for the four analytes. This was done by injecting analytical standards into the front sections of charcoal tubes that previously had 10 L of 80% RH air drawn through them. The samples were reanalyzed 24 h later to check the stability of desorbed samples. Finally, magnesium sulfate was added to the desorbed samples and they were reanalyzed again.
|
| ||||||||||||||||||||||||||||||||||||||||||||||||||||||||
|
| ||||||||||||||||||||||||||||||||||||||||||||||||||||||||
4.12. Desorption efficiency [from dry charcoal using 99/1 (v/v) CS2/DMF]
The average desorption efficiencies of 1M2P, 2M1P, 1M2PA, and 2M1PA are 86.3%, 80.8%, 98.4%, and 98.0% respectively over the range of 0.5 to 2 times the target concentrations. They were determined by injecting microliter amounts of stock standards into the front section of Lot 120 charcoal tubes. Eighteen samples were prepared, six samples for each concentration level listed in the following tables. The samples were stored in a refrigerator and analyzed the next day.
|
| |||||||
| desorption efficiency, % | |||||||
|
| |||||||
| 1M2P | 2M1P | ||||||
|
| |||||||
| × target concn µg/sample ppm |
0.5× 1815 49.3 |
1× 3630 98.5 |
2× 7260 197 |
0.5× 18.89 0.51 |
1× 37.78 1.03 |
2× 75.56 2.05 | |
|
| |||||||
| 84.1 84.7 84.8 83.3 84.1 83.5 |
87.6 87.9 88.8 89.0 84.4 86.8 |
89.2 88.7 83.4 89.1 88.6 85.4 |
81.0 78.7 79.1 76.5 76.5 75.2 |
80.0 80.6 84.1 83.8 83.7 81.0 |
83.6 82.7 80.5 85.3 81.9 79.7 | ||
| mean grand mean |
84.1 | 87.4 86.3 |
87.4 | 77.8 | 82.2 80.8 |
82.3 | |
|
| |||||||
|
| |||||||
| desorption efficiency, % | |||||||
|
| |||||||
| 1M2P | 2M1P | ||||||
|
| |||||||
| × target concn µg/sample ppm |
0.5× 2664 49.3 |
1× 5328 98.6 |
2× 10657 197 |
0.5× 26.64 0.49 |
1× 53.28 0.99 |
2× 106.6 1.97 | |
|
| |||||||
| 99.1 98.8 98.7 98.8 98.4 98.3 |
97.9 98.6 98.2 97.5 97.7 98.0 |
98.9 98.6 98.5 98.6 98.3 98.9 |
97.9 98.2 97.6 98.7 98.7 98.0 |
97.8 98.9 98.1 97.5 97.6 98.0 |
97.9 97.9 98.0 97.7 97.7 98.4 | ||
| mean grand mean |
98.7 | 98.0 98.4 |
98.6 | 98.2 | 98.0 98.0 |
97.9 | |
|
| |||||||
4.13. Stability of desorbed samples [from dry charcoal using 99/1 (v/v) CS2/DMF]
| The stability of desorbed samples was checked by reanalyzing the target concentration samples from Section 4.12. one day later using fresh standards. The sample vials were resealed with new septa after the original analyses and were allowed to stand at room temperature until reanalyzed. |
| ||||||||||||||||||||||||||||||||||||
Studies were done at the target concentrations to determine what
effect the presence of water had on the desorption efficiency for the
four analytes. This was done by injecting analytical standards into
the front sections of charcoal tubes that previously had 10 L of 80%
RH air drawn through them. The samples were reanalyzed 24 h later to
check the stability of desorbed samples. Magnesium sulfate was added
to
|
| ||||
| initial (no MgSO4) |
next day (no MgSO4) |
initial (with MgSO4) |
next day (with MgSO4) | |
|
| ||||
| % desorption | 50.9 50.9 50.8 |
48.0 48.1 49.7 |
79.5 83.0 76.2 |
78.9 75.3 79.7 |
| mean | 50.9 | 48.6 | 79.6 | 78.0 |
|
| ||||
|
| ||||
| initial (no MgSO4) |
next day (no MgSO4) |
initial (with MgSO4) |
next day (with MgSO4) | |
|
| ||||
| % desorption | 40.5 40.4 40.7 |
36.9 37.7 39.0 |
70.1 74.7 66.6 |
65.8 59.1 68.1 |
| mean | 40.5 | 37.9 | 70.5 | 64.3 |
|
| ||||
|
| ||||
| initial (no MgSO4) |
next day (no MgSO4) |
initial (with MgSO4) |
next day (with MgSO4) | |
|
| ||||
| % desorption | 93.2 94.5 93.0 |
94.6 94.3 93.8 |
95.8 96.6 96.7 |
96.5 95.8 95.2 |
| mean | 93.6 | 94.2 | 96.4 | 95.8 |
|
| ||||
|
| ||||
| initial (no MgSO4) |
next day (no MgSO4) |
initial (with MgSO4) |
next day (with MgSO4) | |
|
| ||||
| % desorption | 91.7 93.0 91.3 |
92.8 92.5 91.3 |
95.4 96.2 96.6 |
95.7 94.9 94.7 |
| mean | 92.0 | 92.2 | 96.1 | 95.1 |
|
| ||||
5. References
- 5.1. "Current Intelligence Bulletin 39,
Glycol Ethers"; May 2, 1983, U.S. Department of Health and Human
Services, Public Health Service, Center for Disease Control, NIOSH.
5.2. "NEG and NIOSH basis for an occupational
health standard: Propylene Glycol Ethers and Their Acetates";
1991, U.S. Department of Health and Human Services, Public Health
Service, Center for Disease Control, NIOSH, Publication No.
5.3. "Table Z-1-A -- Limits for Air Contaminants", Code of Federal Regulations, Title 29; 1910.1000, U.S. Office of the Federal Register National Archives and Records Administration, Washington, DC; 1991.
5.4. "OSHA Analytical Methods Manual" U.S.
Department of Labor, Occupational Safety and Health Administration;
OSHA Salt Lake Technical Center: Salt Lake City, UT, 1990; Method 79;
American Conference of Governmental Industrial Hygienists (ACGIH):
Cincinnati, OH, ISBN:
5.5. Elskamp, C.J. "OSHA Method No. 83;
5.6. Handbook of Chemistry and Physics,
70th ed.; CRC Press, Inc.: Boca Raton, FL,
