2-BUTANONE
| Method no.: | 84 |
| Matrix: | Air |
| Target concentration: | 200 ppm (590 mg/m3) |
| Procedure: | Samples are collected by drawing air through glass sampling
tubes containing Carbosieve |
| Recommended air volume and sampling rate: |
3 L at 0.05 L/min |
| Reliable quantitation limit: | 79.9 ppb (236 µg/m3) |
| Standard error of estimate at the target concentration: (Section 4.7.) |
8.4% |
| Status of method: | Evaluated method. This method has been subjected to the established evaluation procedures of the Organic Methods Evaluation Branch. |
| Date: July 1990 | Chemist: Donald Burright |
Organic Methods Evaluation Branch
OSHA Analytical
Laboratory
Salt Lake City, Utah
1.General Discussion
- 1.1. Background
- 1.1.1. History
2-Butanone is one of the industrial solvents that exhibit storage
stability problems when collected with charcoal sampling tubes. This
problem was overcome in OSHA Method 16, where samples were collected
with silica gel sampling tubes and analyzed on a GC equipped with a
flame ionization detector (FID) after desorption with dimethyl
sulfoxide (DMSO). (Ref.5.1.) In order to attain adequate sampler
capacity, the sampling procedure of OSHA Method 16 requires two
standard size
The purpose of this evaluation was to develop a sampling and
analytical procedure for
This procedure does not invalidate OSHA Method 16, but provides an alternative to the inconvenience of using sampling tubes connected in series.
1.1.2. Toxic effects (This section is for information only and should not be taken as the basis of OSHA policy.)
Inhalation of vapors may cause headache, nausea, vomiting,
dizziness, drowsiness, irritation of the respiratory tract, and loss
of consciousness. Contact with skin or eyes may cause irritation.
Prolonged exposure may cause dermatitis. Liquid may cause permanent
eye damage. Ingestion may cause nausea, vomiting, headaches,
dizziness, gastrointestinal irritation. (Ref. 5.3.) The TLV for
1.1.3. Workplace exposure
In 1985, 244 million kilograms were produced in the United
States. The major uses of
1.1.4. Physical properties and other descriptive information (Ref.5.7., unless otherwise stated)
| CAS no.: | 78-93-3 |
| molecular weight: | 72.11 |
| chemical formula: | CH3COCH2CH3 |
| melting point: | -86.4°C |
| boiling point: | 79.6°C |
| vapor pressure: | 10.33 kPa (77.5 mmHg) at 20°C |
| vapor density: | 2.41 (air=1) |
| specific gravity: | 0.805 (water=1) |
| explosive limits: | 1.8% (lower) (Ref.5.8.) 11.5% (upper) (Ref.5.8.) |
| self-ignition temperature: | 516°C (Ref.5.8.) |
| flash point: | -6°C (Ref.5.9.) |
| odor: | sharp, fragrant, acetone-like |
| odor threshold: | 2 ppm |
| appearance: | colorless liquid |
| solubility: | 27 g/100 mL of water; soluble in most common organic liquids |
| synonyms: | MEK; methyl ethyl ketone; ethyl methyl ketone; methyl acetone |
| The analyte air concentrations throughout this method are based on the recommended sampling and analytical parameters. Air concentrations listed in ppm and ppb are referenced to 25°C and 101.3 kPa (760 mmHg). |
1.2. Limit defining parameters
- 1.2.1. Detection limit of the analytical procedure
The detection limit of the analytical procedure is 0.141 ng per
injection
1.2.2. Detection limit of the overall procedure
The detection limit of the overall procedure is 0.707 µg per sample (79.9 ppb or 236 µg/m3). This is the amount of analyte spiked on the sampling device that allows recovery of an amount of analyte equivalent to the detection limit of the analytical procedure. (Section 4.2.)
1.2.3. Reliable quantitation limit
The reliable quantitation limit is 0.707 µg per sample (79.9 ppb or 236 µg/m3). This is the smallest amount of analyte spiked on the sampling device that can be quantitated within the requirements of a recovery of at least 75% and a precision (±1.96 SD) of ±25% or better. (Section 4.3.)
| The reliable quantitation limit and detection limits reported in the method are based upon optimization of the instrument for the smallest possible amount of analyte. When the target concentration of analyte is exceptionally higher than these limits, they may not be attainable at the routine operating parameters. |
1.2.4. Instrument response to the analyte
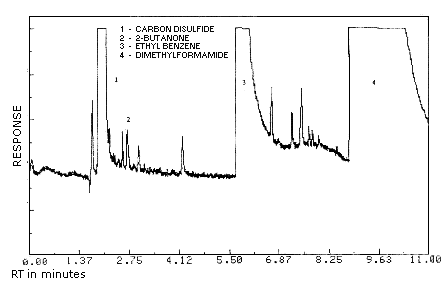
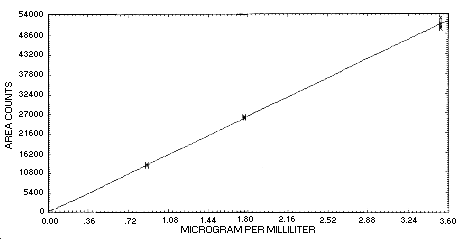
The instrument response over the concentration range of 0.5 to 2 times the target concentration is linear. (Section 4.4.)
1.2.5. Recovery
The recovery of
1.2.6. Precision (analytical procedure only)
The pooled coefficient of variation obtained from replicate determinations of analytical standards at 0.5, 1 and 2 times the target concentration is 0.0172. (Section 4.6.)
1.2.7. Precision (overall procedure)
The precision at the 95% confidence level for the 17-day ambient temperature storage test is ±16.4%. (Section 4.7.) This includes an additional ±5% for pump error. The overall procedure must provide results at the target concentration that are ±25% or better at the 95% confidence level.
1.2.8. Reproducibility
Six samples collected from a controlled test atmosphere and a draft copy of this procedure were given to a chemist unassociated with this evaluation. The samples were analyzed after 7 days of refrigerated storage. No individual sample result deviated from its theoretical value by more than the precision reported in Section 1.2.7. (Section 4.8.)
1.3. Advantages
- 1.3.1. This procedure allows the use of a single standard size
1.3.2. The desorbing solvent is no longer DMSO, which has a detrimental effect on GC columns.
1.4. Disadvantages
- 1.4.1. The fine mesh size of Carbosieve
1.4.2. The recommended sample size is 3 L as opposed to the 10 L sample size of previous methods.
2. Sampling Procedure
- 2.1. Apparatus
- 2.1.1. Samples are collected using a personal sampling pump
calibrated to within ±5% of the recommended flow rate with the
sampling device attached.
2.1.2. Samples are collected with 4-mm i.d. × 6-mm o.d.× 7.0 cm
glass sampling tubes packed with two sections of 60/80 mesh
Carbosieve
2.2. Reagents
No sampling reagents are required.
2.3. Technique
- 2.3.1. Immediately before sampling, break off the ends of the
Carbosieve
2.3.2. Attach the sampling tube to the sampling pump with
flexible tubing. It is desirable to utilize sampling tube holders
which have a protective cover that shield the employee from the
sharp, jagged end of the sampling tube. Position the tube so that
sampled air first passes through the
2.3.3. Air being sampled should not pass through any hose or tubing before entering the sampling tube.
2.3.4. Attach the sampler vertically in the worker's breathing zone in such a manner that it does not impede work performance or safety.
2.3.5. After sampling for the appropriate time, remove the
sampler and seal the tube with plastic end caps. Wrap each sample
2.3.6. Submit at least one blank sampler with each set of samples. Handle the blank sampler in the same manner as the other samples except draw no air through it.
2.3.7. Record sample volumes (in liters of air) for each sample, along with any potential interferences.
2.3.8. Ship any bulk samples in a container separate from the air samples.
2.4. Sampler capacity
The sampling capacity of the front section of a Carbosieve
2.5. Desorption efficiency
- 2.5.1. The average desorption efficiency for
2.5.2. Desorbed samples remain relativity stable for at least 24 h.(Section 4.10.2.)
2.6. Recommended air volume and sampling rate
- 2.6.1. For time-weighted average samples, the recommended air
volume is 3 L collected at 0.05 L/min
2.6.2. For short-term exposure limit samples, the recommended air
volume is 0.75 L collected at 0.05 L/min
2.6.3. When short-term exposure limit samples are required, the
reliable quantitation limit becomes larger. For example, the
reliable quantitation limit is 0.320 ppm (0.943
mg/m3) for
2.7. Interferences (sampling)
- 2.7.1. It is not known if any compounds will severely interfere
with the collection of
2.7.2. Suspected interferences should be reported to the laboratory with submitted samples.
2.8. Safety precautions (sampling)
- 2.8.1. The sampling equipment should be attached to the worker
in such a manner that it will not interfere with work performance or
safety.
2.8.2. All safety practices that apply to the work area being sampled should be followed.
2.8.3. Protective eyewear should be worn when breaking the ends
of the glass Carbosieve
3. Analytical Procedure
- 3.1. Apparatus
- 3.1.1. A GC equipped with a flame ionization detector (FID). A
3.1.2. A GC column capable of separating
3.1.3. An electronic integrator or some other suitable means of
measuring detector response. A
3.1.4. Two-milliliter vials with polytetrafluoroethylene-lined caps.
3.1.5. A dispenser capable of delivering 1.0 mL of desorbing
solution is used to prepare standards and samples. If a dispenser is
not available, a
3.2. Reagents
- 3.2.1.
3.2.2. Carbon disulfide, CS2. Reagent grade or better CS2 should be used. The CS2 (REAGENT ACS) was purchased from Fisher Scientific (Fair Lawn, NJ). In this evaluation, benzenefree CS2 was used. The CS2 had been passed through Molecular Sieve 13X (45/60 mesh) to remove the benzene contamination. Fifty grams of molecular sieve should remove the benzene from 1 L of carbon disulfide.
3.2.3. Dimethylformamide, DMF. Reagent grade or better should be used. The DMF (b&j brand HIGH PURITY SOLVENT) used in this evaluation was purchased from American Burdick & Jackson (Muskegon, MI).
3.2.4. Sodium sulfate, anhydrous. Sodium sulfate is used as a drying agent. The sodium sulfate (AR grade) used in this evaluation was purchased from Mallinckrodt (Paris, KY).
3.2.5. Desorbing solution. This consists of a solution of 99:1
(v/v)
3.2.6. Ethyl benzene. This was used as the internal standard in the desorbing solution. The solution is prepared by adding 250 µL of ethyl benzene to 1 L of desorbing solution. The ethyl benzene (reagent grade) used in this evaluation was purchased from Eastman Kodak (Rochester, NY).
3.3. Standard preparation
- 3.3.1.Prepare concentrated stock standards by diluting the
3.3.2. Prepare a sufficient number of analytical standards to
generate a calibration curve. Ensure that the amount of
3.4. Sample preparation
- 3.4.1. Remove the plastic caps from the sample tube and
carefully transfer each section of the adsorbent to separate vials.
Discard the glass tube and glass wool plugs.
3.4.2. Add approximately 150 mg of anhydrous sodium sulfate to each sample.
3.4.3. Add 1.0 mL of desorbing solution to each vial and
immediately seal the vials with
3.4.4. Shake the vials vigorously several times during the next 30 min.
3.5. Analysis
- 3.5.1. Analytical conditions
| GC conditions | |
| temperatures: | 40°C (column) 200°C (injector) 220°C (detector) |
| temp program: | hold initial temp 1.0 min, increase temp at 5°C/min to 65°C, then increase temp at 25°C/min to 190°C. |
| column gas flow: | 1.2 mL/min (hydrogen) |
| septum purge: | 1.5 mL/min (hydrogen) |
| injection size: | 1.0 µL (5:1 split) |
| column: | 30 m × 0.32-mm i.d. capillary SUPELCOWAX 10 (0.25-µm film thickness) |
| retention times: | 2.75 min ( 5.75 min (ethyl benzene) |
| FID conditions | |
| hydrogen flow: | 34 mL/min |
| air flow: | 450 mL/min |
| nitrogen makeup flow: | 33 mL/min |
| chromatogram: | Figure 3.5.1. |
3.5.2. Measure detector response using a suitable method such as electronic integration.
3.5.3. An internal standard (ISTD) calibration method is used. A
calibration curve can be constructed by plotting micrograms of
3.6. Interferences (analytical)
- 3.6.1. Any compound that produces an FID response and has a
similar retention time as the analyte or internal standard is a
potential interference. If any potential interferences were
reported, they should be considered before samples are desorbed.
Generally, chromatographic conditions can be altered to separate an
interference from the analyte.
3.6.2. Retention time on a single column is not considered proof of chemical identity. Analysis by an alternate GC column or confirmation by mass spectrometry are additional means of identification.
3.7. Calculations
The analyte concentration for samples is obtained from the
appropriate calibration curve in terms of micrograms per sample,
uncorrected for desorption efficiency. The air concentration is
calculated using the following formulae. The back
| mg/m3 = | (liters of air sampled) (desorption efficiency) |
| ppm = | (molecular weight of analyte) |
where 24.46 = molar volume (liters) at 101.3 kPa (760
mmHg) and 25°C
- molecular weight = 72.11
3.8. Safety precautions (analytical)
- 3.8.1. Restrict the use of all chemicals to a fume hood.
3.8.2. Avoid skin contact and inhalation of all chemicals.
3.8.3. Wear safety glasses and a lab coat at all times while in the laboratory areas.
4. Backup Data
- 4.1. Detection limit of the analytical procedure
The detection limit of the analytical procedure is 0. 141 ng per
injection, based on a
4.2. Detection limit of the overall procedure
The detection limit of the overall procedure is 0.707 µg per sample
(79.9 ppb or 236 µg/m3). The injection size
listed in the analytical procedure (1.0 µL, 5:1 split) was used in the
determination of the detection limit of the overall procedure. Eight
vials containing 130 mg of Carbosieve
|
| ||
| sample no. | µg spiked | µg recovered |
|
| ||
| 1 | 0.707 | 0.677 |
| 2 | 0.707 | 0.689 |
| 3 | 0.707 | 0.743 |
| 4 | 0.707 | 0.756 |
| 5 | 0.707 | 0.747 |
| 6 | 0.707 | 0.720 |
| 7 | 0.707 | 0.722 |
| 8 | 0.707 | 0.739 |
|
| ||
4.3. Reliable quantitation limit data
The reliable quantitation limit is 0.707 µg per sample (79.9 ppb or
236 µg/m3). The injection size listed in the
analytical procedure (1.0 µL, 5:1 split) was used in the determination
of the reliable quantitation limit. Eight vials containing 130 mg of
Carbosieve
|
| ||
| percent recovered |
statistics | |
|
| ||
| 95.8 | ||
| 97.4 | 102.4 | |
| 105.1 | SD = | 4.0 |
| 106.9 | Precision = | (1.96)(±4.0) |
| 105.6 | = | ±7.8 |
| 101.8 | ||
| 102.1 | ||
| 104.5 | ||
|
| ||
4.4. Instrument response to
The instrument response to
|
| |||
| × target concn µg/mL |
0.5× 885 |
1× 1770 |
2× 3540 |
|
| |||
| area counts | 12714 | 25768 | 50082 |
| 13154 | 25721 | 51115 | |
| 12992 | 26147 | 51561 | |
| 13173 | 26068 | 50283 | |
| 12749 | 25967 | 50497 | |
| 12629 | 25817 | 52899 | |
| 12676 | 25528 | 50759 | |
| 13062 | 25527 | 53058 | |
| 12894 | 25818 | 51282 | |
|
| |||
4.5. Storage data
Storage samples are generated by sampling the recommended air
volume at the recommended sampling rate from a test atmosphere at 80%
relative humidity containing
|
| ||||||||
| storage time | % recovery | % recovery | ||||||
| (days) | (ambient) | (refrigerated) | ||||||
|
| ||||||||
| 0 | 116.2 | 103.1 | 98.0 | 116.2 | 103.1 | 98.0 | ||
| 97.0 | 87.9 | 97.7 | 97.0 | 87.9 | 97.7 | |||
| 4 | 96.8 | 94.1 | 99.9 | 99.9 | 93.9 | 89.0 | ||
| 7 | 84.1 | 87.2 | 88.6 | 96.6 | 86.3 | 87.7 | ||
| 11 | 83.0 | 87.9 | 80.1 | 91.7 | 89.0 | 89.3 | ||
| 14 | 77.8 | 77.0 | 81.9 | 91.1 | 89.3 | 93.6 | ||
| 17 | 87.9 | 82.4 | 90.5 | 82.3 | 92.7 | 91.2 | ||
|
| ||||||||
4.6. Precision (analytical method)
The precision of the analytical procedure is defined as the pooled
coefficient of variation determined from replicate injections of
![]() ) were calculated and are listed
below.
) were calculated and are listed
below.
|
| |||
| × target concn µg/mL |
0.5× 885 |
1× 1770 |
2× 3540 |
|
| |||
| SD1 | 225 | 231 | 1147 |
| CV | 0.01746 | 0.00895 | 0.02236 |
|
1 standard deviation is in area counts | |||
4.7. Precision (overall procedure)
The precision of the overall procedure is determined from the storage data. The determination of the standard error of estimate (SEE) for a regression line plotted through the graphed storage data allows the inclusion of storage time as one of the factors affecting overall precision. The SEE is similar to the standard deviation, except it is a measure of dispersion of data about a regression line instead of about a mean. It is determined with the following equation:

| where | |
| n = k = k = |
total no. of data points 2 for linear regression 3 for quadratic regression |
| Yobs =
Yest = |
observed % recovery at a given
time estimated % recovery from the regression line at the same given time |
An additional 5% for pump error is added to the SEE by the addition
of variances. The precision at the 95% confidence level is obtained by
multiplying the SEE (with pump error included) by 1.96 (the
4.8. Reproducibility data
Six samples, collected from a dynamically generated atmosphere
containing
|
| |||
| µg spiked | µg recovered | % recovered | % deviation |
|
| |||
| 3490 | 2978 | 85.3 | -14.7 |
| 3680 | 3275 | 89.0 | -11.0 |
| 1763 | 1608 | 91.2 | -8.8 |
| 1774 | 1633 | 92.1 | -7.9 |
| 1215 | 1082 | 89.1 | -10.9 |
| 1173 | 1113 | 94.9 | -5.1 |
|
| |||
4.9. Sampler capacity
Sampler capacity was determined by sampling from a dynamically
generated atmosphere of 400 ppm (1080 mg/m3)
|
| |||
| air vol (L) |
sample time (min) |
downstream (mg/m3) |
breakthrough (%) |
|
| |||
| 2.322 | 45.0 | 0 | 0 |
| 5.031 | 97.5 | 0 | 0 |
| 5.805 | 112.5 | 0 | 0 |
| 6.631 | 128.5 | 0 | 0 |
| 7.405 | 143.5 | 0 | 0 |
| 8.179 | 158.5 | 0 | 0 |
| 8.953 | 173.5 | 0 | 0 |
| 9.727 | 188.5 | 0 | 0 |
| 10.50 | 203.5 | 18.5 | 1.71 |
| 11.27 | 218.5 | 75.4 | 6.99 |
| 12.05 | 233.5 | 206.6 | 19.1 |
|
| |||
4.10. Desorption efficiency and stability of desorbed samples
- 4.10.1. Desorption efficiency
The desorption efficiency (DE) of
|
| |||
| × target concn µg/mL |
0.5× 885 |
1× 1770 |
2× 3540 |
|
| |||
| DE, % | 100.7 | 101.1 | 95.9 |
| 96.9 | 100.0 | 96.9 | |
| 96.4 | 101.6 | 96.9 | |
| 99.6 | 99.3 | 98.7 | |
| 99.7 | 95.9 | 98.7 | |
| 96.1 | 102.7 | 98.4 | |
| 98.2 | 100.1 | 97.6 | |
|
| |||
4.10.2. Stability of desorbed samples
The stability of desorbed samples was investigated by reanalyzing the target concentration samples 24 h after initial analysis. The original analysis was performed and the vials were not recapped after injection. The samples were reanalyzed with fresh standards. The average recovery, compared to the average recovery of the original analysis, was 95.8 or a -4.3% change.
|
| ||
| initial recovery (percent) |
recovery after 24 h (percent) |
percent change |
|
| ||
| 101.1 | 97.5 | -3.6 |
| 100.0 | 95.9 | -4.1 |
| 101.6 | 88.8 | -12.8 |
| 99.3 | 97.7 | -1.6 |
| 95.9 | 94.3 | -1.6 |
| 102.7 | 100.3 | -2.4 |
|
| ||
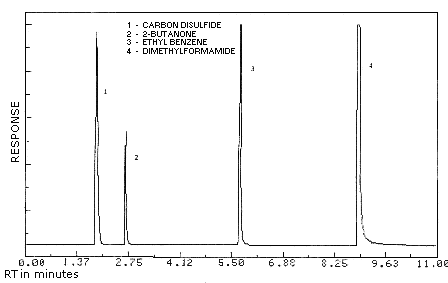
Figure 3.5.1. Chromatogram
of 2-butanone at 0.2 times the target concentration.
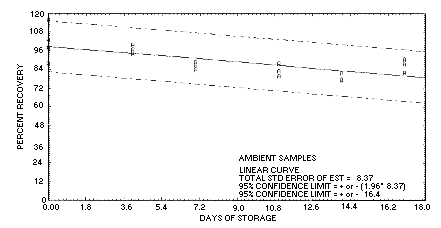
Figure 4.5.1. Ambient
storage test for 2-butanone.
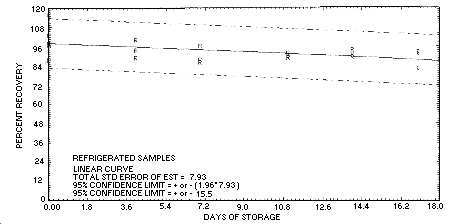
Figure 4.5.2. Refrigerated
storage test for 2-butanone.
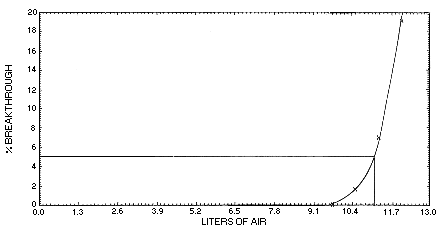
Figure 4.9. Determination
of 5% breakthrought air volume.
5. References
- 5.1. "OSHA Analytical Methods Manual"; U.S. Department of Labor,
Occupational Safety and Health Administration; OSHA Analytical
Laboratory; Salt Lake City, UT, 1985; Method 16; American Conference
of Government Industrial Hygienists (ACGIH); Cincinnati, ISBN
5.2. Cummins, K.J. "OSHA Method No. 69; Acetone", OSHA Analytical Laboratory, unpublished, Salt Lake City, UT 84165, March, 1988.
5.3. "Industrial Exposure and Control Technologies for OSHA Regulated Hazardous Substances", U.S. Department of Labor, Occupational Safety and Health Administration, Washington, D.C.
5.4. "Documentation of Threshold Limit Values and Biological
Indices" 5th ed.; American Conference of Government Industrial
Hygienists (ACGIH); Cincinnati, ISBN
5.5. "Hazardous Substances Database", on-line database from U.S. Department of Health and Human Services, National Library of Medicine, Bethesda, MD.
5.6. "NIOSH Criteria for a Recommended Standard: Occupational
Exposure to Ketones", U.S. Department of Health, Education, and
Welfare, PHS/CDC/NIOSH, pp
5.7. ChemInfo Database on CCINFO CD-R0M disc 89-2, Canadian Centre for Occupational Health and Safety, Hamilton, Ontario.
5.8. CAMEO Database, National Oceanic and Atmospheric Administration, Hazardous Materials Response Branch, Seattle, WA.
5.9. Papa, Anthony J., Sherman, Paul D. in "Kirk-Othmer Encyclopedia of Chemical Technology"; 3rd ed. ; Grayson, M., Ed.; John Wiley & Sons, New York, 1983, Vol. 13, p 899.
