N-ISOPROPYLANILINE
| Method no.: | 78 | ||||||
| Matrix: | Air | ||||||
| Procedure: | Samples are collected closed-face by drawing known
volumes of air through sampling devices consisting of three-piece
cassettes, each containing two sulfuric acid-treated glass fiber
filters separated by a spacer. Analysis is performed by extracting
the filters with methyl alcohol and analyzing the free amines by
| ||||||
| Recommended air volume and sampling rate: |
100 L at 1 L/min | ||||||
| |||||||
| Target concentration: |
| ||||||
| Reliable quantitation limit: (based on a 100-L air volume) |
| ||||||
| Standard error of estimate at the target concentration: (Section 4.7.) |
| ||||||
| |||||||
| Special requirements: | Diphenylamine samples should be refrigerated until analyzed to help minimize loss of analyte during storage. | ||||||
| Status of method: | Evaluated method. This method has been subjected to the established evaluation procedures of the Organic Methods Evaluation Branch. | ||||||
| Date: July 1989 | Chemist: Carl J. Elskamp | ||||||
OSHA Analytical Laboratory
Salt Lake City, Utah
1. General Discussion
- 1.1. Background
- 1.1.1. History
The previous OSHA-evaluated method to determine diphenylamine in
air involved collection in bubblers containing isopropyl alcohol
with analysis by HPLC. (Ref. 5.1.)
No method was found for
In the previously evaluated acid-treated filter methods for the
other aromatic amines, a heptafluorobutyric acid anhydride
derivative of the amines was prepared to obtain better
sensitivities. Both
1.1.2. Toxic effects (This section is for information only and should not be taken as the basis of OSHA policy.) The following is taken directly from the Trade Names Database of the Canadian Centre for Occupational Health and Safety. (Ref. 5.6.)
- N-Isopropylaniline: Dermal contact and inhalation are expected
to be the primary routes of occupational exposure to
Diphenylamine: Diphenylamine dust can irritate the nose and throat. Absorption of large amounts of diphenylamine into the body by any route can affect the heart and blood. An increased pulse rate and increased blood pressure may occur. Some breakdown of the oxygen-carrying components of the blood may occur (methemoglobinemia).
1.1.3. Workplace exposure
N-Isopropylaniline is used in the dyeing of acrylic fibers and as a chemical intermediate. Diphenylamine is used as a stabilizer for nitrocellulose explosives and celluloids, and in the manufacture of dyes. (Ref. 5.7.)
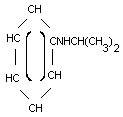
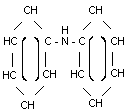
1.1.4. Physical properties and other descriptive information (Ref. 5.6.)
| diphenylamine | |||||
|
|
| ||||
| CAS no.: | 768-52-5 | 122-39-4 | |||
| molecular weight: | 135.21 | 169.22 | |||
| boiling point: | 202°C | 302°C | |||
| melting point: | 52-55°C | ||||
| description: | clear straw-colored liquid with sweet aromatic odor | white to light tan to brown crystals with floral odor | |||
| solubility: | insoluble in water soluble in acetone, ethanol, benzene, carbon tetrachloride |
300 mg/L in water at 25°C. freely soluble in ether, benzene, glacial acetic acid and carbon disulfide. very soluble in ethyl alcohol, propyl alcohol, ethyl acetate, carbon tetrachloride, acetone and pyridine. | |||
| specific gravity: | 0.9330 at 25/15.6°C | 1.159 at 20°C | |||
| vapor pressure: | 4.0 Pa (0.03 mm Hg) at |
133 Pa (1 mm Hg) at 108.3°C | |||
| vapor density: | 5.82 (air = 1) | ||||
| flash point: | 212°F (Cleveland open cup) | 302°F (150°C) | |||
| autoignition temperature: | 1173°F (634°C) | ||||
| synonyms and trade names: | NIPA |
anilinobenzene; Big Dipper; biphenylamine; DFA; DPA; C.I. 10355; difenylamin; | |||
| structural formula: | |||||
| |||||
The analyte air concentrations throughout this method are based on the recommended sampling and analytical parameters. Air concentrations listed in ppm and ppb are referenced to 25°C and 760 mm Hg.
1.2. Limit defining parameters
- 1.2.1. Detection limit of the analytical procedure
The detection limit of the analytical procedure is 1.7 ng per
injection for both
1.2.2. Detection limit of the overall procedure
The detection limit of the overall procedure is 1.0 µg per sample
for both
1.2.3. Reliable quantitation limit
The reliable quantitation limit is 1.0 µg per sample for both
The reliable quantitation limits and detection limits reported in this method are based upon optimization of the instrument for the smallest possible amount of analyte. When the target concentration of an analyte is exceptionally higher than these limits, they may not be attainable at the routine operating parameters.
1.2.4. Instrument response to the analyte
The instrument response over concentration ranges representing 0.5 to 2 times the target concentrations is linear for both analytes. (Section 4.4.)
1.2.5. Recovery
The recoveries of
1.2.6. Precision (analytical method only)
The pooled coefficient of variation obtained from replicate
injections of analytical standards at 0.5, 1, and 2 times the target
concentrations is 0.002 and 0.007 for
1.2.7. Precision (overall procedure)
The precisions at the 95% confidence level for the 15-day storage
tests are ±12.5 and ±12.3% for
1.2.8. Reproducibility
Six samples, spiked by liquid injection, and a draft copy of this procedure were given to a chemist unassociated with this evaluation. The samples were analyzed after 2 days of storage at approximately 23°C. No individual sample result deviated from its theoretical value by more than the precision of the overall procedure as reported in Section 1.2.7. (Section 4.8.)
1.3. Advantages
- 1.3.1. The acid-treated filter provides a convenient method of
sampling for a number of aromatic amines.
1.3.2. The analysis is rapid, sensitive, and precise.
1.4. Disadvantages
None
2. Sampling Procedure
- 2.1. Apparatus
- 2.1.1. Samples are collected using a personal sampling pump that
can be calibrated within ±5% of the recommended flow rate with the
sampling device attached.
2.1.2. Samples are collected closed-face using a sampling device consisting of two sulfuric-acid treated 37-mm Gelman type A/E glass fiber filters contained in a three-piece cassette. The filters are prepared by soaking each filter with 0.5 mL of 0.26 N sulfuric acid. (0.26 N Sulfuric acid can be prepared by diluting 1.5 mL of 36 N sulfuric acid to 200 mL with deionized water.) The filters are dried in an oven at 100°C for 1 h and then assembled into three-piece 37-mm polystyrene cassettes without support pads. The front filter is separated from the back filter by a polystyrene spacer. The cassettes are sealed with shrink bands and the ends are plugged with plastic plugs.
2.2. Reagents
None required
2.3. Sampling technique
- 2.3.1. Remove the plastic plugs from the sampling device
immediately before sampling.
2.3.2. Attach the sampling device to the sampling pump with flexible tubing and place the device in the employee's breathing zone.
2.3.3. Seal the sampling device with the plastic plugs immediately after sampling.
2.3.4. Seal and identify each sampling device with an OSHA Form 21.
2.3.5. Submit at least one blank sampling device with each sample set. Handle the blanks in the same manner as the air samples, but draw no air through them.
2.3.6. Record the volume of air sampled (in liters) for each sample, along with any potential interferences.
2.4. Collection efficiency
- 2.4.1. Generation apparatus
Collection efficiency studies were conducted by drawing air
through sampling devices that were attached to empty impingers.
Microliter amounts of amine standards (in methyl alcohol) were
injected into the impingers before sampling commenced. The inlets of
the impingers were attached to a humid air generator so air at
approximately 80% relative humidity could be drawn through the
generation apparatus. The
2.4.2. Collection efficiency at 2 times the target concentration
Three individual collection efficiencies were determined at 2 times the target concentration for each analyte. This was done by adding an amount of amine of interest, which was equivalent to 20 mg/m3 for a 100-L air sample (approximately 2 mg), to each impinger before sampling at 1 L/min for 100 min. There was no analyte found on the back filter of any of the samples, while essentially all of the amine which was spiked into the impingers was recovered from the front filters.
2.5. Extraction efficiency
- 2.5.1. The average extraction efficiencies from six filters for
each amine spiked at the target concentration are 100.5 and 100.4%
for
2.5.2. The stability of extracted samples was verified by
reanalyzing the above samples 24 h later using fresh standards. The
average extraction efficiencies for the reanalyzed samples were 99.2
and 99.1% for
2.6. Recommended air volume and sampling rate
- 2.6.1. The recommended air volume is 100 L.
2.6.2. The recommended sampling rate is 1 L/min.
2.6.3. If a smaller air volume is desired, the reliable
quantitation limits will be larger. For example, the reliable
quantitation limit for
2.7. Interferences (sampling)
- 2.7.1. Any compound in the sampled air that will react with the
sulfuric acid on the treated filters or with the collected analyte
is a potential sampling interference.
2.7.2. Suspected interferences should be reported to the laboratory with submitted samples.
2.8. Safety precautions (sampling)
- 2.8.1. Attach the sampling equipment to the employees so that it
will not interfere with work performance or safety.
2.8.2. Follow all safety procedures that apply to the work area being sampled.
3. Analytical Procedure
- 3.1. Apparatus
- 3.1.1. An HPLC equipped with an ultraviolet detector. A Waters
HPLC consisting of a 600E pumping system, 990 photodiode array
detector and 712 WISP autosampler was used in this evaluation.
3.1.2. An HPLC column capable of separating the analyte from the
solvent and interferences. A Waters Radial-Pak 100-mm × 8-mm i.d.
cartridge containing Nova-Pak C18
(end-capped 4-µm spherical particles) was used in conjunction with a
Waters
3.1.3. An electronic integrator or some other suitable means of measuring peak areas or heights. A Hewlett-Packard 18652A A/D converter interfaced to a Hewlett-Packard 3357 Lab Automation Data System was used in this evaluation.
3.1.4. Small resealable glass vials with Teflon-lined caps capable of holding 4 mL. WISP-type autosampler vials were used in this evaluation.
3.1.5. A dispenser for methyl alcohol capable of delivering 3.0 mL.
3.1.6. A filtering apparatus to filter the extracted samples before they are injected into the HPLC. Disposable Cameo HPLC syringe filters (3-mm Magna Nylon 66 membrane filters, 5.0-µm pore size) manufactured by Micron Separations Inc. (available through Fisher Scientific) were used with a 10-mL Multifit glass syringe.
3.1.7. A pH meter with a combination electrode is used in the preparation of the HPLC mobile phase.
3.2. Reagents
- 3.2.1. N-Isopropylaniline and diphenylamine, reagent grade. The
3.2.2. HPLC grade methyl alcohol and water. The methyl alcohol used in this evaluation was "b&j brand High Purity Solvent" manufactured by American Burdick and Jackson. The water was from an in-house Millipore Milli-Q water purification system.
3.2.3. Di-n-butylamine and phosphoric acid, reagent grade.
3.3. Standard preparation
- 3.3.1. Restrict the use of pure compounds and concentrated
standards to regulated areas. Prepare concentrated stock standards
by diluting the pure amines with methyl alcohol. Stock standards
appear to be stable for at least three months when refrigerated.
3.3.2. Prepare analytical standards by injecting microliter amounts of stock standards into 4-mL vials containing 3.0 mL of methyl alcohol.
3.3.3. Bracket sample concentrations with analytical standard concentrations. If sample concentrations are higher than the upper range of prepared standards, prepare additional standards to ascertain detector response or dilute the methyl alcohol extract of the high samples.
3.4. Sample preparation
- 3.4.1. Transfer the sample filters to individual 4-mL vials.
3.4.2. Add 3.0 mL of methyl alcohol to each vial.
3.4.3. Recap and shake the vials end-to-end for 15 min.
3.4.4. Filter each sample extract with disposable filtration units prior to injection into the HPLC.
3.5. Analysis
- 3.5.1. HPLC conditions and information
| mobile phase: | 75/25, methyl alcohol/water containing 1.7 mL
of |
| flow rate: | 2 mL/min |
| UV detector wavelength: |
diphenylamine, 285 nm |
| injection volume: | 5 µL |
| column: | Waters Radial-Pak 100-mm × 8-mm i.d. cartridge
containing |
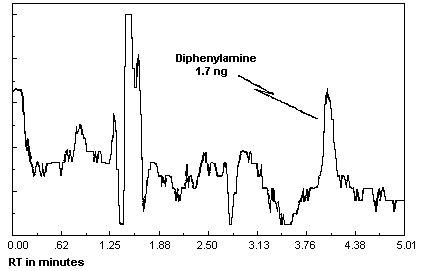
| retention times: | diphenylamine, 4.1 min |
| chromatograms: | Section 4.10. |
3.5.2. Measure peak areas or heights by use of an integrator or by other suitable means.
3.5.3. Construct a calibration curve by plotting response (peak areas or heights) of standard injections versus micrograms of analyte per sample. Bracket sample concentrations with standards.
3.6. Interferences (analytical)
- 3.6.1. Any compound that elutes in the same general time as the
amine of interest is a potential interference. Suspected
interferences reported to the laboratory with submitted samples by
the industrial hygienist must be considered before samples are
extracted.
3.6.2. HPLC parameters may be changed to possibly circumvent interferences.
3.6.3. Retention time on a single column is not considered proof of chemical identity. Analyte identity should be confirmed by mass spectrometry if possible.
3.7. Calculations
The analyte concentration for samples is obtained from the calibration curve in micrograms of analyte per sample. If any analyte is found on any back filter, that amount is added to the amount found on the corresponding front filter. If any analyte is found on the blank filters, the combined amount is subtracted from the combined sample amounts. The air concentrations are calculated using the following formulae.
mg/m3 = (micrograms of analyte per sample)/(liters of air sampled)
ppm = (mg/m3)(24.46)/(MW)
| where | 24.46 MW |
= = |
the molar volume (liters) at 25°C and 760 mm
Hg 135.21 for |
3.8. Safety precautions (analytical)
- 3.8.1. Restrict the use of pure compounds and concentrated
standards to regulated areas. Avoid skin contact and inhalation of
all chemicals.
3.8.2. Restrict the use of all chemicals to a fume hood if possible.
3.8.3. Wear safety glasses and a lab coat at all times while in the lab area.
4. Backup Data
- 4.1. Detection limit of the analytical procedure
The injection volume (5 µL) listed in Section 3.5.1.
was used in the determination of the detection limit of the analytical
procedure. The detection limit of 1.7 ng per injection for both
4.2. Detection limit of the overall procedure
The detection limits of the overall procedure were determined by
analyzing filters spiked with loadings equivalent to the detection
limits of the analytical procedure. Samples were prepared by injecting
1.0 µg each of
Detection Limit of the Overall Procedure
for N-Isopropylaniline
|
| ||
| sample no. | µg spiked | µg recovered |
|
| ||
| 1 | 1.0 | 0.971 |
| 2 | 1.0 | 0.928 |
| 3 | 1.0 | 0.942 |
| 4 | 1.0 | 0.985 |
| 5 | 1.0 | 1.00 |
| 6 | 1.0 | 0.971 |
|
| ||
Detection Limit of the Overall Procedure
for Diphenylamine
|
| ||
| sample no. | µg spiked | µg recovered |
|
| ||
| 1 | 1.0 | 0.880 |
| 2 | 1.0 | 1.04 |
| 3 | 1.0 | 0.987 |
| 4 | 1.0 | 1.04 |
| 5 | 1.0 | 0.933 |
| 6 | 1.0 | 0.853 |
|
| ||
4.3. Reliable quantitation limit
The reliable quantitation limits were determined by analyzing
filters spiked with loadings equivalent to the detection limits of the
analytical procedure. Samples were prepared by injecting 1.0 µg each
of
Reliable Quantitation Limit for N-Isopropylaniline
(Based on samples and data of Table 4.2.1.)
|
| ||||
| sample no. | percent recovered | statistics | ||
|
| ||||
| 1 | 97.1 | = | 96.6 | |
| 2 | 92.8 | |||
| 3 | 94.2 | |||
| 4 | 98.5 | SD | = | 2.7 |
| 5 | 100.0 | Precision | = | ±(1.96)(2.7) |
| 6 | 97.1 | = | ±5.3 | |
|
| ||||
Reliable Quantitation Limit for Diphenylamine
(Based on samples and data of Table 4.2.2.)
|
| ||||
| sample no. | percent recovered | statistics | ||
|
| ||||
| 1 | 88.0 | = | 95.6 | |
| 2 | 104.0 | |||
| 3 | 98.7 | |||
| 4 | 104.0 | SD | = | 8.0 |
| 5 | 93.3 | Precision | = | ±(1.96)(8.0) |
| 6 | 85.3 | = | ±15.7 | |
|
| ||||
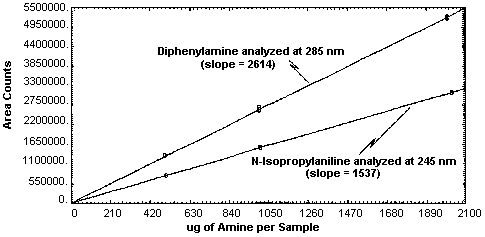
4.4. Instrument response to the analyte
The instrument response to the analytes over the range of 0.5 to 2
times the target concentrations was determined from multiple
injections of analytical standards. These data are given in Tables
4.4.1. and 4.4.2. and Figure 4.4.
The response is linear for both analytes with slopes (in area counts
per micrograms of analyte per sample) of 1537 and 2614 for
Instrument Response to N-Isopropylaniline
|
| |||
| × target conc. | 0.5× | 1× | 2× |
| µg/sample | 506.2 | 1012 | 2025 |
| ppm | 0.916 | 1.83 | 3.66 |
|
| |||
| area counts | 784080 | 1554040 | 3109350 |
| 785996 | 1555610 | 3111450 | |
| 787603 | 1556630 | 3115480 | |
| 785875 | 1554250 | 3109950 | |
| 788350 | 1550440 | 3110050 | |
| 786308 | 1549730 | 3118030 | |
| 786369 | 1553450 | 3112385 | |
|
| |||
Instrument Response to Diphenylamine
|
| |||
| × target conc. | 0.5× | 1× | 2× |
| µg/sample | 501.8 | 1004 | 2007 |
| mg/m3 | 5.02 | 10.0 | 20.1 |
|
| |||
| area counts | 1349730 | 2684350 | 5274850 |
| 1350460 | 2613570 | 5211220 | |
| 1354350 | 2616890 | 5220870 | |
| 1347210 | 2617630 | 5207250 | |
| 1347510 | 2628680 | 5233970 | |
| 1348040 | 2619460 | 5251500 | |
| 1349550 | 2630100 | 5233280 | |
|
| |||
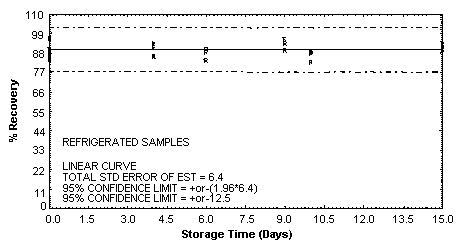
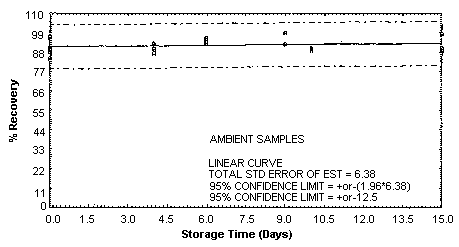
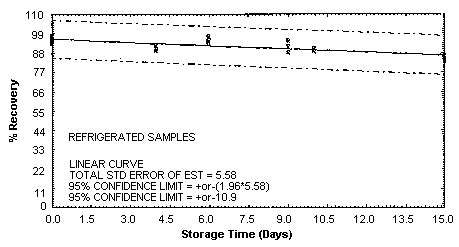
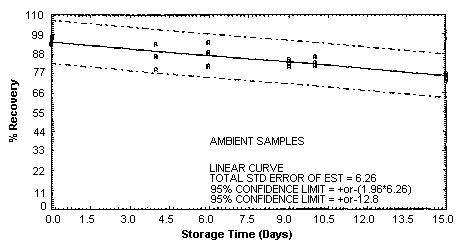
4.5. Storage test
Storage samples were generated by spiking sulfuric acid-treated
glass fiber filters with amounts of analyte equal to the target
concentrations (1012.5 µg of
Storage Test for N-Isopropylaniline
|
| ||||||
| storage time | % recovery | |||||
| (days) | (refrigerated) | (ambient) | ||||
|
|
|
| ||||
| 0 | 90.1 | 84.6 | 89.4 | 90.1 | 84.6 | 89.4 |
| 0 | 96.4 | 96.8 | 87.3 | 96.4 | 96.8 | 87.3 |
| 4 | 86.3 | 91.2 | 93.5 | 92.7 | 87.3 | 89.9 |
| 6 | 84.0 | 90.8 | 88.8 | 95.0 | 95.9 | 93.4 |
| 9 | 95.9 | 89.7 | 93.4 | 92.3 | 99.1 | 92.5 |
| 10 | 89.0 | 82.9 | 87.9 | 89.3 | 89.5 | 89.9 |
| 15 | 91.5 | 89.5 | 93.2 | 88.8 | 90.4 | 98.7 |
|
| ||||||
Storage Test for Diphenylamine
|
| ||||||
| storage time | % recovery | |||||
| (days) | (refrigerated) | (ambient) | ||||
|
|
|
| ||||
| 0 | 93.7 | 95.0 | 95.8 | 93.7 | 95.0 | 95.8 |
| 0 | 95.8 | 95.4 | 97.8 | 95.8 | 95.4 | 97.8 |
| 4 | 92.4 | 90.6 | 89.6 | 79.4 | 87.2 | 93.9 |
| 6 | 97.4 | 94.1 | 95.2 | 94.7 | 81.4 | 89.3 |
| 9 | 88.3 | 95.1 | 91.6 | 84.9 | 80.8 | 82.1 |
| 10 | 90.6 | 89.0 | 90.5 | 86.2 | 83.0 | 81.3 |
| 15 | 85.0 | 83.3 | 86.7 | 75.9 | 73.8 | 76.9 |
|
| ||||||
4.6. Precision (analytical method only)
The precision of the analytical method for each analyte is the pooled coefficient of variation determined from replicate injections of standards. The precision of the analytical method for each analyte is given in Tables 4.6.1. and 4.6.2. These tables are based on the data presented in Section 4.4.
Precision of the Analytical Method for N-Isopropylaniline
|
| |||
| × target conc. | 0.5× | 1× | 2× |
| µg/sample | 506.2 | 1012 | 2025 |
| ppm | 0.916 | 1.83 | 3.66 |
|
| |||
| SD (area counts) | 1488 | 2781 | 3547 |
| CV | 0.0019 | 0.0018 | 0.0011 |
|
| |||
Precision of the Analytical Method for Diphenylamine
|
| |||
| × target conc. | 0.5× | 1× | 2× |
| µg/sample | 506.2 | 1012 | 2025 |
| ppm | 0.916 | 1.83 | 3.66 |
|
| |||
| SD (area counts) | 2676 | 27061 | 25995 |
| CV | 0.0020 | 0.0103 | 0.0050 |
|
| |||
4.7. Precision (overall procedure)
The precision of the overall procedure is determined from the storage data. The determination of the standard error of estimate (SEE) for a regression line plotted through the graphed storage data allows the inclusion of storage time as one of the factors affecting overall precision. The SEE is similar to the standard deviation, except it is a measure of dispersion of data about a regression line instead of about a mean. It is determined with the following equation:

| where | ||
| n | = | total no. of data points |
| k | = | 2 for a linear regression |
| k | = | 3 for a quadratic regression |
| Yobs | = | observed % recovery at a given time |
| Yest | = | estimated % recovery from the regression line at the same given time |
An additional 5% for pump error is added to the SEE by the addition
of variances. The precision at the 95% confidence level is obtained by
multiplying the SEE (with pump error included) by 1.96 (the
4.8. Reproducibility
Six samples were prepared by injecting microliter quantities of
standards onto acid-treated filters. The samples were stored at
approximately 23°C for 2 days. The samples were analyzed by a chemist
unassociated with this evaluation. The results are given in Tables
4.8.1. and 4.8.2. The precision of the overall procedure is ±12.5% for
E
Reproducibility for N-Isopropylaniline
|
| ||||
| sample no. | µg expected | µg found | % found | % deviation |
|
| ||||
| 1 | 1086 | 1085 | 99.9 | -0.1 |
| 2 | 723.8 | 715.6 | 98.9 | -1.1 |
| 3 | 1086 | 1066 | 98.2 | -1.8 |
| 4 | 361.9 | 364.8 | 100.8 | +0.8 |
| 5 | 723.8 | 713.4 | 98.6 | -1.4 |
| 6 | 361.9 | 352.0 | 97.3 | -2.7 |
|
| ||||
Reproducibility for Diphenylamine
|
| ||||
| sample no. | µg expected | µg found | % found | % deviation |
|
| ||||
| 1 | 770.3 | 759.3 | 98.6 | -1.4 |
| 2 | 385.1 | 368.7 | 95.7 | -4.3 |
| 3 | 770.3 | 746.6 | 96.9 | -3.1 |
| 4 | 1155 | 1130 | 97.8 | -2.2 |
| 5 | 1155 | 1117 | 96.7 | -3.3 |
| 6 | 385.1 | 364.2 | 94.6 | -5.4 |
|
| ||||
4.9. Extraction efficiency
Six sample filters for each amine were spiked with the target
concentration amounts by liquid injection (1012 µg of
Extraction Efficiency for N-Isopropylaniline
|
| ||
| sample no. | % extracted | % extracted (reanalyzed after 24 h) |
|
| ||
| 1 | 99.2 | 98.0 |
| 2 | 100.7 | 99.6 |
| 3 | 100.6 | 99.6 |
| 4 | 101.0 | 99.7 |
| 5 | 100.8 | 99.5 |
| 6 | 100.5 | 98.9 |
| 100.5 | 99.2 | |
|
| ||
Extraction Efficiency for Diphenylamine
|
| ||
| sample no. | % extracted | % extracted (reanalyzed after 24 h) |
|
| ||
| 1 | 99.1 | 97.9 |
| 2 | 100.4 | 99.7 |
| 3 | 100.9 | 99.4 |
| 4 | 100.9 | 99.5 |
| 5 | 100.5 | 99.1 |
| 6 | 100.5 | 98.8 |
| 100.4 | 99.1 | |
|
| ||
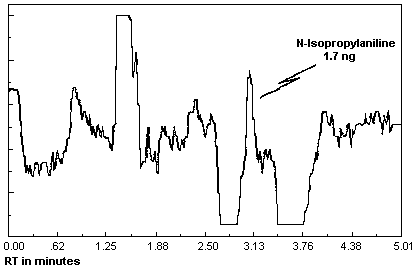
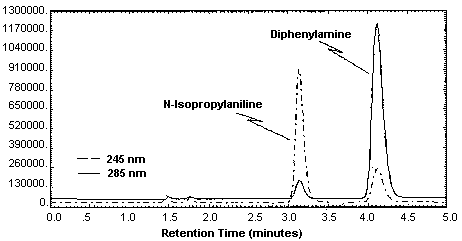
4.10. Chromatograms
Chromatograms of an analytical standard are shown in Figure 4.10.
The chromatograms are from a
5. References
- 5.1. "OSHA Analytical Methods Manual" U.S.
Department of Labor, Occupational Safety and Health Administration;
OSHA Analytical Laboratory: Salt Lake City, UT, 1985; Method 22;
American Conference of Governmental Industrial Hygienists (ACGIH):
Cincinnati, OH, ISBN:
5.2. Elskamp, C. J. "OSHA Method No. 57; 4,4'-Methylenedianiline", OSHA Analytical Laboratory, unpublished, Salt Lake City, UT 84165, January 1986.
5.3. Elskamp, C. J. "OSHA Method No. 65;
Benzidine, 3,3'-Dichlorobenzidine,
5.4. Elskamp, C. J. "OSHA Method No. 71;
o-Dianisidine, 4,4'-Methylenebis (2-chloroaniline),
5.5. Elskamp, C. J. "OSHA Method No. 73; o-, m-, and p-Toluidine", OSHA Analytical Laboratory, unpublished, Salt Lake City, UT 84165, August 1988.
5.6. ChemInfo and Trade Names Data Bases on CCINFOdiscs (89-2), Canadian Centre for Occupational Health and Safety, Hamilton, Ontario.
5.7. "Documentation of the Threshold Limit Values and Biological Exposure Indices"; American Conference of Governmental Industrial Hygienists Inc.: Cincinnati, OH, 5th ed. 1986.
