| Technical Links > Sampling &
Analytical Methods > Index |
 |
ACETONE |
 |
| Method no.: |
69 |
|
| Matrix: |
Air |
|
| Target concentration: |
1000 ppm (2375
mg/m3) (OSHA PEL) |
|
| Procedure: |
Air samples are collected by drawing
known volumes of air through standard size sampling tubes containing
130 mg of Carbosieve S-III (carbon based molecular
sieve) adsorbent in the front section and 65 mg in the back section.
The samples are desorbed with 1% dimethylformamide in carbon
disulfide, in the presence of magnesium sulfate, and analyzed by GC
with FID detection. |
|
Recommended air volume
and sampling
rate: |
3 L and 0.05 L/min |
|
| Reliable quantitation limit: |
2.0 ppm (4.7
mg/m3) |
|
Standard error of estimate
at the
target concentration:
(Section 4.7.) |
8.16% |
|
| Status of method: |
Evaluated method. This method has been
subjected to the established evaluation procedures of the Organic
Methods Evaluation Branch. |
|
| Date: March 1988 |
Chemist: Kevin
Cummins | |
Organic Methods Evaluation Branch
OSHA
Analytical Laboratory
Salt Lake City, Utah
|
1. General Discussion
1.1. Background
1.1.1. History
The previous OSHA method for sampling
acetone is essentially the NIOSH method for sampling organic vapors
(Ref. 5.1.). In that method air samples are collected on coconut
shell charcoal and analyzed by GC/FID following desorption with
carbon disulfide. One of the major limitations of the NIOSH method
is the poor stability of acetone and other ketones on charcoal
(Refs. 5.2. - 5.6.). Catalytic oxidation and irreversible adsorption
(chemisorption) of ketones on the surface of charcoal is thought to
account for the low recovery (Ref. 5.3.). This effect is most
pronounced for samples collected at high relative humidity (Ref.
5.2.).
Alternative sampling methods have been employed to
improve the storage stability of ketones collected on an adsorbent
surface. Sample tubes packed with either silica gel (Ref. 5.5.) or
Ambersorb XE-347 (Rohm & Haas, Philadelphia, PA)
(Ref. 5.6.), a synthetic, carbonaceous molecular sieve adsorbent,
have been used to collect 2-butanone with improved
sample stability. Collection of air samples on Ambersorb
XE-348, a slightly polar type of carbonaceous molecular
sieve material, results in improved storage stability of acetone,
2-butanone, methyl isobutyl ketone, cyclohexanone, and
isophorone (Ref. 5.2.). Pretreatment of coconut shell charcoal with
hydroquinone has been shown to slightly improve the stability of
cyclohexanone upon storage (Ref. 5.3.).
Carbosieve
S-III (Supelco, Inc., Bellefonte, PA) was used in this
evaluation for the collection of acetone. This material is a
carbonaceous molecular sieve adsorbent similar to the Ambersorb
XE-347 and XE-348. The stability of
acetone collected on this adsorbent is superior to that observed
with coconut shell charcoal (Section 4.5.) and comparable with
Ambersorb XE-348 (Ref. 5.2.). The sampling capacity of
Carbosieve S-III for acetone is greater than both
coconut shell or petroleum-based charcoal. It is also
greater than that of Ambersorb XE-347, Ambersorb
XE-348, and Purasieve, which is a synthetic
carbon-based material manufactured by Union Carbide
(Section 4.10.).
Occupational exposures to acetone alone are
uncommon. Typically acetone is used with other solvents. It would be
advantageous if Carbosieve S-III could be used to
collect a variety of other solvents simultaneously with acetone. The
sample capacities of Carbosieve S-III for some common
solvents have been found to equal or exceed that of coconut shell
charcoal (Section 4.10.). Common ketones and some esters which are
known to be unstable when collected on charcoal are also excellent
candidates for evaluation with Carbosieve S-III (Ref.
5.3.).
1.1.2. Toxic effects (This section is for information
only and should not be taken as the basis of OSHA policy.)
Acetone is a relatively non-toxic solvent. An oral
LD50 of 10.7 mL/kg in the rat has been
reported. Inhalation of the vapor may produce headaches, fatigue,
excitement, and bronchial irritation. (Ref. 5.8.) High vapor
concentrations will produce anesthesia. There are no confirmed
reports of serious effects produced from chronic exposure to low
levels of acetone. Prolonged or repeated skin exposure can dry and
defat the skin and lead to dermatitis. Direct contact of acetone
with the eye may produce temporary corneal injury. (Ref. 5.9.)
1.1.3. Workplace exposure
Acetone is used as a
chemical intermediate and solvent. In 1986, approximately 1.94
billion pounds of acetone were produced in the United States (Ref.
5.10.). Approximately one-third of the total amount
produced in the United States is used as an intermediate in the
production of methacrylates via the acetone cyanohydrin process
(Ref. 5.9.). Another 15% is used as a solvent for vinyl or acrylic
resins, alkyd paints, varnishes and lacquers, oils, waxes, plastics,
and rubber cements. Approximately 20% of the total U.S. acetone
production is used to produce a variety of common solvents. Methyl
isobutyl ketone, methyl isobutyl carbinol, mesityl oxide, hexylene
glycol, and isophorone are all derived from reactions in which the
initial step involves the self condensation of acetone (Ref. 5.9.).
Acetone is also used as a chemical intermediate in the production of
Bisphenol A, as a solvent and chemical intermediate in the
pharmaceutical industry, and as a solvent in the processing of
cellulose acetate.
1.1.4. Physical properties (Ref. 5.9.
unless otherwise noted) |
| CAS no.: |
67-64-1 |
| molecular weight: |
58.08 |
| appearance: |
colorless liquid |
| odor: |
pungent, aromatic-like |
| melting point: |
-123.5°C |
| boiling point at 1 atm: |
56.1°C |
| vapor pressure at 20°C: |
24.7 kPa (185 mm Hg) |
specific gravity:
(at 20°C relative to
water at 4°C) |
0.783 |
| solubility: |
miscible with water, alcohols, chloroform,
ether, and most oils (Ref. 5.8.) |
| flash point (closed cup): |
-18°C |
| autoignition temperature: |
538°C |
| flammable (explosive) limits: |
lower 2.1 |
| (% by volume in air) |
upper 13 |
| synonyms: |
2-propanone, dimethyl-ketone,
beta-keto-propane, pyroacetic acid |
| formula: |
CH3COCH3 |
|
The analyte air concentrations throughout this method are based on the
recommended sampling and analytical parameters. Air concentrations
listed in ppm are referenced to 25°C and 760 mm Hg.
1.2. Limit defining parameters
1.2.1. Detection limit of the analytical procedure
The
detection limit of the analytical procedure is 0.71 ng per
injection. This is the amount of analyte which is readily detectable
in the presence of the solvent front. (Section 4.1.)
1.2.2.
Detection limit of the overall procedure
The detection limit
of the overall procedure is 14.1 µg per sample (2.0 ppm or 4.7
mg/m3). This is the amount of acetone
spiked on the sampling device which allows recovery of an amount of
analyte equivalent to the detection limit of the analytical
procedure. (Section 4.2.)
1.2.3. Reliable quantitation limit
The reliable quantitation limit is 14.1 µg per sample (2.0
ppm or 4.7 mg/m3). This is the smallest
amount of analyte which can be quantitated within the requirements
of a recovery of at least 75% and a precision (±1.96 SD) of ±25% or
better. (Section 4.3.)
The reliable quantitation limit and detection limits reported in the
method are based upon optimization of the instrument for the
smallest possible amount of the analyte. When the target
concentration of the analyte is exceptionally higher than these
limits, they may not be attainable at the routine operating
parameters.
1.2.4. Instrument response to the analyte
The
instrument response over the concentration range of 0.5 to 2 times
the target concentration is linear. (Section 4.4.)
1.2.5.
Recovery
The recovery of acetone from samples used in a
storage test was equal to or greater than 86.7% when the samples
were stored at about 23°C over a 17-day storage period.
This value is determined from the equation of the regression line of
the graphed storage data, at the 17th day, for ambient storage of
samples collected at high relative humidity (Section 4.5.). The
recovery of the analyte from the collection medium during storage
must be 75% or greater.
1.2.6. Precision (analytical
procedure)
The pooled coefficient of variation obtained from
replicate determinations of analytical standards at 0.5, 1 and 2
times the target concentration is 0.018. (Section 4.6.)
1.2.7. Precision (overall procedure)
The precision
at the 95% confidence level for the 17-day ambient temperature
storage test is ±14.6% (Section 4.7.). This includes an additional
±5% for sampling error. The overall procedure must provide results
at the target concentration that are ±25% or better at the 95%
confidence level.
1.2.8. Reproducibility
Six samples
collected from a test atmosphere and a draft copy of this procedure
were given to a chemist with this evaluation. The samples were
analyzed after 59 days of storage at 5°C. No sample deviated from
its theoretical value by more than the precision reported in Section
1.2.7. (Section 4.8.)
1.3. Advantages
This
sampling method has a higher sampling capacity and results in improved
storage stability for acetone over the existing coconut shell charcoal
method.
1.4. Disadvantages
1.4.1. The Carbosieve S-III sampling tubes are
slightly more expensive than coconut shell charcoal sampling tubes.
1.4.2. The fine mesh size of Carbosieve S-III
(60/80) results in a greater pressure drop across the sample tube
than occurs with the conventional coconut shell charcoal sampling
tube. At a sampling rate of 0.2 L/min the pressure drop across the
tube is 10 in. of water.
2. Sampling Procedure
2.1. Apparatus
2.1.1. Samples are collected with a personal sampling pump that
can be calibrated to within ±5% of the recommended flow rate with
the sampling device attached.
2.1.2. Samples are collected
on 4-mm i.d. × 6-mm o.d. × 45-mm sampling tubes packed with two
sections of 60/80 mesh Carbosieve S-III (Supelco Inc.,
Bellefonte, PA). Empty, clean glass tubes are packed with 130 and 65
mg of adsorbent in the front and back sections respectively.
Silanized glass wool plugs are used in the middle and at both ends
of the tube to separate and contain the two sections. The sampling
tubes are sealed with 7/32-in. plastic caps.
2.1.3. Commercially produced sampling tubes are expected to
be available by the spring of 1988.
2.2. Reagents
No sampling reagents are required.
2.3. Sampling
technique
2.3.1. Attach the sampling tube to the sampling pump with
flexible, plastic tubing such that the large, front section of the
sampling tube is exposed directly to the atmosphere. Do not place
any tubing in front of the sampler. The sampler should be attached
vertically in the worker's breathing zone in such a manner that it
does not impede work performance or safety.
2.3.2. After
sampling for the appropriate time, remove the sampling device and
seal the tube with plastic end caps. Wrap the tube lengthwise with
an official OSHA seal (Form 21).
2.3.3. Submit at least one
blank with each set of samples. The blank should be handled in the
same manner as the other samples except that no air is drawn through
it.
2.3.4. List any potential interferences on the sample
data sheet.
2.4. Sampler capacity
The sampling
capacity of the front section of a Carbosieve S-III
sampling tube was determined by sampling a test atmosphere of 3920
mg/m3 (1650 ppm) acetone at ambient
temperature at both low (<5% R.H.), and at high relative humidity
(80% R.H.). The sampling rate was approximately 0.05 L/min. The 5%
breakthrough air volume was 4.6 L at 80% R.H., and 13.1 L at low
humidity (<5% R.H.). These are the air volumes sampled that result
in a concentration downstream from the sampling tube which is 5% of
the upstream concentration. (Section 4.10.)
2.5. Desorption
efficiency
2.5.1. No significant difference in desorption efficiency was
observed for acetone spiked onto "dry" or "wet" adsorbent when the
samples were desorbed as prescribed in the method using anhydrous
magnesium sulfate. The average desorption efficiency for acetone
from "dry" Carbosieve S-III over the range of 0.5 to
2.0 times the target concentration was 97.5%. The average desorption
efficiency from Carbosieve S-III which was first
conditioned with 3.0 L of 80% R.H. air prior to spiking with acetone
was 99.4% at the target concentration. Because these values do not
differ significantly, the desorption efficiency correction factor
determined from spiking dry Carbosieve S-III, 97.5%, is
used for this method.
The necessity of desorbing samples in
the presence of anhydrous magnesium sulfate is evidenced by the
desorption efficiency value for acetone from "wet" Carbosieve
S-III obtained without the addition of anhydrous
magnesium sulfate. The average desorption efficiency under these
conditions was only 88.0%. (Section 4.11.)
2.5.2. Desorbed
samples remain stable for at least 24 h. (Section 4.9.)
2.6. Recommended air volume and sampling rate
The
recommended air volume is 3 L and the recommended sampling rate is
0.05 L/min.
2.7. Interferences (sampling)
Substances
present in the work atmosphere which are capable of reacting with
acetone can affect the recovery. The presence of other solvents in the
work atmosphere will affect the capacity of the sampling medium for
acetone. Suspected interferences should be reported to the laboratory
with submitted samples.
2.8. Safety precaution (sampling)
2.8.1. The sampling equipment should be attached to the worker
in such a manner that it will not interfere with work performance or
safety.
2.8.2. All safety practices that apply to the work
area being sampled should be followed.
3.
Analytical Procedure
3.1. Apparatus
3.1.1. A GC equipped with an FID detector. A
Hewlett-Packard Model 5840A GC and a Varian Model 3400
GC were used in this evaluation. Both instruments were equipped with
autosamplers. A Spectra-Physics Model 4290 Integrator
(Spectra-Physics, San Jose, CA) was used to integrate
data from the Varian GC.
3.1.2. A GC column capable of
separating acetone from the solvent and from any interferences. A
10-ft × 1/8-in. stainless steel column packed with 20%
SP-2100/0.1% Carbowax 1500 on 100/120 Supelcoport
(Supelco Inc., Bellefonte, PA) was used with the HP Model 5840A GC.
A 60-m × 0.32-mm i.d. fused silica
capillary column, DX-4, 0.25-µm film
thickness (J & W Scientific, Folsom, CA), was used with the
Varian GC.
3.1.3. Autosampler vials with a minimum internal
volume of 1.8 mL. Glass crimp-top vials for use with
Hewlett-Packard autosamplers were used in this
evaluation.
3.1.4. Volumetric flasks, pipets, and syringes
for preparing desorbing solution and standards were used in this
evaluation.
3.1.5. A 1-mL dispenser for adding desorbing
solution to the sample vials was used in this evaluation.
3.2. Reagents
3.2.1. Reagent grade solvents or better were used in this
evaluation. Burdick and Jackson (Muskegon, MI) acetone and
dimethylformamide (DMF) were used.
3.2.2. Desorbing
solution. One percent DMF in carbon disulfide containing 1 µL/mL
ethylbenzene as an internal standard was used in this evaluation.
The DMF acts as a polar modifier to improve the recovery of polar
molecules.
3.2.3. Magnesium sulfate, anhydrous powder, for
use as a drying agent. Baker analyzed reagent (Baker Chemical Co.,
Phillipsburg, NJ).
3.3. Standard preparation
3.3.1. Prepare standards in the PEL range by spiking microliter
quantities of acetone from a microliter syringe directly into
autosampler vials which contain 1 mL of the desorbing solution. Seal
each vial with a crimp cap seal.
3.3.2. Prepare low level
standards by making serial dilutions of a higher standard into the
desorbing solution.
3.3.3. Prepare at least three standards
to generate a calibration curve. Ensure that the amount of acetone
found in the samples is within the range of the standards. Prepare
additional standards if necessary.
3.4. Sample
preparation
3.4.1. Remove the plastic caps from the sample tube and
carefully transfer each section of the adsorbent to separate
auto-sampler vials. Include the front glass wool plug
with the front adsorbent section and the middle glass wool plug with
the back sample section. Discard the rear glass wool plug.
3.4.2. Add approximately 100 mg of anhydrous magnesium
sulfate powder to each sample. The use of this drying agent
dramatically improves the recoveries of water soluble substances
which apparently partition in the water phase and result in low
recoveries (Ref. 5.7.). The desorption efficiency of acetone on
"wet" Carbosieve S-III at the target concentration is
88% without magnesium sulfate and 99% with magnesium sulfate added
(Section 4.11.).
3.4.3. Carefully add 1.0 mL of desorbing
solution to each vial and seal with a crimp top.
3.4.4.
Place the sample vials on a mechanical shaker and shake for 15 min
prior to analysis.
3.5. Analysis
3.5.1. GC Conditions (HP Model 5840A)
|
| column temperatures: |
60°C for 4 min, then program
to
150°C at 15°C/min, hold at
150°C for 4 min |
| injector temperature: |
200°C |
| detector temperature: |
220°C |
| carrier flow rate: |
25 mL/min (nitrogen) |
| detector gas flow rates: |
25 mL/min (hydrogen)
250 mL/min
(air) |
| injection volume: |
1.0 µL |
| GC column: |
10 ft × 1/8 in. stainless steel column
packed with 20% SP-2100/0.1% Carbowax 1500 on
100/120 Supelcoport |
| retention time: |
3.0 min |
| chromatogram: |
Figure
3.5.1. |
3.5.2. GC Conditions (Varian Model 3400):
| column temperatures: |
40°C for 4 min, then program
to
150°C at 20°C/min |
| injector temperature: |
175°C |
| detector temperature: |
200°C |
| carrier flow rate: |
2.2 mL/min (hydrogen) |
| Detector gas flow rates: |
30 mL/min (hydrogen)
300 mL/min
(air) |
| detector make-up gas: |
30 mL/min (nitrogen) |
| injection volume: |
1.0 µL |
| split ratio: |
20 to 1 |
| GC column: |
60-m × 0.32-mm i.d. fused
silica capillary column, DX-4,
0.25-µm film |
| retention time: |
2.67 min |
| chromatogram: |
Figure
3.5.2. |
|
3.5.3. Use a suitable method, such as electronic integration to
measure detector response. Prepare an internal standard procedure on
the integrator using ethylbenzene as the internal standard.
3.6. Interferences (analytical)
3.6.1. Ensure that potential interferences reported by the
industrial hygienist do not interfere with the analysis.
3.6.2. Modify GC parameters to circumvent these
interferences if possible.
3.6.3. Retention time on a single
column is not proof of chemical identity. GC/MS is a useful means of
structure determination. It is recommended that this procedure be
used to confirm samples whenever necessary.
3.7.
Calculations
3.7.1. Prepare a calibration curve by plotting concentration of
acetone determined versus actual concentration for each standard
value. A linear least squares fit is used to determine the
concentration of acetone in each sample. Use this curve to determine
the concentration of acetone in each sample.
3.7.2. If
acetone is detected in the back section, sum the concentrations of
the front and back sections and subtract any significant amounts
found in the blank from this total.
3.7.3. Calculate the air
concentration for each sample using the following equation:
mg/m3 =
(A)(B) / (C)(D) |
| where |
A = |
µg/L from 3.7.2. |
|
B = |
desorption volume (1 mL) |
|
C = |
liters of air sampled |
|
D = |
desorption efficiency
(97.5%) |
3.7.4.
Convert acetone results in mg/m3 to ppm
using the following equation:
ppm =
(mg/m3)(24.46) / (58.08)
| where |
mg/m3
= |
result from 3.7.3. |
|
24.46 = |
molar volume at 760 mm Hg and 25°C. |
|
58.08 = |
molecular weight of
acetone. |
|
3.8. Safety precautions (analytical)
3.8.1. Avoid skin contact and inhalation of all chemicals.
3.8.2. Restrict the use of all chemicals to a fume hood.
3.8.3. Wear safety glasses and a lab coat in all laboratory
areas.
4. Backup Data
4.1. Detection limit of the analytical procedure
The detection limit of the analytical procedure was 0.71
ng based on a 1-µL injection of a 14.1 ng/µL standard
with a 20 to 1 split ratio. This was the amount of acetone which gave
a peak that was readily detectable in the presence of the solvent. A
chromatogram of the detection limit of the analytical procedure is
shown in Figure
4.1.
4.2. Detection limit of the overall procedure
The detection limit of the overall procedure was determined by
analyzing the front sections of sample tubes placed in separate
autosampler vials and spiked with 14.1 µg of acetone (4 µL of 3532
µg/mL acetone in carbon disulfide). The samples were desorbed and
analyzed approximately 1 h after having been spiked. The injection
size recommended in the analytical procedure (1.0 µL) was used in the
determination of the detection limit of the overall procedure.
|
Table
4.2.
Detection Limit Data
|
sample
number |
amount expected
(µg) |
amount recovered
(µg) |
|
| 1 |
14.1 |
11.8 |
| 2 |
14.1 |
14.1 |
| 3 |
14.1 |
14.4 |
| 4 |
14.1 |
14.2 |
| 5 |
14.1 |
13.7 |
| 6 |
14.1 |
13.0 |
|
4.3. Reliable quantitation limit
The
reliable quantitation limit is equal to the overall detection limit.
This is the smallest amount of acetone which can be spiked onto the
sample tube and result in a recovery of at least 75% and a precision
(±1.96 SD) of 25% or better.
Table 4.3.
Reliable Quantitation Limit
Data
(Based on samples and data of Table 4.2.)
|
| sample no. |
% recovered |
statistics |
|
| 1 |
83.7 |
| 2 |
100.0 |
| 3 |
102.1 |
 = = |
96.0 |
| 4 |
100.7 |
SD = |
7.0 |
| 5 |
97.2 |
Precision = |
(1.96)(SD) |
| 6 |
92.2 |
Precision = |
13.9 |
|
4.4. Instrument
response to the analyte
The instrument response data reported
in this section was determined with the Varian Model 3400; however, a
linear response was observed with both instruments used in this
evaluation. Analytical conditions were as described in Section 3.5.2.
The data presented in Table 4.4. was determined from replicate
injections of acetone standards at the 0.5, 1, and 2 times the target
concentration. This data is presented graphically in Figure
4.4.
Table 4.4.
Acetone Response Data
|
× target conc.
µg/sample
ppm |
0.5×
3564
500 |
1×
7128
1000 |
2×
14256
2000 |
|
| area counts |
167215 |
325560 |
641727 |
|
169948 |
326024 |
644136 |
| 169919 |
324601 |
660824 |
| 168368 |
335219 |
661558 |
| 173239 |
331389 |
644165 |
| 176433 |
325590 |
673745 |
|
 |
170854 |
328064 |
654359 |
|
4.5. Storage
test
The stability of acetone collected on Carbosieve
S-III sample tubes from a 1000 ppm test atmosphere at
both low (5%) and high (80%) relative humidity was determined. Acetone
stability on coconut shell charcoal tubes (Lot 120, SKC Inc.,
Eighty-four, PA) was also evaluated at 80% R.H. Test
atmospheres were generated with a vapor generation system which
consisted of a source of clean, dry dilution air, a mixing chamber,
and a six port sampling manifold. The interior surfaces of the system
consisted entirely of glass and Teflon with the exception of rubber
O-rings at the valve positions. Acetone was metered into
the dilution stream with a Sage Instruments Inc. Model 355 syringe
pump (Orion Research Inc., Cambridge, MA) which had been
gravimetrically calibrated.
High humidity conditions were
prepared by passing the dilution air through a water bubbler before
combining it with acetone. For low humidity sampling, the water
bubbler was bypassed and the dry dilution air mixed directly with the
acetone vapor. Air flow was measured with rotameters and mass flow
meters which were calibrated with a Gilibrator bubble meter (Gilian
Instrument Corp., Wayne, NJ). The relative humidity was monitored with
a Model 911 Dew-All Digital Analyzer (EG&G, Waltham,
MA).
For each storage test a total of 36 samples were
collected under each set of conditions by sampling approximately 3 L
of air at a flow rate of approximately 0.05 L/min from the test
atmosphere. Six of these samples were analyzed on the day of
collection. The remaining 30 samples were split into two groups of
fifteen samples for storage. One group was stored in a laboratory
drawer at ambient temperature (21-23°C), and the other
group was stored in a refrigerator at 5°C. At three- or
four-day intervals, three samples were selected from each
group of storage samples for analysis. The percentage recovery with
time for each sample is reported in Tables 4.5.1. through 4.5.3. These
results are presented graphically in Figures 4.5.1.1.
through 4.5.3.2.
The reported recoveries are based on the theoretical concentration of
the acetone test atmosphere determined by gravimetric and volumetric
means. No desorption efficiency correction was applied to these
results.
Table 4.5.1.
Storage Data on Carbosieve
S-III (5% RH)
|
| storage time |
|
% recovery |
| (days) |
|
(ambient) |
|
(refrigerated) |
|
| 0 |
|
94.4 |
94.7 |
93.6 |
|
93.3 |
93.9 |
93.2 |
| 3 |
91.3 |
95.7 |
91.3 |
91.1 |
91.7 |
92.6 |
| 7 |
92.7 |
94.1 |
94.3 |
94.9 |
93.0 |
93.0 |
| 10 |
89.4 |
91.6 |
91.4 |
90.8 |
91.6 |
91.4 |
| 14 |
93.9 |
94.5 |
91.8 |
95.9 |
92.1 |
93.1 |
| 17 |
89.6 |
88.0 |
94.6 |
90.9 |
94.5 |
90.0 |
|
Table 4.5.2.
Storage Data on Carbosieve
S-III (80% RH)
|
| storage time |
|
% recovery |
| (days) |
|
(ambient) |
|
(refrigerated) |
|
| 0 |
|
101.3 |
104.4 |
107.5 |
|
110.0 |
107.2 |
103.5 |
| 3 |
92.8 |
100.4 |
102.7 |
94.7 |
104.5 |
101.9 |
| 7 |
88.1 |
88.2 |
90.9 |
98.7 |
99.6 |
97.5 |
| 10 |
80.9 |
96.9 |
88.7 |
97.0 |
91.4 |
99.9 |
| 14 |
91.6 |
100.3 |
86.9 |
78.4 |
94.0 |
94.2 |
| 17 |
98.9 |
82.8 |
86.6 |
96.2 |
92.8 |
86.0 |
|
Table 4.5.3.
Storage Data on Coconut Shell
Charcoal (80% RH)
|
| storage time |
|
% recovery |
| (days) |
|
(ambient) |
|
(refrigerated) |
|
| 0 |
|
100.0 |
96.2 |
98.1 |
|
96.8 |
96.2 |
95.9 |
| 3 |
77.3 |
73.4 |
76.1 |
96.9 |
97.8 |
85.7 |
| 7 |
70.9 |
79.0 |
74.1 |
89.9 |
88.1 |
85.7 |
| 10 |
66.3 |
69.5 |
70.4 |
85.8 |
86.4 |
90.4 |
| 14 |
55.2 |
59.5 |
72.6 |
79.8 |
89.9 |
84.5 |
| 17 |
52.5 |
55.3 |
56.6 |
83.1 |
83.7 |
80.9 |
|
4.6. Precision
(analytical method only)
The data reported in Table 4.4. were
used to calculate analytical precision.
Table 4.6.
Precision of the Analytical
Method
(Based on data of Table 4.4.)
|
× target
conc.
µg/sample
ppm |
0.5×
3564
500 |
1×
7128
10000 |
2×
14256
20000 |
|
| SD (area counts) |
3404 |
4261 |
12942 |
| CV |
0.020 |
0.013 |
0.020 |
|
 = 0.018 = 0.018 |
|
4.7.
Precision (overall procedure)
The precision of the overall
procedure is determined from the storage data. The determination of
the standard error of estimate (SEE) for a regression line plotted
through the graphed storage data allows the inclusion of storage time
as one of the factors affecting overall precision. The SEE is similar
to the standard deviation, except it is a measure of dispersion of
data about a regression line instead of about a mean. It is determined
with the following equation:

| where |
n
=
k =
k = |
total no. of data points
2 for
linear regression
3 for quadratic regression |
|
| Yobs
= |
observed % recovery at a given time |
| Yest
= |
estimated % recovery from the regression line
at the same given time |
An additional 5% for pump error is added to the SEE by
the addition of variances. The precision at the 95% confidence level
is obtained by multiplying the SEE (with pump error included) by 1.96
(the z-statistic from the standard normal distribution at
the 95% confidence level). The 95% confidence intervals are drawn
about their respective regression lines in the storage graphs. The 95%
confidence limits for this method are ±16% as shown in Figure
4.5.2.1. This value is determined from the ambient storage data
for samples collected at high relative humidity.
4.8. Reproducibility data
Reproducibility samples were prepared from test samples
collected from the vapor generation system. The samples and a draft
copy of this evaluation were given to a chemist unassociated with this
evaluation. The samples were analyzed after 59 days of storage at
refrigerated temperature. No sample deviated from its theoretical
value by more than the precision (±16.0%) for the method at the 95%
confidence level for the 17-day storage test (Section
4.5.).
Table 4.8.
Reproducibility
Results
|
sample
number |
µg
expected |
% of expected |
% deviation |
|
| 1 |
3297 |
105.9 |
+5.9 |
| 2 |
3401 |
105.2 |
+5.2 |
| 3 |
5085 |
106.4 |
+6.4 |
| 4 |
5220 |
115.8 |
+15.8 |
| 5 |
6783 |
95.0 |
-5.0 |
| 6 |
6892 |
107.9 |
+7.9 |
|
4.9. Stability
of desorbed samples
The stability of
desorbed samples was investigated by reanalyzing samples 24 h after
initial analysis. The sample vials were resealed with new septa and
reanalyzed with fresh standards. The average recovery, relative to the
average recovery of the original analysis, was 93.4%.
Table 4.9.
The Stability of Desorbed
Samples
|
sample
number |
initial
recovery
(percent) |
recovery after 24
h
(percent) |
percent
change |
|
| 1 |
101.5 |
89.0 |
-11.5 |
| 2 |
91.9 |
84.5 |
-7.5 |
| 3 |
82.1 |
76.3 |
-5.8 |
| 4 |
85.9 |
82.0 |
-3.9 |
| 5 |
97.8 |
91.2 |
-6.6 |
| 6 |
92.6 |
92.8 |
+0.2 |
|
 |
92.0 |
86.0 |
| SD |
7.2 |
6.2 |
|
4.10. Sampler
capacity
The capacity of Carbosieve
S-III for acetone was compared to the capacity of other
adsorbents by sampling from an atmosphere of 1650 ppm (3920
mg/m3) acetone. Sample capacity was
determined by sampling with the front section of an adsorbent tube at
a sampling rate of 0.05 L/min. Breakthrough was detected by monitoring
the concentration of acetone downstream from the sampling tube with a
gas chromatograph equipped with a gas sampling valve. The GC was
equipped with a 10-ft × 1/8-in. o.d.
stainless steel column packed with 10% SP-1000 on 80/100
mesh Supelcoport. The injector, oven, and detector temperatures were
150°C, 100°C, and 200°C respectively. Nitrogen carrier gas was 20
mL/min, hydrogen and air detector gases were 30 mL/min and 250 mL/min
respectively.
Five-percent breakthrough air volumes from the
1650 ppm acetone test atmosphere at both low and high relative
humidity are reported in Table 4.10.1. for a variety of adsorbents.
The 5% breakthrough air volumes for acetone on Carbosieve
S-III at high and low relative humidity are 4.6 and 13 L
respectively. Coconut shell charcoal has a lower capacity for acetone.
The 5% breakthrough air volumes for coconut shell charcoal at high and
low relative humidity are 2.4 and 4.5 L respectively.
Breakthrough air volumes for acetone and eight other solvents
were determined simultaneously at a sampling rate of 0.05 L/min with
both Carbosieve S-III and with coconut shell charcoal at
high relative humidity from a test atmosphere mixture and are reported
in Table 4.10.2. The total concentration of the mixture was 4420
mg/m3 of which the concentration of the
acetone component was 400 mg/m3 (170 ppm).
Using the chromatography conditions described above for acetone, all
nine components in the test atmosphere were resolved on the column and
their 5% breakthrough air volumes determined. The sampling capacity of
Carbosieve S-III for xylene, perchloroethlylene, toluene,
n-butanol, butyl acetate, and methyl isobutyl ketone is
approximately equal to or greater than that of coconut shell charcoal.
Carbosieve S-III has a higher sampling capacity for the
volatile solvents acetone, methylene chloride, and isopropanol.
Surprisingly, isophorone
(3,5,5-trimethyl-2-cyclohexene-1-one) did not collect on
Carbosieve S-III. This relatively
high-molecular-weight solvent was apparently excluded
from the micropores of Carbosieve S-III because of its
size and was therefore not collected.
Table 4.10.1.
Sampling capacity of Various
Adsorbents for Acetone
at a Concentration of 1650 ppm (3920
mg/m3)
|
adsorbent
(mass used) |
description |
%
relative
humidity |
5%
breakthrough
(L) |
|
| Purasieve (130 mg) |
Union Carbide, carbon-based polymer |
80 |
3.2 |
coconut shell
charcoal (100 mg) |
SKC Inc., lot 120 |
<5 |
4.5 |
coconut shell
charcoal (100 mg) |
SKC Inc., lot 120 |
80 |
2.4 |
petroleum base
charcoal (100 mg) |
SKC Inc., lot 104 |
80 |
1.7 |
Ambersorb XE-348
(130 mg) |
Rohm & Haas, carbon-based molecular
sieve |
80 |
2.9 |
Carboxen 564
(130 mg) |
Supelco Inc., carbon-based molecular sieve |
80 |
2.4 |
Carbosieve S-III
(130 mg) |
Supelco Inc., carbon-based molecular sieve |
<5 |
13 |
Carbosieve S-III
(130 mg) |
Supelco Inc., carbon-based molecular sieve |
80 |
4.6 |
|
Table 4.10.2.
Sampling Capacity
of
Carbosieve S-III (130 mg) and Coconut Shell
Charcoal
(100 mg) from Test Atmosphere Containing Nine Solvents
at 80% RH
|
|
|
air |
5% breakthrough
volume, (L) |
| solvent |
PEL
(ppm) |
concentration
(ppm) |
lot 120
charcoal |
Carbosieve
S-III |
|
| acetone |
1000 |
170 |
4.7 |
8.6 |
| isopropanol |
400 |
160 |
6.8 |
9.5 |
| methylene chloride |
500 |
190 |
3.0 |
4.6 |
| methyl isobutyl ketone |
100 |
85 |
10.2 |
10.4 |
| perchloroethylene |
100 |
120 |
10.2 |
12.7 |
| toluene |
200 |
120 |
10.3 |
13.0 |
| xylene |
100 |
100 |
21.5 |
>22.5 |
| butyl acetate |
150 |
100 |
14.8 |
12.9 |
| n-butanol |
100 |
140 |
10.6 |
11.1 |
|
4.11. Desorption
efficiency
The average desorption efficiency of acetone from
Carbosieve S-III evaluated at both low and high relative
humidity conditions was determined. To represent low humidity
conditions, the desorption efficiency of acetone on Carbosieve
S-III was determined with "dry" adsorbent at 0.5, 1, and
2 times the target concentration. Six samples were prepared at each
level and each 130-mg section of adsorbent was spiked
with either 4.5, 9.0, or 18.0 µL of acetone and allowed to sit for
approximately 1 h prior to desorption. The results for the "dry"
Carbosieve S-III are given in Table 4.11.1.
To
represent high humidity conditions, the desorption efficiency of "wet"
adsorbent was determined at the target concentration alone with
adsorbent which had been conditioned with approximately 3 L of 80%
R.H. prior to spiking with acetone. The average desorption
efficiencies of "wet" Carbosieve S-III desorbed with and
without 100-mg portions of magnesium sulfate are given in
Table 4.11.2. The necessity of using magnesium sulfate to desorb "wet"
adsorbent is indicated by the low desorption efficiency result (88.0%)
obtained by desorbing the samples without magnesium
sulfate.
Table 4.11.1.
Desorption Efficiency
of
Acetone on "Dry" Carbosieve S-III
|
× target conc.
µg/sample |
0.5×
3548 |
1×
7064 |
2×
14004 |
|
| desorption |
99.6 |
97.9 |
95.7 |
| efficiency, |
101.8 |
94.9 |
96.9 |
| % |
100.8 |
101.4 |
96.8 |
|
99.7 |
94.8 |
98.9 |
| 98.2 |
92.3 |
98.6 |
| 99.4 |
93.7 |
92.8 |
|
 |
99.9 |
95.8 |
96.6 |
| overall average =
97.5% |
|
Table 4.11.2.
Desorption Efficiency
of
Acetone1 from "Wet" Carbosieve
S-III
|
| magnesium sulfate |
absent |
present |
|
| desorption |
87.0 |
98.6 |
| efficiency, |
88.7 |
100.6 |
| % |
88.7 |
98.3 |
|
89.0 |
101.0 |
| 87.2 |
98.8 |
| 87.3 |
98.5 |
|
 |
88.0 |
99.3 |
|
| 1 at 1×
the target conc. (7064 µg) | |
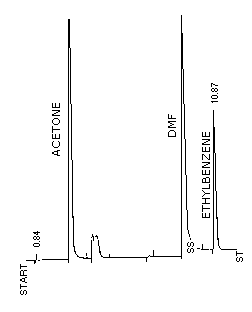
Figure 3.5.1. Chromatogram of acetone at the target
level on packed column.
Conditions are as described in Section
3.5.1.
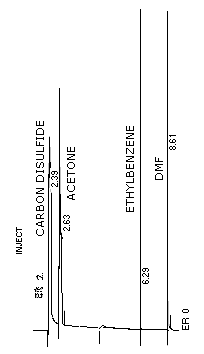
Figure 3.5.2. Chromatogram of acetone at the target level on a
capillary column.
Conditions are described in Section
3.5.2.
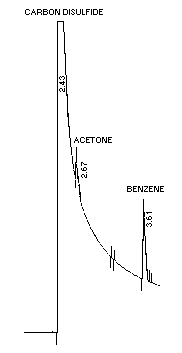
Figure 4.1. Chromatogram of acetone at the detection limit on a
capillary column.
Conditions are as described in Section
4.1.
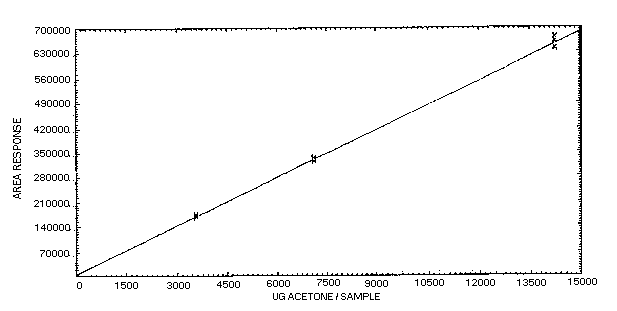
Figure 4.4.
Instrument response (FID) to acetone.
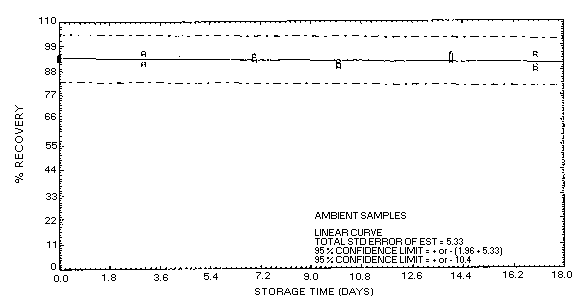
Figure
4.5.1.1. Acetone collected on Carbosieve S-III at 5% R.H. and
stored at ambient temperature.
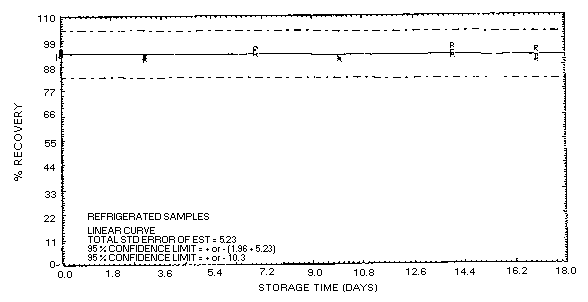
Figure 4.5.1.2. Acetone collected on Carbosieve
S-III at 5% R.H. and stored at refrigerated temperature.
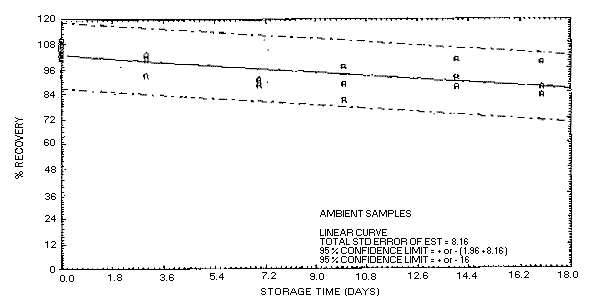
Figure
4.5.2.1. Acetone collected on Carbosieve S-III at 80% R.H.
and stored at ambient temperature.
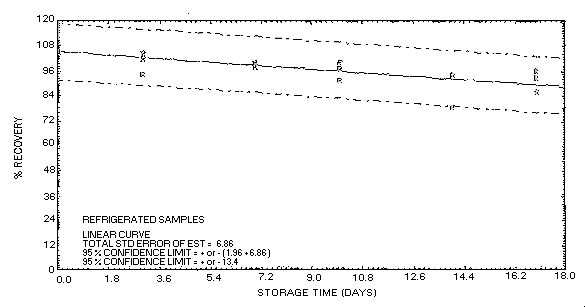
Figure 4.5.2.2. Acetone collected on Carbosieve
S-III at 80% R.H. and stored at refrigerated temperature.
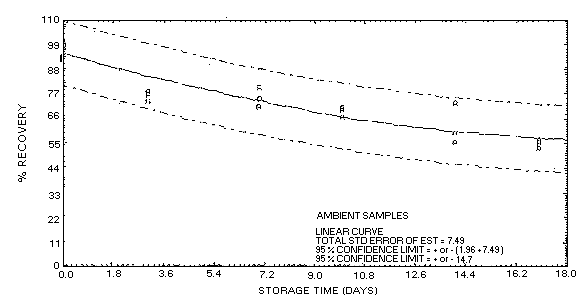
Figure
4.5.3.1. Acetone collected on coconut shell charcoal at 80% R.H. and
stored at ambient temperature.
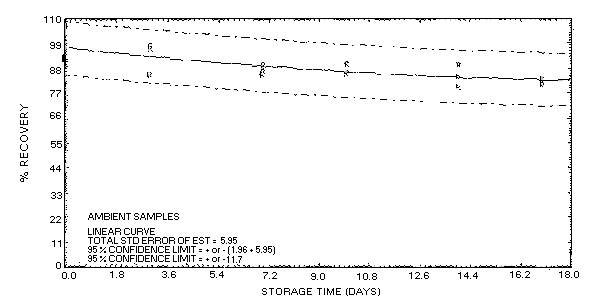
Figure
4.5.3.2. Acetone collected on coconut shell charcoal at 80% R.B. and
stored at refrigerated temperature.
|
5. References
5.1. "NIOSH Manual of Analytical Methods", 3rd ed.; U.S. Dept. of
Health and Human Services, Center for Disease Control, NIOSH;
Cincinnati, OH, 1984, Vol. 2, Method 1300, DHHS (NIOSH) Publ.
No. 84-100.
5.2. Levin, J.-O; Carleborg, L.
Ann. Occup. Hyg., 1987, 31, 31-38.
5.3. Rudling, J.; Bjorkholm, E. Ann. Occup. Hyg.,
1986, 30, 319-327.
5.4. Guenier,
J.P.; Muller, J. Ann. Occup. 1984, 28,
61-75.
5.5. Elskamp, C.J.; Schultz, G. Am.
Ind. Assoc. J., 1983, 44, 201-204.
5.6. "NIOSH Manual of Analytical Methods", 3rd ed.; U.S. Dept.
of Health and Human Services, Center for Disease Control, NIOSH;
Cincinnati, OH, 1984, Vol. 1, Method 2500, DHHS (NIOSH) Publ.
No. 84-lOO.
5.7. Rudling, J.; Bjorkholm, E.
Am. Ind. Hyg. Assoc. J., 1986, 47,
615-620.
5.8. Windholz, M., Ed. "Merck Index",
10th ed.; Merck & Co., Rahway, N.J., 1983; p. 10.
5.9. Nelson, D.L.; Webb, B.P. in "Kirk-Othmer Encyclopedia of
Chemical Technology"; 3rd ed.; Grayson, M., Ed.; John Wiley &
Sons, New York, 1978, pp. 179-191.
5.10.
Chem. & Eng. News; v. 65, April 13, 1987, p.
20-23. |
| |


