| Method no.: | 47 | ||
| Matrix: | Air | ||
| Target concentration: | 200 µg/m3 (20 ppb) (OSHA PEL) | ||
| Procedure: | Samples are collected by drawing a known volume of
air through a glass fiber filter coated with 1.0 mg of
| ||
| Recommended air volume and sampling rate: |
15 L at 1 L/min | ||
| Detection limit of the overall procedure: |
0.8 µg/m3 | ||
| Reliable quantitation limit: | 2.6 µg/m3 | ||
| Standard error of estimate at the target concentration: (Section 4.7.) |
6.2% | ||
| Special requirements: | If the coated glass fiber filters are to be stored for any length of time before sampling, they should be kept in a refrigerator. | ||
| Status of method: | Evaluated method. This method has been subjected to the established evaluation procedures of the Organic Methods Evaluation Branch. | ||
|
Chemist: Donald Burright | ||
OSHA Analytical Laboratory
Salt Lake City, Utah
1. General Discussion
- 1.1. Background
- 1.1.1. History
Two of the earliest procedures to determine atmospheric
diisocyanate concentrations were developed by Ranta and Marcali
(Ref. 5.1.).
Both of these procedures are inconvenient as they use a bubbler for
sampling and their colorimetric analyses are
1) The high boiling liquid is retained on a glass fiber filter.
2) Aromatic diisocyanates react rapidly and exothermically with
3) The derivative has a higher molar absorptivity in the UV region than the one formed with nitro reagent (Ref. 5.5.).
Additional work was performed on this procedure as a result of
changes made in Title 29 CFR 1910.1000, Table
1.1.2. Toxic effects (This section is for information only and should not be taken as a basis for OSHA policy.)
MDI vapor is a potent respiratory sensitizer. It also is a strong irritant of the eyes, mucous membranes, and skin and can cause pulmonary edema. Exposure of humans to high concentrations causes cough, dyspnea, increased secretions, and chest pains. MDI and other diisocyanates cause pulmonary sensitization in susceptible individuals; should this occur, further exposure should be avoided, since extremely low levels of exposure may trigger an asthmatic episode; cross sensitization to unrelated materials probably does not occur. The liquid in contact with the eyes may cause irritation (Ref. 5.8.).
1.1.3. Operations where exposure may occur
The manufacture of polyurethane foams, coatings and elastomers potentially expose approximately 100,000 workers to diisocyanates. MDI is used in the manufacture of rigid foams, fire retardants, coated fabrics, automobile bumper components, and hundreds of other applications. Over 300 million pounds of MDI were produced in 1975 (Ref. 5.2.). Workers using polymethylene polyphenyl isocyanate (PAPI) (which is a polymer of MDI) may also be exposed to MDI because PAPI can contain up to 30% MDI.
1.1.4. Physical properties
| CAS no.: | 101-68-8 |
| MW: | 250.26 |
| bp: | 314°C at 760 mm Hg |
| mp: | 38°C |
| Sp gr: | 1.23 at 25°C |
| vp: | 0.000005 mm Hg at 25°C |
| color: | white to pale yellow |
| odor: | none |
| flash point: (closed cup) |
200°C |
| synonyms: | |
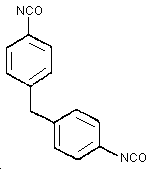
| structure: | Figure 1.1.4. |
1.2. Limit defining parameters (The analyte air concentrations listed throughout this method are based on an air volume of 15 L and a solvent extraction volume of 4 mL.)
- 1.2.1. Detection limit of the analytical procedure
The detection limit of the analytical procedure is 0.06 ng per injection of MDI (derivatized) with the fluorescence detector. This is the amount of analyte which will give a peak whose height is about 5 times the height of the baseline noise. (Section 4.1.)
1.2.2. Detection limit of the overall procedure
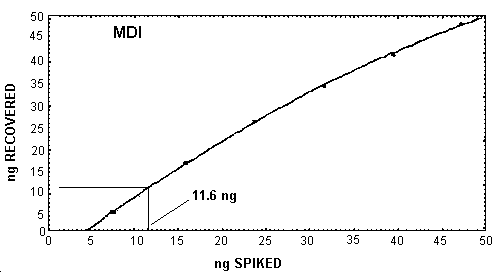
The detection limit of the overall procedure is 12 ng per sample (0.8 µg/m3). This is the amount of MDI (derivatized) spiked on the sampling device which allows recovery of an amount of analyte equivalent to the detection limit of the analytical procedure. (Section 4.2.)
1.2.3. Reliable quantitation limit
The reliable quantitation limit is 39.5 ng per sample (2.6 µg/m3). This is the smallest amount of MDI (derivatized) which can be quantitated within the requirements of a recovery of at least 75% and a precision (±1.96 SD) of ±25% or better. (Section 4.3.)
The reliable quantitation limit and detection limits reported in the method are based upon optimization of the instrument for the smallest possible amount of analyte. When the target concentration of an analyte is exceptionally higher than these limits, they may not be attainable at the routine operating parameters.
- 1.2.4. Sensitivity
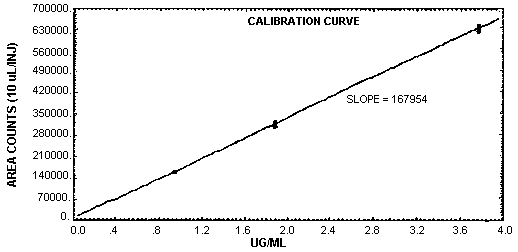
The sensitivity of the analytical procedure over a concentration range representing 0.5 to 2 times the target concentration based on the recommended air volume is 168000 area units per µg/mL. This is determined by the slope of the calibration curve. (Section 4.4.) The sensitivity will vary with the particular instrument used in the analysis.
1.2.5. Recovery
The recovery of MDI derivative from samples used in a
1.2.6. Precision (analytical method only)
The pooled coefficient of variation obtained from replicate determinations of analytical standards at 0.5, 1, and 2 times the target concentration is 0.013. (Section 4.4.)
1.2.7. Precision (overall procedure)
The precision at the 95% confidence level for the
1.2.8. Reproducibility
Six samples, spiked by liquid injection, and a draft copy of this
procedure were given to a chemist unassociated with this evaluation.
The samples were analyzed after three days of storage at
1.3. Advantages
- 1.3.1. The analytical procedure is specific and sensitive for
MDI. (Ref. 5.7.)
1.3.2. The collection system is less cumbersome than the use of a bubbler.
1.3.3.
1.4. Disadvantage
Glass fiber filters coated with
2. Sampling Procedure
- 2.1. Apparatus
- 2.1.1. Samples are collected by use of a personal sampling pump
that can be calibrated to within ±5% of the recommended flow rate
with the sampling device in line.
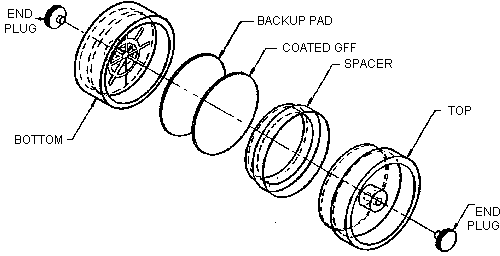
2.1.2. A
2.1.3. Coated filters should be stored in a closed jar at reduced
temperature as a precaution to prevent decomposition of the
2.2. Reagents
No sampling reagents are required.
2.3. Sampling technique
- 2.3.1. Open-face sampling is performed by removing the top cover
from the
2.3.2. Attach the cassette to the sampling pump with flexible tubing and place the cassette in the breathing zone of the employee to be monitored.
2.3.3. The recommended air volume and flow rate is 15 L at 1
L/min. Valid analytical results can be obtained for MDI when it is
collected simultaneously with
2.3.4. After sampling for the appropriate time, remove the sampling device and replace the small plug and top cover.
2.3.5. Wrap each sample
2.3.6. With each set of samples, submit at least one blank sample. The blank should be handled the same as the samples except that no air is drawn through it.
2.3.7. Bulk samples submitted for analysis must be shipped in sealed vials and in a separate container from air samples.
2.4. Retention efficiency
- 2.4.1. Experimental design
Due to present laboratory limitations, controlled test atmospheres of MDI cannot effectively be generated. Because MDI has a tendency to polymerize, the derivative of MDI was liquid spiked onto coated filters for this test. An amount of MDI derivative equivalent to 4.3 µg of MDI was spiked onto the filter and 20 L of humid air were pulled through the sampling cassette. Retention efficiency was defined as the percent of the analyte remaining on the coated filter after air had been pulled through the cassette.
2.4.2. Retention results
The retention efficiency of MDI derivative was found to be 97%
after 20 L of air at about 80% relative humidity and
2.5. Extraction efficiency
The average extraction efficiency for MDI derivative from filters spiked at the target concentration was 96.3%. (Section 4.6.)
2.6. Recommended air volume and sampling rate
- 2.6.1. The recommended air volume is 15 L.
2.6.2. The recommended air sampling rate is 1 L/min.
2.7. Interferences (sampling)
Any compound that could react with the
2.8. Safety precautions (sampling)
The sampling equipment should be attached to the worker in such a manner that it will not interfere with work performance or safety.
3. Analytical Procedure
- 3.1. Apparatus
- 3.1.1. High performance liquid chromatograph equipped with UV or
fluorescence detector, manual or automatic sample injector, and
chart recorder.
3.1.2. HPLC column capable of separating MDI from any
interferences. The columns employed in this study were a
3.1.3. An electronic integrator, or some other suitable method of determining peak areas.
3.1.4. Vials,
3.1.5. Volumetric flasks, pipets and syringes for preparing standards, making dilutions and making injections.
3.1.6. Suitable glassware for preparation of MDI urea derivative.
3.1.7. pH Meter for adjusting the mobile phase.
3.2. Reagents
- 3.2.1. Methylene chloride, hexane, acetonitrile, and dimethyl
sulfoxide, HPLC grade.
3.2.2. Water, HPLC grade. A commercially available filtration system was used to prepare of HPLC grade water.
3.2.3. 1-(2-Pyridyl)piperazine (
3.2.4. MDI, Eastman.
3.2.5. Ammonium acetate, HPLC grade.
3.2.6. Glacial acetic acid.
3.3. Standard preparation
- 3.3.1. A solution containing 0.5 g of recrystalized MDI in 25 mL
of methylene chloride is slowly added to a stirred solution of 0.7 g
of
3.3.2. Preparation of working standards
A stock standard solution is prepared by dissolving the MDI derivative into DMSO. To express the derivative as free MDI, the amount of MDI urea weighed is multiplied by the conversion factor 0.4339.
| MW MDI
MW MDI urea |
= | 250.26
576.71 |
= 0.4339 |
All dilutions of the stock solutions are made with ACN to arrive at the working range.
3.4. Sample preparation
- 3.4.1. The styrene cassette is opened and the glass fiber filter
is placed in a
3.4.2. Four milliliters of the extracting solution, 90/10 (v/v) ACN/DMSO, are added.
3.4.3. A cap equipped with a Teflon liner is installed.
3.4.4. The vial is shaken to remove large air bubbles from between the filter and the glass. Let the vial sit for 1 h.
3.5. Analysis
- 3.5.1. Reverse phase HPLC conditions
| column: | 25-cm × |
| mobile phase: | 0.01 M ammonium acetate in 50/50 (v/v) ACN/water adjusted to pH 6 with acetic acid |
| flow rate: | 1-1.5 mL/min |
| UV detector: | 254 nm and 313 nm |
| fluorescence | |
| detector: | 240 nm excitation 370 nm emission |
| injection size: | 10 - 25 µL |
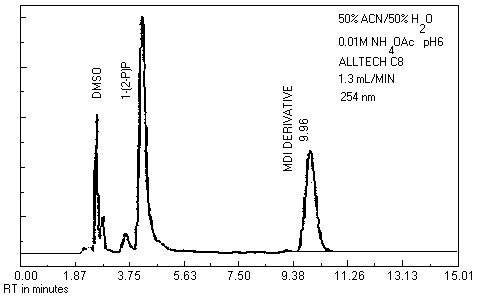
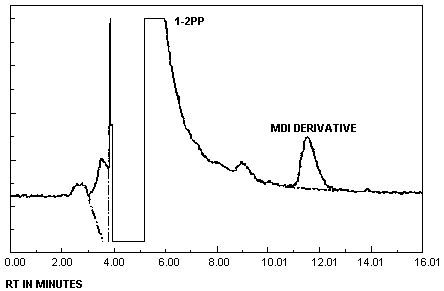
| chromatogram: | Figure 3.5.1. |
3.5.2. Alternate conditions
| column: | 25-cm × |
| mobile phase: | 0.01 M ammonium acetate in 37.5/62.5 (v/v) ACN/water adjusted to pH 6 with acetic acid |
| flow rate: | 2.0 mL/min |
| detectors: | same as above |
| injection size: | same as above |
3.5.3. An external standard procedure is used to prepare a calibration curve using at least two stock solutions from which dilutions are made. The calibration curve is prepared daily. The samples are bracketed with analytical standards.
3.6. Interferences (analytical)
- 3.6.1. Any compound having the same retention time as MDI
derivative is a possible interference. Generally, chromatographic
conditions can be altered to separate an interference.
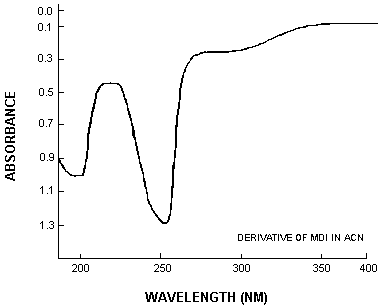
3.6.2. Retention time on a single column is not proof of chemical identity. Analysis by an alternate column system, absorbance response ratioing, and mass spectrometry are additional means of identity. (See UV spectrum for MDI derivative. Figure 4.10.)
3.7. Calculations
The concentration in µg/mL of MDI present in a sample is determined from the area response of the analyte as measured by an electronic integrator or peak heights. Comparison of sample response with a least squares curve fit for standards allows the analyst to determine the concentration of MDI in µg/mL for the sample. Since the sample volume is 4 mL, the results in µg/m3 of air are expressed by the following equation:
3.8. Safety precautions (analytical)
- 3.8.1. Avoid skin contact with all solvents.
3.8.2. Wear safety glasses at all times.
3.8.3. Avoid exposure to the MDI standards.
4. Backup Data
- 4.1. Detection limit of the analytical
procedure
The detection limit of the analytical procedure was 0.06 ng. This
amount produced a peak whose height was about 5 times the height of
the baseline noise. The injection size recommended in the analytical
procedure
4.2. Detection limit of the overall procedure
The detection limit of the overall procedure was extrapolated to be
11.6 ng/sample for MDI or 27 ng/sample for MDI derivative. The
equivalent air concentration was 0.8 µg/m3
for MDI. The injection size recommended in the analytical procedure
MDI Recoveries Near the Detection Limit
|
| |
| ng spiked | ng recovered |
|
| |
| 7.9 15.8 23.7 31.6 39.5 47.2 |
4.6 15.7 25.4 33.6 40.8 47.9 |
|
| |
4.3. Reliable quantitation limit
The reliable quantitation limit was determined by liquid spiking
nine coated glass fiber filters with 39.5 ng of MDI (91 ng of MDI
derivative). The samples had 15 L of humid air pulled through them and
were extracted in 4 mL of extracting solution. The injection size
recommended in the analytical procedure
Extraction Efficiency at
the Reliable Quantitation Limit
|
| ||||
| % recovery | statistics | |||
|
| ||||
| 104.2 103.5 102.1 100.7 102.8 106.9 106.3 107.6 106.9 |
| |||
|
| ||||
4.4. Sensitivity and precision (analytical method only)
The following data were obtained from multiple injection of analytical standards. The data are also presented graphically in Figure 4.4. The pooled coefficient of variation for MDI was 0.0127. The sensitivity for MDI was 168000 area counts per µg/mL.
MDI Derivative Sensitivity and Precision Data
|
| |||
| × target conc. µg/mL |
0.5× 0.94 |
1× 1.88 |
2× 3.76 |
|
| |||
| area counts | 164699 165739 163344 162985 164890 164337 |
322969 314200 313084 318490 317277 318009 |
631877 633893 644331 644743 627083 642001 |
SD CV |
164332.7 1021.4 0.0062 |
319004.8 5624.6 0.0176 |
637321.3 7380.1 0.0116 |
|
| |||
4.5. Retention efficiency
- 4.5.1. Retention efficiency for a ceiling sample
Retention efficiency samples were generated by liquid spiking 9.9 µg of MDI derivative on each of six coated glass fiber filters. The filters then had 20 L of air (at approximately 80% relative humidity) pulled through them.
Retention of MDI Derivative
|
| ||||
| % recovery | statistics | |||
|
| ||||
| 95.7 96.8 97.2 98.4 98.8 97.5 |
| |||
|
| ||||
4.5.2. Retention efficiency for a TWA sample
The following data are presented to show that 12.3 µg of MDI derivative, liquid spiked, onto the glass fiber filter is retained after 240 L of humid air is drawn through the sampler at 1 L/min.
Retention of MDI Derivative
|
| ||||
| % recovery | statistics | |||
|
| ||||
| 104.8 103.9 104.3 103.7 102.9 103.3 |
| |||
|
| ||||
4.6. Extraction efficiency
The following data represent the analysis of 14 coated glass fiber filters liquid spiked with MDI derivative.
Extraction Efficiency of MDI Derivative
|
| ||
| × target conc. µg/mL |
0.5× 0.38 |
1× 7.05 |
|
| ||
| % recovered | 98.8 100.3 95.9 95.9 97.4 95.9 91.5 |
96.5 98.9 92.5 98.2 94.7 96.2 100.7 |
| 96.5 | 96.3 | |
|
| ||
4.7. Storage data
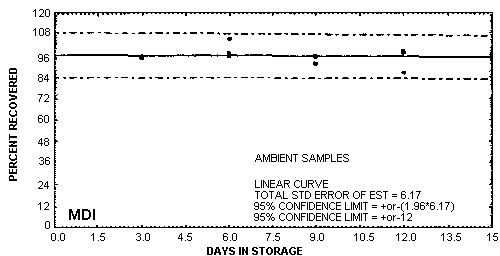
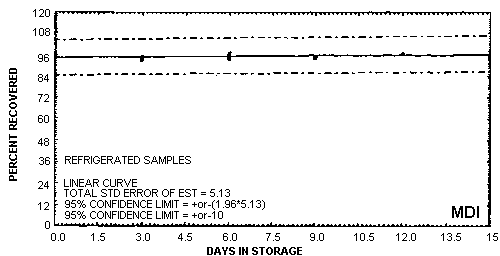
Storage samples were generated by liquid spiking 6.94 µg of MDI derivative on coated glass fiber filters. The filters then had 15 L of air (at approximately 80% relative humidity) pulled through them. For the set of 33 samples, three samples were analyzed immediately after generation, fifteen were stored in a freezer at -20°C and fifteen were stored in a closed drawer at ambient temperature. The results of recovery versus storage time are given below and shown graphically in Figures 4.7.1. and 4.7.2.
Storage Tests
|
| ||||||
| storage time (days) |
%
recovery (refrigerated, -20°C) |
% recovery (ambient, | ||||
|
| ||||||
| 0 3 6 9 12 15 |
94.5 93.4 95.4 95.1 97.0 98.6 |
95.6 95.1 97.3 95.8 ---- 97.6 |
95.1 94.8 94.1 94.4 ---- 94.8 |
94.5 95.4 95.2 91.4 97.9 93.5 |
95.6 94.7 104.9 94.8 86.1 96.7 |
95.1 94.5 97.1 95.3 97.7 94.5 |
|
| ||||||
4.8. Reproducibility data
Six samples, liquid spiked with 6.78 µg of MDI derivative, had 15 L of humid air drawn through them. The cassettes were given to a chemist unassociated with this work. The samples were analyzed after 3 days storage at ambient temperature. The results are corrected for extraction efficiency.
Reproducibility Results
|
| ||||
| % recovery | statistics | |||
|
| ||||
| 105.4 106.5 107.6 112.9 108.6 99.1 |
| |||
|
| ||||
4.9. Thermostability
The data presented in this section were collected to test the ability of the derivative of MDI to withstand thermal decomposition. Glass fiber filters were spiked with 6.94 µg of MDI derivative and then heated for 7.5 to 8 h, cooled to room temperature and analyzed. The MDI derivative is not significantly affected by temperatures below 105°C.
Thermostability
|
| |||||
| °C | °F | % recovered | |||
|
| |||||
| 40 63 90 105 125 |
104 145 194 221 257 |
93.4 93.3 83.9 92.3 55.8 |
92.8 95.1 90.4 91.3 81.7 |
94.2 93.8 86.9 92.3 65.5 | |
|
| |||||
4.10. UV Spectra
Figure 4.10.
is the UV Spectra of the
| CAS Number | Name |
| 72375-24-7 | |
4.11. Revision of filter coating procedure
The procedure for coating the glass fiber filters with
Comparison of Sampling
and Analysis Methods
for MDI vapors in Air1
|
| ||||||||
| 0.1 mg
|
1.0 mg
|
2.5 mg N.R. | 7.4 mg S.A. | |||||
| sample no. |
flow L/min |
ppb MDI |
flow L/min |
ppb MDI |
flow L/min |
ppb MDI |
flow L/min |
ppb MDI |
|
| ||||||||
| 1 2 3 4 5 |
1.0 0.85 0.87 2.2 0.87 |
6 10 4.2 0.4 1.7 |
0.85 0.85 1.1 2.0 2.2 |
17.6 15.3 7.6 4.0 1.7 |
2.0 2.0 2.0 0.87 2.0 |
13.7 19.3 7.7 4.9 1.6 |
1.9 1.9 2.2 1.1 1.1 |
20.5 17.9 7.3 5.9 3.2 |
|
| ||||||||
| 1 Data supplied by Mobay Chemical Corporation | ||||||||
5. References
- 5.1. "Criteria for a Recommended
Standard...Occupational Exposure to Toluene Diisocyanate", Department
of Health, Education and Welfare, National Institute for Occupational
Safety and Health: Cincinnati, OH, 1973; H/MS 73-11022.
5.2. "Criteria for a Recommended Standard...Occupational Exposure to Diisocyanates"; Department of Health, Education and Welfare, National Institute for Occupational Safety and Health: Cincinnati, OH, 1978; DHEW (NIOSH) Publ. (U.S.), No. 78-215.
5.3. Kormos, L.H.; Sandridge, R.L.; Keller, Anal. Chem. 1981, 53, 1125.
5.4. Sango, C.; Zimerson, E. J. Liq. Chromatog. 1980, 3, 971.
5.5. Hardy, H.L.; Walker, R.F. Analyst 1979, 104, 890.
5.6. Ellwood, P.A., Hardy, H.L.; Walker, R.F. Analyst 1981, 106, 85.
5.7. Goldberg, P.A.; Walker, R.F.; Ellwood, P.A.; Hardy, H.L. J. Chromatogr. 1981, 212, 93.
5.8. "Occupational Health Guidelines for Chemical Hazards" NIOSH/OSHA, Jan. 1981, DHHS(NIOSH) Publication No.81-123.
5.9. Dharmarajan V. Mobay Chemical Corporation, 1985, written communication.
