VOLATILE NITROSAMINE MIXTURE I
N-NITROSODIMETHYLAMINE (NDMA) N-NITROSODIETHYLAMINE (NDEA) N-NITROSODI-n-PROPYLAMINE (NDPA) N-NITROSODI-n-BUTYLAMINE (NDBA) N-NITROSOPIPERIDINE (NPIP) N-NITROSOPYRROLIDINE (NPYR) N-NITROSOMORPHOLINE (NMOR)
| Method no.: | 27 |
| OSHA PEL: | The OSHA standard applies to all solid or liquid mixtures containing more than 1% NDMA by weight or volume. |
| Procedure: | Samples are collected using ThermoSorb/N air samplers. The samples are desorbed with a 75/25 (v/v) dichloromethane/methanol solution. Analysis is performed by gas chromatography with Thermal Energy Analyzer detection. |
| Recommended air volume and sampling rate: |
75 L at 1 L/min (0.2 to 2 L/min is permissible). |
| Special requirements: | It is recommended that samples be stored in a freezer. |
| Status of method: | A sampling and analytical method that has been subjected to the established procedures of the Organic Methods Evaluation Branch. |
| Date: February 1981 | Chemist: Warren Hendricks |
OSHA Analytical Laboratory
Salt Lake City, Utah
|
| ||||||||
| analyte | NDMA | NDEA | NDPA | DNBA | NPIP | NPYR | NMOR | |
|
| ||||||||
| target concentration reliable quantitation limit |
ppb µg/m3 ppb µg/m3 |
0.89 2.7 0.043 0.13 |
0.65 2.7 0.031 0.13 |
0.51 2.7 0.024 0.13 |
0.37 2.4 0.019 0.12 |
0.51 2.4 0.026 0.12 |
0.66 2.7 0.032 0.13 |
0.84 4.0 0.042 0.20 |
| standard error of estimate at target concentration, (Section 4.7.) | ||||||||
| % | 5.81 | 6.24 | 6.22 | 6.26 | 5.74 | 5.86 | 6.28 | |
|
All values based on the recommended air volume. | ||||||||
1. General
- 1.1. Background
- 1.1.1. History
The purpose of this work was to develop a general sampling and
analytical procedure for volatile
Volatile
Many of these air sampling techniques have serious deficiencies.
The cold traps are difficult to maintain and are reported to enable
the artifactual formation of NDMA from precursor amines and nitrogen
oxides (Ref.
5.10.). The ambient temperature KOH and ascorbic acid bubblers
are free of artifact formation but analyte retention efficiency
decreases with increasing sampling time and temperature (Ref.
5.9.). Tenax GC has a relatively low breakthrough volume for
NDMA (Ref.
5.9.). Solid adsorbents, in general, may concentrate precursor
amines and nitrosating agents resulting in artifactual in situ
formation of the analyte (Ref.
5.9.). The vitamin E and C treated Florisil adsorbent tubes were
shown to be artifact resistant, but no one device was adequate for
use as a
Because of the many problems associated with alternative air sampling techniques, it was decided to evaluate the ThermoSorb/N air sampling system. The device is a commercially available opaque plastic cartridge containing a solid adsorbent. The manufacturer states that the device is designed to prevent the artifactual formation of the analytes because of a proprietary amine trap and nitrosation inhibitor.
Almost all analytical methods for
Thin layer chromatographic (TLC) techniques have been used to
determine
High performance liquid chromatographic (HPLC) techniques have
been used to determine complex mixtures of
The most widely used technique to separate complex mixtures of
volatile
Most of the commonly available GC detectors have been used to
determine
The Hall detector is very similar in principle to the Coulson
detector. In the normal operation of these detectors, the GC column
effluent is mixed with hydrogen gas and passed through a heated
quartz reaction tube containing a nickel catalyst. The nitrogen
containing analyte is reduced to ammonia which is measured by a
change in the conductivity of water in the detector cell. Acidic
interferences are removed with a scrubber. The catalyst is removed
to modify the detectors and the modified detectors respond only to
Since mass spectrometry provides an unequivocal means to confirm
chemical structure, it has been used as a GC detector in the
determination of complex mixtures containing
The Thermal Energy Analyzer (TEA) is a highly selective detector
for
This method recommends separation by GC and detection with the TEA. An HPLC method is also presented for use as a confirmatory procedure.
1.1.2. Toxic effects (This section is for information only and should not be taken as the basis of OSHA policy).
Detailed toxicology information regarding chronic exposure to the individual analytes is presented in Section 4.8. Much of the toxicology data regarding the analytes have been obtained using rats as the test species and that work is presented in this method. Some of the analytes have been investigated using other species and similar toxic effects have been observed.
The effects of acute exposure to each of the analytes were similar. The administration of a lethal dose to rats led to a gradually advancing weakened, emaciated condition frequently with the appearance of jaundice. Death usually occurred within seven days. The autopsy revealed severe centrilobular liver damage with hemorrhaging into the lungs in most cases. The response to a lethal dose was the same for male and female rats (Ref. 5.12).
Chronic exposure to the analytes has led to cancer in a number of different animal species (Ref. 5.15). The carcinogenic potential of the analytes varies over a wide range and depends on the compound, route of administration, level of dose, frequency of dose and length of the exposure.
N-nitrosodialkylamines do not appear to be directly active
carcinogens. If the compounds were directly active, local sarcomas
should be observed at the site of subcutaneous injection because of
the high concentration of the agent and sensitivity of the
subcutaneous tissue. If, however, local sarcomas do not develop and
tumors in distant organs are observed, the agent is an intermediate
from which the ultimate carcinogen is produced by metabolic
processes. Subcutaneous injection of
The carcinogenic effects of dialkylnitrosamines on the molecular
level, is thought to be the result of an alkylation of nucleic
acids. The metabolic activation of a
The mechanism by which the cyclic
In addition to carcinogenic activity, the analytes all have
mutagenic effects. In early studies,
All seven of the
The International Agency for Research on Cancer, (IARC) recommends that all seven of the analytes should be treated as if they were carcinogenic to humans (Ref. 5.14).
1.1.3. Exposure
NDMA has been employed as an industrial solvent and in the
synthesis of the rocket fuel
Patents exist for the use of NMOR as a solvent for polyacrylonitrile and as a intermediate for the synthesis of N-aminomorpholine. NMOR has been found to be an effective agent to combat microbial infections (Ref. 5.14). The use of NDMA was discontinued in 1976 and, at present, there is no evidence that any of the analytes are intentionally produced for other than research purposes (Ref. 5.14.).
Some of the analytes have been determined to be present in beers (Ref. 5.22), whiskeys (Ref. 5.23), tobacco (Ref. 5.24), tobacco smoke (Ref. 5.24), herbicides (Ref. 5.25), deionized water (Ref. 5.26), free amines (Ref. 5.27.), corrosion inhibitors (Ref. 5.28.), diesel engine crankcase emissions (Ref. 5.29.) and new car interiors (Ref. 5.30.).
Industries in which some of the analytes have been detected include iron foundries (Ref. 5.30.), leather tanneries (Ref. 5.31.), rubber producing factories (Ref. 5.32.) and rubber products manufacturing plants (Ref. 5.32.).
N-nitrosamines are extensively used in cancer research facilities. Human exposure can occur when the unchanged agents are excreted by the laboratory animals.
Non-occupational sources of exposure to the analytes are the
endogenous formation of the agents in the human gastrointestinal
tract. Precursor amines have been shown to react with nitrite to
form the corresponding
The size of the work population that is exposed is unknown. Since amines and suitable nitrosating species are ubiquitous the number of potential exposures seems large (Ref. 5.43.).
Because the analytes are such powerful animal carcinogens, they
are probably not used to any great degree by U.S. industry today.
Most occupational exposure to the analytes is probably the result of
the unintentional formation of the agent from precursor amines and
suitable nitrosating species. The amino group can be primary,
secondary or tertiary (Ref.
5.36.). The amine can be free or a portion of a more complex
molecule such as a drug or a herbicide. Amines can be nitrosated in
air (Ref.
5.34.) or in solution under acidic, neutral or alkaline
conditions (Ref.
5.36.). The nitrosation reaction is catalyzed by thiocyanate,
halide ions, metal ions, formaldehyde and ozone (Refs. 5.35.
and 5.36.).
Suitable nitrosating species include nitrogen oxides (NO,
NO2,
N2O3,
N2O4), nitrite
and nitrous acid (Ref.
5.36.). Nitrosation can occur as a result of transnitrosation.
This is a chemical reaction in which a
1.1.4. Physical properties
The following data were taken from Refs. 5.13. and 5.44.
|
| |||||
| analyte | NDMA | NDEA | NDPA | NPIP | |
|
| |||||
| CAS no.: molecular weight: boiling point, °C/mm Hg: density, g/mL: refractive index: physical appearance: |
62-75-9 74.08 154/760 1.0059 1.4358 yellow liquid |
55-18-5 102.14 176.9/760 0.9422 1.4386 yellow liquid |
621-24-7 130.19 206/760 0.9163 1.4437 yellow liquid |
100-75-4 114.15 217/721 1.0631 1.4933 yellow liquid | |
| solubility UV absorption |
water: alcohol: ether: l max, nm: log e: l max, nm: log e: l max, nm: log e: |
v. sol. v. sol. v. sol. 231 3.85 346 2.00 |
v. sol. v. sol. v. sol. 231 3.7 350 1.95 |
sol. miscible miscible 233 3.85 350 1.95 |
sol. 354 1.91 366 2.04 377 2.00 |
|
| |||||
The following data were taken from Refs. 5.13. and 5.14.
|
| ||||
| analyte | NDBA | NPYR | NMOR | |
|
| ||||
| CAS no.: molecular weight: boiling point, °C/mm Hg: density, g/mL (20//4): refractive index: melting point, °C: physical appearance: |
924-16-3 158.2 116/14 0.9009 1.4475 yellow oil |
930-55-2 100.2 214/760 yellow liquid |
59-89-2 116.1 224/747 29 yellow solid | |
| solubility UV absorption |
water: org. solv.: lipids: l max, nm: log e: l max, nm: log e: |
0.12%
sol. sol. sol. 233 2.65 347 0.75 |
miscible sol. sol. 230 2.91 333 1.03 |
miscible sol. 237 2.84 346 0.86 |
|
| ||||
Synonyms (Ref. 5.13.)
N-nitrosodimethylamine
- dimethylnitrosamin (German); dimethylnitrosamine;
N-nitrosodiethylamine
- diaethylnitrosamin (German); diethylnitrosamine;
diethylnitrosoamine;
N-nitrosodipropylamine
- di-n-propylnitrosamine;
N-nitrosodibutylamine
- butylamine,
N-nitrosoiperidine
- nitrosopiperidin (German);
N-nitrosopyrrolidine
- N-nitrosopyrrolidin (German); pyrrolidine,
N-nitrosomorpholine
- morpholine, 4-nitroso-; N-nitrosomorpholin (German);
molecular formula (Ref. 5.14)
| NDMA - (CH3)2NNO | NPIP - PIP-NO (C5H10N2O) |
| NDEA - (C2H5)2NNO | NPYR - PYR-NO (C4H8N2O) |
| NDPA - (C3H7)2NNO | NMOR - MOR-NO (C4H8N2O2) |
| NDBA - (C4H9)2NNO |
See Figure 1.1.4. for the molecular structures of the analytes.
1.2. Limit defining parameters
The air samplers were vapor spiked with the analytes by the liquid
injection of a certified mixture on Polar Partition tubes. The spiked
tubes were placed in front of ThermoSorb/N air samplers and then 50 L
(1 L/min) of air, at about 80% relative humidity and 22°C, were drawn
through the sampling train. The
The analytes were vapor spiked on the air samplers as components of a commercially prepared, certified mixture. The mixture was prepared and certified by Thermo Electron Corporation and their results are presented below.
|
| ||||||
| NDMA | NDEA | NDPA | NDBA | NPIP | NPYR | NMOR |
|
| ||||||
| 10 | 10 | 10 | 9 | 9 | 10 | 15 |
|
| ||||||
- 1.2.1. Detection limits of the analytical procedure
The detection limit of the analytical procedure is the amount of analyte per injection which will result in a peak whose height is about 5 times the amplitude of the base line noise.
The detection limits are presented below as mass per injection. (Section 4.1.)
|
| ||||||
| NDMA | NDEA | NDPA | NDBA | NPIP | NPYR | NMOR |
|
| ||||||
| 50 | 50 | 50 | 45 | 45 | 50 | 75 |
|
| ||||||
1.2.2. Detection limits of the overall procedure
The detection limit of the overall procedure is the amount of analyte spiked on the sampling device which allows recovery of an amount of analyte equivalent to the detection limit of the analytical procedure. (Section 4.2.)
|
| |||||||
| analyte | NDMA | NDEA | NDPA | NDBA | NPIP | NPYR | NMOR |
|
| |||||||
| ng/sample ppb µg/m3 |
10 0.043 0.13 |
10 0.031 0.13 |
10 0.024 0.13 |
9 0.019 0.12 |
9 0.026 0.12 |
10 0.032 0.13 |
15 0.042 0.20 |
|
All values based on the recommended air volume. | |||||||
1.2.3. Reliable quantitation limits
The reliable quantitation limit is the smallest amount of analyte which can be quantitated within the requirements of 75% recovery and 95% confidence limits of ±25%.
The reliable quantitation limits were the same as the detection limits of the overall procedure since the desorption efficiencies were above 75% and the 95% confidence intervals were less than ±25%. (Section 4.2.)
|
| |||||||
| analyte | NDMA | NDEA | NDPA | NDBA | NPIP | NPYR | NMOR |
|
| |||||||
| ng/sample ppb µg/m3 |
10 0.043 0.13 |
10 0.031 0.13 |
10 0.024 0.13 |
9 0.019 0.12 |
9 0.026 0.12 |
10 0.032 0.13 |
15 0.042 0.20 |
|
All values based on the recommended air volume. | |||||||
The reliable quantitation limit and detection limits reported in the method are based upon optimization of the instrument for the smallest possible amount of analyte. When the target concentration of an analyte is exceptionally higher than these limits, they may not be attainable at the routine operating parameters.
1.2.4. Sensitivity
The sensitivity of the analytical procedures is determined by the slope of the calibration curves over a concentration range from 0.5 to 2 times the target concentrations. The sensitivity will vary somewhat with the particular instrument used in the analysis. (Section 4.4)
|
| |||||||
| analyte | NDMA | NDEA | NDPA | NDBA | NPIP | NPYR | NMOR |
|
| |||||||
| area units per µg/mL |
239864 | 208144 | 163134 | 129648 | 179720 | 201661 | 176596 |
|
| |||||||
1.2.5. Recovery
The recovery of the analytes from the collection medium must be 75% or greater. The average recoveries from spiked samples over the range of 0.5 to 2 times the target concentrations are presented below. (Section 4.6.)
|
| ||||||
| NDMA | NDEA | NDPA | NDBA | NPIP | NPYR | NMOR |
|
| ||||||
| 97.4 | 99.7 | 98.9 | 97.7 | 96.0 | 97.6 | 98.1 |
|
| ||||||
1.2.6. Precision (analytical method only)
The pooled coefficients of variation obtained from replicate determinations of analytical standards at 0.5, 1 and 2 times the target concentrations are presented below. (Section 4.3.)
|
| ||||||
| NDMA | NDEA | NDPA | NDBA | NPIP | NPYR | NMOR |
|
| ||||||
| 0.037 | 0.044 | 0.048 | 0.047 | 0.051 | 0.040 | 0.032 |
|
| ||||||
1.3. Advantages
- 1.3.1. The sampling and analytical procedures permit the
simultaneous determination of a mixture of analytes.
1.3.2. The sampling and analytical procedures are precise, reliable, safe and convenient.
1.3.3. The sampling procedure is artifact free. The capacity of the sampling device to prevent artifacts is probably not unlimited.
1.3.4. The air sampling device is commercially available and is
constructed of opaque plastic to prevent photo-degradation of the
collected
1.3.5. The samples are stable when stored at ambient temperatures for at least 17 days.
1.4. Disadvantages
- 1.4.1. Smaller laboratories may not be able to support the cost
of the recommended sampling and analytical instrumentation.
1.4.2. The ability of the sampling device to collect and retain the analytes is limited.
2. Sampling Procedure
- 2.1. Apparatus
- 2.1.1. An air sampling pump, the flow of which can be determined
to within ±5% at the recommended air flow rate with the air sampler
in line.
2.1.2. ThermoSorb/N air sampling cartridges available from Thermo Electron Corporation, Waltham, Mass.
2.1.3. Equipment to measure the air flow rate through the sampling device.
2.2. Reagents
None required
2.3. Technique
- 2.3.1. Prior to sampling, remove the
ThermoSorb/N air sampling device from the foil container. Save the
container so it can be used for sample shipment.
2.3.2. Prior to sampling, remove the red end caps from the inlet and outlet ports. Store the caps on the air sampler in the places that are provided for this use.
2.3.3. Label the air sampler and attach the device to the air
sampling pump with flexible tubing. Adjust the pump to obtain the
proper air flow rate. The recommended rate is 1 L/min, but flow
rates of from 0.2 to 2 L/min may be used. If air volumes larger than
the recommended 75 L are to be sampled or if large amounts of
2.3.4. Attach the sampling device in the breathing zone of the employee to be monitored. The molded clip is convenient for this purpose.
2.3.5. After sampling for the appropriate time, remove the device and replace the red end caps on the inlet and outlet ports of the sampler.
2.3.6. Wrap each sample end to end with official OSHA seals. Place the sealed air sampler inside the foil container from Section 2.3.1.
2.3.7. With each set of samples, submit at least one blank sample. The blank should be subjected to the same handling as the sample except that no air is drawn through it.
2.3.8. Place the samples in a freezer if they are to be stored before shipping to the laboratory.
2.3.9. List possible interferences on the sample data sheet.
2.4. Breakthrough
Breakthrough studies were conducted by connecting two air samplers in series. The first air sampler was vapor spiked with twice the target concentration of the mixture and then air at 80% relative humidity and 22°C was drawn through the sampling train. Both air samplers were analyzed after the appropriate air volume had been sampled. Percent breakthrough was defined as the amount of a component found on the second ThermoSorb/N tube divided by the amount of that component vapor spiked on the first tube, multiplied by 100.
NDMA was the only component of the mixture that was lost from the
first sampling device.
It was found that as much as 280 L of air may be sampled for NDMA with no loss of the agent if two ThermoSorb/N tubes were connected in series. When 400 L of air were sampled at 2 L/min, about 16% of the NDMA vapor spiked on the first tube was lost from the sampling train. All of the recovered NDMA was found on the second tube. None of the other components moved from the first tube.
When the relative humidity was decreased from 80%, the 5% breakthrough air volume for NDMA was found to increase. At 63% relative humidity, over 200 L of air was sampled with no NDMA breakthrough. The complete results of the breakthrough study are presented in Section 4.5.
2.5. Desorption efficiency
The average desorption efficiency for each of the analytes vapor spiked at 0.5, 1 and 2 times the target concentration on ThermoSorb/N air samplers is presented below. (Section 4.6.)
|
| ||||||
| NDMA | NDEA | NDPA | NDBA | NPIP | NPYR | NMOR |
|
| ||||||
| 97.4 | 99.7 | 98.9 | 97.7 | 96.0 | 97.6 | 98.1 |
|
| ||||||
2.6. Recommended air volume and sampling rate
- 2.6.1. The recommended air volume is 75 L.
2.6.2. The recommended air sampling rate is 1 L/min. Studies indicate that sampling rates of from 0.2 to 2 L/min may be used.
2.7. Interferences (sampling)
- 2.7.1. It is imperative, when sampling air for nitrosamines, to
be certain that the analyte is indeed present in the air and not
artifactually formed on the sampling device from precursor amines
and nitrosating agents. The commercial ThermoSorb/N
The process by which the ThermoSorb/N tubes prevent artifact
formation is proprietary. The manufacturer states that the device
has an amine trap that removes incoming amines and holds them
unavailable for nitrosation. The sampled air, after passing through
the amine trap, enters a solid sorbent bed where the
The artifact resistance of the ThermoSorb/N air sampler was verified using morpholine (a precursor amine for NMOR) and nitrogen dioxide. Morpholine was selected as the test amine because it has been shown to be easily nitrosated. Nitrogen dioxide in a gas bag, mixed with humid air, has been shown to be an effective nitrosating species. A Teflon gas bag was prepared containing 33 µg/L morpholine in nitrogen and another containing 4.8 ppm (v/v) NO2 in air at about 75% relative humidity was also prepared. The morpholine bag was sampled for 50 min at 1 L/min and then the NO2 bag was sampled for 50 min at 1 L/min. The total morpholine loaded on the tube was 1650 µg. There was no NMOR formed on the ThermoSorb/N cartridge. The experiment was repeated using a standard Florisil tube. The result showed that 7 µg of NMOR could be formed, as an artifact on the tube, after sampling each bag for 7 L.
2.7.2. It is unknown if there are other potential interferences
with the collection of
2.8. Safety precautions (sampling)
- 2.8.1. Attach the sampling equipment to the worker in such a
manner that it will not interfere with work performance or safety.
2.8.2. Follow all safety practices that apply to the work area to be monitored.
3. Analytical Procedure
- 3.1. Apparatus
- 3.1.1. A temperature programmable gas chromatograph (GC).
3.1.2. A high performance liquid chromatographic (HPLC) pump.
3.1.3. An HPLC sample injector.
3.1.4. A Thermal Energy Analyzer (TEA), Thermal Electron Corporation, Waltham, Mass.
3.1.5. A GC column capable of resolving the analytes from each
other and potential interferences. The column used in this work was
a
3.1.6. A HPLC analytical column capable of resolving the analytes from each other and potential interferences. The column used in this work was a DuPont Zorbax CN, 4.6 mm × 25 cm.
3.1.7. The necessary hardware to interface the TEA to the GC and the HPLC apparatus.
3.1.8. An electronic integrator or other suitable means to measure peak area and record chromatograms.
3.1.9. Vials, 2-mL with Teflon-lined caps.
3.1.10. Syringes, of convenient sizes for samples and standard preparations and injections.
3.1.11. Hypodermic needles, 23 gauge × 1 in. with a Luer hub.
3.1.12. Volumetric flasks, 1-mL and other convenient sizes.
3.1.13. Dewar flasks, of convenient sizes for liquid nitrogen.
3.1.14. Heating tape, high temperature, heavily insulated.
3.1.15. Variable voltage transformer.
3.2. Reagents
- 3.2.1. NDMA, NDEA, NDPA, NDBA, NPIP, NPYR and
NMOR analytical standards. A certified mixture containing each of
the analytes, in ethanol, at the following concentrations was used
to evaluate this method. The mixture was purchased from and
certified by Thermo Electron Corporation, Waltham, Mass.
|
| ||||||
| NDMA | NDEA | NDPA | NDBA | NPIP | NPYR | NMOR |
|
| ||||||
| 10 | 10 | 10 | 9 | 9 | 10 | 15 |
|
| ||||||
3.2.3. n-Propanol, acetone and trimethylpentane, HPLC grade.
3.2.4. Nitrogen, liquid.
3.2.5. Helium, GC grade.
3.2.6. Oxygen and air, medical grade.
3.3. Standard preparation
- 3.3.1. Keep the exposure of the standards to light at a minimum
because light will decompose each of the analytes.
3.3.2. In the event that the mixture is not available, dilute the pure individual components to result in a solution at approximately the following concentrations. Dilute concentrations higher than 15 µg/mL with ethanol. When the concentration falls below 15 µg/mL, dilute with the desorbing solution described in Section 3.2.2.
|
| ||||||
| NDMA | NDEA | NDPA | NDBA | NPIP | NPYR | NMOR |
|
| ||||||
| 0.20 | 0.20 | 0.20 | 0.18 | 0.18 | 0.20 | 0.30 |
|
| ||||||
The target concentration solution was prepared by diluting the standard mixture described in Section 3.2.1. 1 to 50 with desorbing solution.
3.3.3. Additional standards at other than the target concentration should be prepared in order to generate the calibration curve.
3.3.4. Store the standards using well sealed, dark containers in a freezer.
3.4. Sample preparation
- 3.4.1. Store the samples in a freezer until analysis.
3.4.2. The sample should be received in a foil container. Remove the sample from the container.
3.4.3. Insure that the official OSHA seal is intact and complete.
3.4.4. Check the laboratory sample number against the field identification number to be sure that the sample has been properly identified.
3.4.5. Prepare the desorption solution described in Section 3.2.2. Store the solution in a well sealed, dark bottle.
3.4.7. Remove the OSHA seal and the red end caps from the sample.
3.4.8. Attach a syringe needle to the male Luer fitting at the inlet port of the air sampler.
3.4.9. Fill a syringe with about 4 mL of the desorption solution. Attach the syringe to the female Luer fitting located at the outlet end of the air sampler.
3.4.10. Elute the sample by gently forcing the desorption solvent
through the air sampler at approximately 0.5 mL/min. Collect the
first
3.4.11. Because light will decompose
3.4.12. If the eluted samples are not to be analyzed immediately,
transfer the contents of each flask to a separate vial which can be
sealed with a
3.5. Analysis
- 3.5.1. Instrument conditions
| GC conditions | |
| injector temperature: | 150°C |
| column temperature: | 150 to 200°C at 4°C/min |
| transfer line temp.: | 210°C |
| helium (carrier gas): | 30 mL/min |
| injection volume: | 5 µL |
| The recommended GC column is a 10-ft ×
| |
| TEA conditions | |
| GC pyrolyzer temp.: | 475°C |
| oxygen: | 5 mL/min |
| pressure: | 1 mm Hg |
| attenuation: | 4 |
| cold trap temp.: | -130°C (n-propanol and liquid nitrogen) |
3.5.2. The transfer line between the GC and the TEA must be maintained at about 210°C. The use of a heating tape and a variable voltage transformer is recommended.
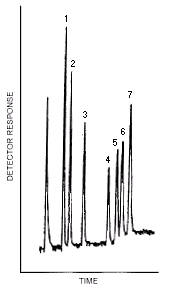
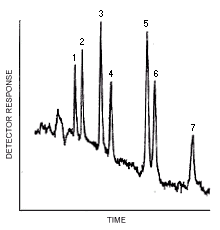
3.5.3. Chromatogram (Figure 4.3.1.)
3.5.4. Detector response is measured with an electronic integrator or other suitable means.
3.5.5. An external standard procedure is used to prepare a calibration curve using at least three standard solutions of different concentrations. The calibration curve is prepared daily. The integrator is calibrated to report results in µg/mL.
3.5.6. Bracket the samples with analytical standards.
3.6. Interferences (analytical)
- 3.6.1. Because the TEA has been shown to respond to compounds
other than
HPLC conditions for confirmation of high samples
| column: | DuPont Zorbax CN (4.6 mm × 25 cm) |
| mobile phase: | 95% trimethylpentane/ 5% acetone, v/v |
| flow rate: | 1.3 mL/min |
| injection volume: | 5 to 25 µL |
The TEA conditions are the same as for the GC/TEA analysis except
that the HPLC pyrolyzer is used at 550°C and the cold trap is
maintained at
| chromatogram: | Figure 4.3.2. |
3.6.2. GC and HPLC parameters may be changed to circumvent interferences. Possible interferences are listed on the sample data sheets.
3.6.3. The only unequivocal means of structure designation is by high resolution mass spectrometry with continuous peak matching. It is recommended this procedure be used to confirm samples whenever possible.
3.7. Calculations
- 3.7.1. The integrator value in µg/mL is used for
reference only. More reliable results are obtained by use of a
calibration curve. The detector response, for each standard, is
compared to its equivalent concentration in µg/mL and the
best straight line through the data points is determined by linear
regression.
3.7.2. The concentration, in µg/mL, for a particular determination is obtained by comparing its detector response to the calibration curve.
3.7.3. The result obtained from the analysis of each vial or flask is corrected by the appropriate desorption efficiency, and then the corrected results from the "A" and "B" determinations that compose a particular air sample are added together.
3.7.4. The air concentrations for a sample result is calculated by the following equation:
µg/m3 = (C)(D)(1000) / E
| where C = D = E = |
µg/mL from Section 3.7.3. desorption volume in milliliters (1 mL) air volume in liters |
3.7.5. To correct the results from Section 3.7.4. to
ppb = (µg/m3)(24.46) / MW
| where | µg/m3 = | result from Section 3.7.4. |
| 24.46 = | molar volume of an ideal gas at 25°C and 760 mm Hg. | |
| MW = | molecular weight of the analyte, obtained below. |
|
| ||||||
| NDMA | NDEA | NDPA | NDBA | NPIP | NPYR | NMOR |
|
| ||||||
| 74.08 | 102.14 | 130.19 | 158.2 | 114.15 | 100.0 | 116.1 |
|
| ||||||
3.8. Safety precautions (analytical)
- 3.8.1. The analytes are extremely potent animal carcinogens and
utmost care must be exercised when working with these compounds.
3.8.2. Avoid skin contact with liquid nitrogen and the solvents.
3.8.3. Confine the use of solvents to a fume hood.
3.8.4. Wear safety glasses in all laboratory areas.
3.8.5. Check to be sure that the TEA exhaust is connected to a fume hood.
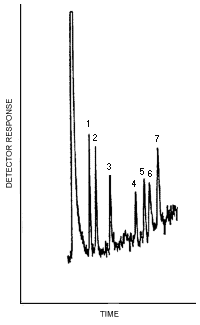
- 4.1. Detection limit of the analytical procedure
Figure
4.1. is a chromatogram obtained from a
|
| ||||||
| NDMA | NDEA | NDPA | NDBA | NPIP | NPYR | NMOR |
|
| ||||||
| 0.01 | 0.01 | 0.01 | 0.009 | 0.009 | 0.01 | 0.015 |
|
| ||||||
4.2. The detection limit of the overall procedure and the reliable quantitation limit.
The following data were obtained by vapor spiking the analytes on air samplers.
|
| |||||||
| analyte ng/sample |
NDMA 10 |
NDEA 10 |
NDPA 10 |
NDBA 9 |
NPIP 9 |
NPYR 10 |
NMOR 15 |
|
| |||||||
| recovery, % | 91.0 101.2 102.7 104.4 109.5 108.1 |
107.2 116.5 99.5 112.7 108.4 112.0 |
90.1 90.4 93.3 101.3 103.8 96.2 |
113.2 96.0 98.3 119.5 100.8 104.7 |
95.4 94.7 95.0 103.2 102.2 92.4 |
83.5 81.0 79.1 98.1 94.6 96.7 |
103.1 98.1 85.5 101.0 90.9 86.0 |
SD 1.96 SD |
102.8 6.593 12.9 |
109.4 5.864 11.5 |
95.8 5.697 11.2 |
105.4 9.166 18.0 |
97.2 4.435 8.7 |
88.8 8.550 16.8 |
94.1 7.674 15.0 |
|
| |||||||
4.3. Precision of the analytical procedure
The following data were obtained from multiple injections of analytical standards.
|
| |||||||
| analyte µg/mL |
NDMA 0.10 |
NDEA 0.10 |
NDPA 0.10 |
NDBA 0.090 |
NPIP 0.090 |
NPYR 0.10 |
NMOR 0.15 |
|
| |||||||
| area counts |
25396 26599 24888 24455 27643 |
20623 22521 23689 21599 20024 |
16848 18318 17322 17349 16197 |
11244 11693 11788 12042 12855 |
16015 16543 14112 15843 15714 |
20051 19715 18453 19972 17380 |
26683 26215 28041 27430 26656 |
SD CV (%) |
25796.2 1307.57 5.07 |
21691.2 1467.04 6.76 |
17206.8 777.28 4.52 |
11924.4 594.76 4.99 |
15645.4 913.42 5.84 |
19114.2 1163.94 6.09 |
27005.0 725.17 2.69 |
|
| |||||||
|
| |||||||
| analyte µg/mL |
NDMA 0.20 |
NDEA 0.20 |
NDPA 0.20 |
NDBA 0.18 |
NPIP 0.18 |
NPYR 0.20 |
NMOR 0.30 |
|
| |||||||
| area counts |
49510 50742 47671 47182 51124 |
43828 42661 40916 40588 43604 |
28483 32234 29839 28192 32308 |
20855 24048 23085 21746 23588 |
29517 33733 32097 32614 34985 |
37646 38898 38797 39735 39681 |
56148 52347 53250 55774 56741 |
SD CV (%) |
49245.8 1773.08 3.60 |
42319.4 1500.84 3.55 |
30211.2 1980.57 6.56 |
22664.4 1328.69 5.86 |
32589.2 2045.08 6.28 |
38951.4 848.10 2.18 |
54852.0 1932.58 3.52 |
|
| |||||||
|
| |||||||
| analyte µg/mL |
NDMA 0.40 |
NDEA 0.40 |
NDPA 0.40 |
NDBA 0.36 |
NPIP 0.36 |
NPYR 0.40 |
NMOR 0.60 |
|
| |||||||
| area counts |
97764 97759 96497 100393 95827 |
84833 82918 83760 84837 84281 |
63298 64629 65206 67017 67276 |
45551 46465 46143 46978 48762 |
61866 64343 64646 64918 65845 |
80671 77716 81891 77044 80412 |
104244 109657 108013 101980 109832 |
SD CV (%) |
97648.0 1746.54 1.79 |
84125.8 809.72 0.96 |
65485.2 1669.45 2.55 |
46779.8 1223.00 2.61 |
64323.6 1484.26 2.31 |
79546.8 2069.03 2.60 |
106745.2 3484.87 3.26 |
|
| |||||||
|
| ||||||
| NDMA | NDEA | NDPA | NDBA | NPIP | NPYR | NMOR |
|
| ||||||
| 0.037 | 0.044 | 0.048 | 0.047 | 0.051 | 0.040 | 0.032 |
|
| ||||||
The data in Tables 4.3.1. - 4.3.3. are presented respectively in
Figures
The breakthrough study was conducted by first vapor-spiking the following amounts of the analytes on the first of two ThermoSorb/N tubes connected in series.
|
| |||||||
| analyte | NDMA | NDEA | NDPA | NDBA | NPIP | NPYR | NMOR |
|
| |||||||
| µg | 0.40 | 0.40 | 0.40 | 0.36 | 0.36 | 0.40 | 0.60 |
|
| |||||||
Next, air at about 80% relative humidity and 22°C was drawn through the sampling train. After the appropriate air volume had been sampled, both tubes were analyzed and the results are presented in Table 4.5.2.
|
| ||||||||
| air vol. | flow rate | % breakthrough | ||||||
| (L) | (L/min) | NDMA | NDEA | NDPA | NDBA | NPIP | NPYR | NMOR |
|
| ||||||||
| 80 88 93 120 128a 280b 400c |
1.0 0.2 2.0 1.0 1.0 1.0 2.0 |
0 4.3 0 16.0 19.2 93.7 100.0 |
0 0 0 0 - 0 0 |
0 0 0 0 - 0 0 |
0 0 0 0 - 0 0 |
0 0 0 0 - 0 0 |
0 0 0 0 - 0 0 |
0 0 0 0 - 0 0 |
|
| ||||||||
b NDMA lost from the first tube was recovered in the second tube.
c About 16% of the NDMA
4.6. Desorption efficiency (vapor-spiked)
|
| |||||||
| analyte µg/sample |
NDMA 0.10 |
NDEA 0.10 |
NDPA 0.10 |
NDBA 0.09 |
NPIP 0.09 |
NPYR 0.10 |
NMOR 0.15 |
|
| |||||||
| % recovered |
100.53 92.10 93.20 92.65 100.67 94.88 |
99.10 95.50 98.08 101.77 95.58 100.48 |
99.70 96.40 95.95 98.04 96.83 97.91 |
95.24 93.73 96.24 92.65 101.03 100.00 |
92.33 95.15 93.20 92.86 100.00 94.57 |
93.19 93.19 91.43 94.09 96.05 101.97 |
92.33 94.07 94.36 101.81 96.92 100.15 |
| 95.67 | 98.42 | 97.47 | 96.48 | 94.68 | 94.99 | 96.61 | |
|
| |||||||
|
| |||||||
| analyte µg/sample |
NDMA 0.20 |
NDEA 0.20 |
NDPA 0.20 |
NDBA 0.18 |
NPIP 0.18 |
NPYR 0.20 |
NMOR 0.30 |
|
| |||||||
| % recovered |
106.84 98.19 96.60 92.10 103.59 96.50 |
107.49 99.16 102.40 107.00 96.45 94.32 |
101.00 102.68 103.43 96.00 104.50 95.91 |
102.03 101.82 101.60 96.89 103.33 99.86 |
98.45 101.46 98.45 96.67 93.06 95.37 |
99.28 100.00 96.73 93.00 97.92 99.11 |
100.87 101.03 97.48 100.18 97.67 94.16 |
| 98.97 | 101.14 | 100.59 | 100.92 | 97.24 | 97.67 | 98.56 | |
|
| |||||||
|
| |||||||
| analyte µg/sample |
NDMA 0.40 |
NDEA 0.40 |
NDPA 0.40 |
NDBA 0.36 |
NPIP 0.36 |
NPYR 0.40 |
NMOR 0.60 |
|
| |||||||
| % recovered |
95.78 99.22 97.21 94.15 99.22 98.99 |
100.51 101.33 95.37 99.02 100.62 100.32 |
98.46 100.00 98.41 99.39 97.54 98.16 |
95.20 97.11 98.50 94.66 94.22 94.36 |
96.58 99.14 96.01 94.15 95.76 94.15 |
98.77 100.56 97.88 100.99 101.36 101.36 |
96.14 99.72 100.80 95.76 100.37 101.34 |
| 97.43 | 99.53 | 98.66 | 95.68 | 95.96 | 100.15 | 99.02 | |
|
| |||||||
|
| |||||||
| analyte | NDMA | NDEA | NDPA | NDBA | NPIP | NPYR | NMOR |
|
| |||||||
| % | 97.4 | 99.7 | 98.9 | 97.7 | 96.0 | 97.6 | 98.1 |
|
| |||||||
The data in Tables 4.7.2.
and 4.7.3.
represent the effects of storage at ambient (21 to 26°C) and reduced
|
| |||||||
| analyte | NDMA | NDEA | NDPA | NDBA | NPIP | NPYR | NMOR |
|
| |||||||
| µg | 0.20 | 0.20 | 0.20 | 0.18 | 0.18 | 0.20 | 0.30 |
|
| |||||||
The recoveries are not corrected for desorption efficiency. Three
stored samples were analyzed at approximately
|
| |||||||
| days of storage | NDMA | NDEA | NDPA | NDBA | NPIP | NPYR | NMOR |
|
| |||||||
| 0 3 7 10 14 17 |
94.0 99.7 100.2 95.8 97.2 99.0 98.5 102.4 93.9 95.7 97.0 103.2 93.5 96.3 94.1 92.3 91.5 93.2 |
97.0 104.2 102.0 98.9 92.7 95.8 96.6 100.9 100.5 96.2 96.8 108.2 95.0 99.3 96.3 97.6 96.9 100.1 |
97.2 104.0 102.1 94.3 97.4 92.6 101.0 97.2 98.0 99.0 92.6 104.0 89.0 93.8 93.1 92.2 92.8 92.4 |
96.2 99.4 98.6 96.4 91.0 93.7 92.1 100.7 99.1 92.4 89.1 97.7 83.5 88.9 87.8 91.4 88.9 89.7 |
94.8 101.9 99.0 94.2 93.0 95.2 94.6 93.6 96.6 93.6 90.0 99.3 89.0 89.2 86.0 89.4 90.2 89.3 |
94.8 100.4 95.3 91.5 88.2 91.9 90.6 89.7 93.0 85.9 85.4 94.8 86.0 86.3 84.3 86.0 85.6 84.9 |
92.4 99.3 95.0 89.5 89.6 97.9 90.3 92.1 99.9 96.2 90.8 97.7 88.0 88.8 85.1 90.2 89.7 89.8 |
|
| |||||||
|
| |||||||
| days of storage | NDMA | NDEA | NDPA | NDBA | NPIP | NPYR | NMOR |
|
| |||||||
| 0 3 7 10 14 17 |
96.4 95.8 94.3 95.2 96.5 97.7 101.4 99.9 99.5 103.0 99.5 99.7 101.6 105.1 100.3 99.6 95.4 97.3 |
100.4 99.4 96.6 106.0 98.5 101.1 100.3 99.4 100.5 105.3 103.2 100.1 103.5 101.6 103.1 101.4 97.1 100.5 |
99.1 94.6 93.1 105.7 98.2 100.2 100.0 97.5 97.8 101.2 101.9 97.5 104.8 100.8 100.7 97.6 92.2 100.1 |
100.6 95.1 97.0 101.2 95.1 97.6 92.6 93.3 94.1 94.7 102.6 96.2 107.5 99.2 100.1 99.7 96.4 96.1 |
97.8 95.0 94.2 100.4 94.3 95.4 97.1 96.3 97.3 101.9 99.1 94.5 101.0 96.3 100.8 101.6 96.4 95.9 |
91.5 90.9 89.5 97.9 95.0 93.0 96.7 92.6 92.3 91.4 94.8 89.0 96.7 86.8 94.1 94.7 92.5 89.3 |
94.5 95.2 90.6 98.8 91.2 93.5 96.0 90.2 94.9 94.7 94.3 90.2 94.8 89.5 93.0 94.1 92.5 98.3 |
|
| |||||||
NDMA
The LD50 for NDMA, administered
orally to the rat, is 26 mg/kg. The LC50 is
78 ppm following an exposure time of four hours (Ref. 5.14). When 4 mg/kg of NDMA was administered in the
drinking water 5 times a week to 20 rats, liver cancer was detected in
13 of the animals. The mean total dose which was applied until the
appearance of malignant tumors in 50% of the animals
(D50) was 0.4 g/kg and the mean tumor
induction period in days (t50) was 270 days.
In an inhalation experiment, six rats were exposed to 4 mg/kg NDMA for
1/2 hour two times a week. Four rats died because of cancer of the
posterior nasal cavity which had entered the cranial cavity. One rat
had cancer of the pituitary gland and the last animal had a kidney
tumor. There were no liver tumors. The D50
was 0.25 g/kg and the t50 was 400 days. The
inhalation experiment was repeated at 2 mg/kg using 12 rats. Three
rats died prematurely and a fourth without tumors. The remaining 8
animals died from cancer of the posterior nasal cavity. Again, there
were no liver tumors. The D50 was lower than
for the high dose at 0.14 g/kg and the t50
was shorter at 340 days (Ref.
5.12.). NDMA has been shown to cause cancer in the rat, mouse,
Syrian Golden and European hamsters, mastomys, guinea pig, rainbow
trout, newt, aquarium fish and mink. The principal affected organs
were the liver, lung, nasal cavities and kidney (Ref.
5.15). It is known that chronic exposure to NDMA causes severe
liver damage and cirrhosis in man (Ref.
5.15). It has been reported that both rat and human liver slices
metabolize NDMA in a similar manner (Ref.
5.14).
NDEA
The LD50 for NDEA is 280 mg/kg
after oral administration to the rat (Ref.
5.13.). The agent is carcinogenic to many different animal species
which include sub-human primates. NDEA induces cancer following
prenatal exposure and in single dose experiments (Ref.
5.14.). NDEA was administered to rats in drinking water in a
chronic exposure experiment. Daily exposure was between 0.075 and 14.2
mg/kg in nine groups of animals. The total dose, until death occurred,
was between 64 and 965 mg/kg. The tumor induction time was between 68
and 840 days. All daily doses higher than 0.15 mg/kg gave a tumor
incidence of 100%. When a dose of 0.15 mg/kg per day was administered,
a tumor yield of 90% was obtained. At 0.075 mg/kg per day, 20 rats
survived for more than 600 days and 11 of the 20 animals had tumors of
the liver, esophagus, or the nasal cavity. All four of the animals
that lived longer than 940 days at this dose level had tumors. The
location of the tumors was dependent on the dose given, the
NDPA
The LD50 for NDPA, administered
orally to the rat, is 480 mg/kg (Ref.
5.13.). In a chronic experiment, the agent was added to the daily
food of the rats. Four dose groups were involved - 30 mg/kg led to
cancer of the liver, 15 mg/kg produced liver cancer in all the dosed
rats and in four cases metastases into the lung was observed. When 8
mg/kg NDPA was administered, the result was cancer in 15 of 16
animals. The lowest dose, 4 mg/kg, resulted in cancer of the liver in
12 of 14 animals. The mean carcinogenic doses
(D50) were 3.2, 1.86, 1.52 and 1.15 g/kg.
The mean induction periods (t50) were 120,
155, 202 and 300 days. (Ref.
5.12.).
NDBA
The LD50 for NDBA, following
oral administration to the rat, is 1200 mg/kg (Ref.
5.13.). When NDBA was given in the food - 75 mg/kg caused liver
tumors together with cirrhosis in all the rats, 37.5 mg/kg resulted in
liver cancer without cirrhosis in 13 of 16 rats. Five animals had
cancer of the esophagus and five cancer of the urinary bladder.
Another group of rats received daily doses of 20 mg/kg and the results
were multiple cancers of the esophagus in eight rats, seven bladder
cancers and four animals with liver cancer. A daily dose of 10 mg/kg
produced liver cancer in one animal and two adenomas in a total of ten
treated animals. NDBA was the only
NPIP
The LD50 for NPIP, after oral
administration to the rat, is 200 mg/kg (Ref.
5.12). When 20 mg/kg was given to rats in the daily drinking
water, 17 of 20 rats died prematurely. Three rats died after 186, 232
and 289 days of liver cancer with metastases in the lungs, the last
animal also had cancer in the esophagus. Because the 20 mg/kg daily
dose was not tolerated well, the experiment was repeated at 5 mg/kg.
Of nine animals, one died with papillomas, the other eight died of
esophageal cancer. Three rats also had liver cancer. The mean
carcinogen dose was 1.4 g/kg. and the average induction period was 280
days (Ref.
5.12.). NPIP has produced cancer in the rat, mouse, Syrian Golden
hamster and monkey. The principal affected organs were the esophagus,
liver, nasal cavities, larynx, trachea and forestomach (Ref.
5.15).
NPYR
The LD50 for NPYR, administered
orally to the rat, is 900 mg/kg (Ref.
5.12). In chronic experiments, 10 mg/kg and 5 mg/kg were
administered in the daily drinking water to two groups of five and 20
rats. Because the carcinogenic effect was weak, the dose was doubled
after 150 days. All the animals, but two who died without tumors,
developed liver cancer. The average carcinogenic doses
(D50) were 4.2 and 3.9 g/kg and the mean
induction periods (t50) were 290 and 470
days. The agent was determined to be a weak but relatively certain
carcinogen (Ref.
5.12.). NPYR has produced cancer in the rat, mouse and Syrian
Golden hamster. The principal affected areas were the liver, nasal
cavities, testes, lung and trachea (Ref.
5.15).
NMOR
The LD50 for NMOR, after oral
administration to the rat, was 320 mg/kg (Ref.
5.12). When 16 rats were given 8 mg/kg NMOR daily in the drinking
water, 14 animals died of liver cancer. The mean induction period
(t50) was only 165 days. A dose of 16 mg/kg
caused liver tumors in two of four rats after only 45 and 65 days
respectively and after 115 days liver cancer was observed. NMOR was
clearly the most rapidly acting liver carcinogen of the 65
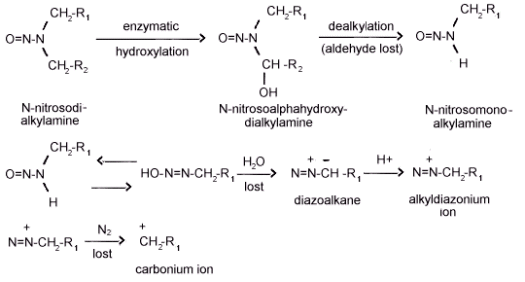
Figure 1.1.2. The metabolic activation on N-nitrosokialkylamines.
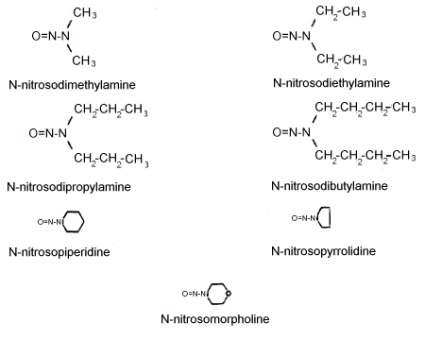
Figure 1.1.4 The molecular structures of the analytes.
 |
| |||||||||||||||
| Figure 4.1. The detection limits of the analytical procedure. | ||||||||||||||||
 |
| |||||||||||||||
| Figure 4.3.1. GC/TEA chromatogram of the analytes. | ||||||||||||||||
 |
| |||||||||||||||
| Figure 4.3.2. HPLC/TEA chromatogram of the analytes. | ||||||||||||||||
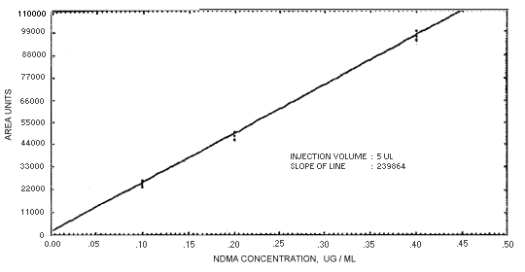
Figure. 4.4.1. Calibration curve for
N-nitrosodimethylamine. 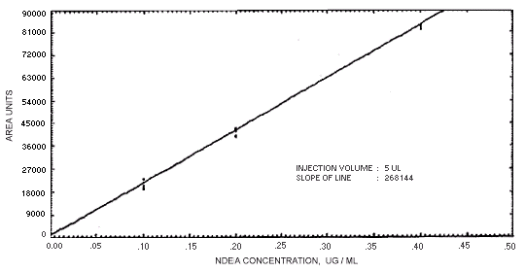
Figure 4.4.2. Calibration curve for
N-nitrosodiethylamine. 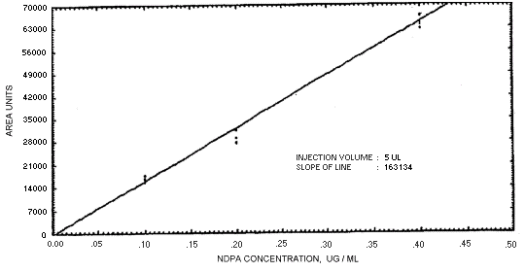
Figure 4.4.3. Calibration curve for
N-nitrosodipropylamine. 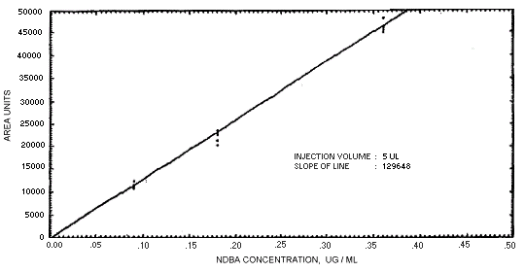
Figure 4.4.4. Calibration curve for
N-nitrosodibutylamine. 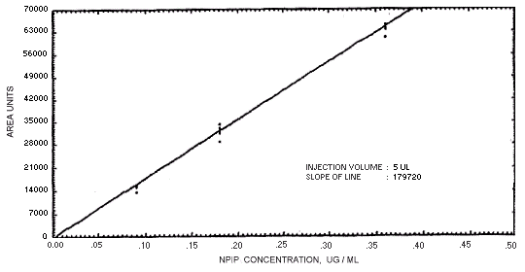
Figure 4.4.5. Calibration curve for
N-nitrosopiperdine. 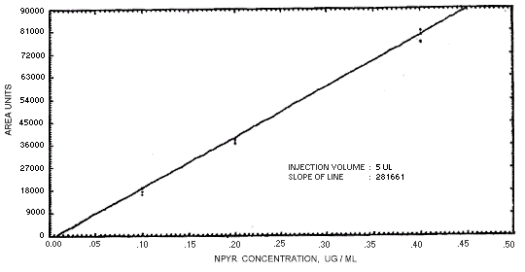
Figure 4.4.6. Calibration curve for
N-nitrosopyrrolidine. 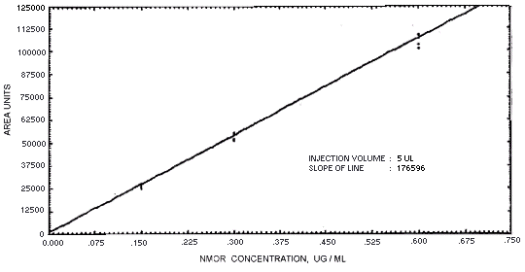
Figure 4.4.7. Calibration curve for
N-nitrosomorpholine. 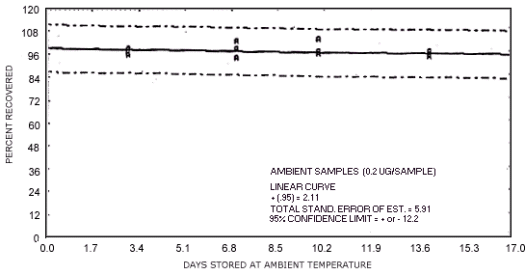
Figure 4.7.1. Ambient temperature
storage test for N-nitrosodimethylamine. 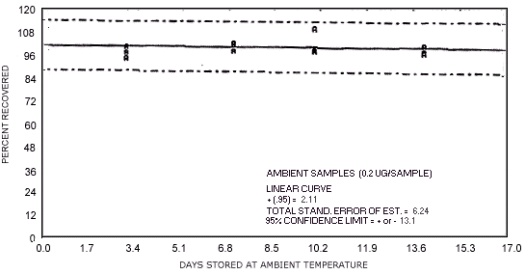
Figure 4.7.2. Ambient temperature
storage test for N-nitrosodiethylamine. 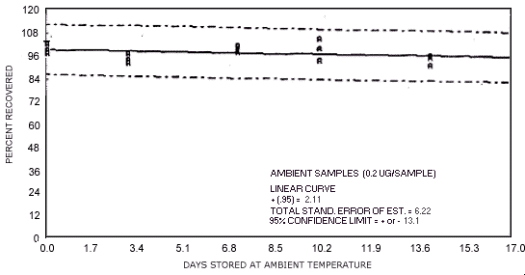
Figure 4.7.3. Ambient temperature
storage test for N-nitrosodipropylamine. 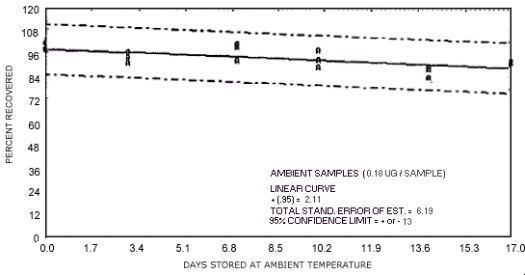
Figure 4.7.4. Ambient temperature
storage test for N-nitrosodibutylamine. 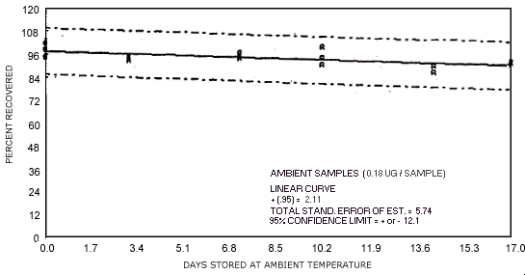
Figure 4.7.5. Ambient temperature
storage test for N-nitrosopiperdine. 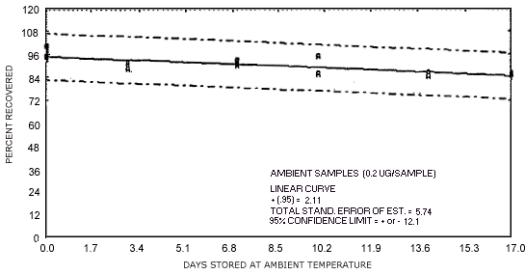
Figure 4.7.6. Ambient temperature
storage test for N-nitrosopyrrolidine. 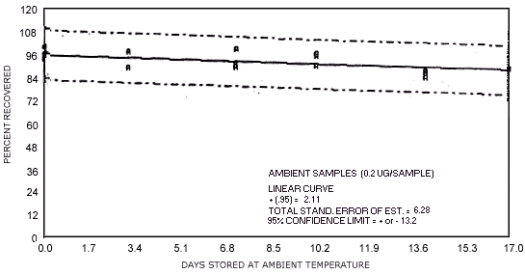
Figure 4.7.7. Ambient temperature
storage test for N-nitrosomorpholine. 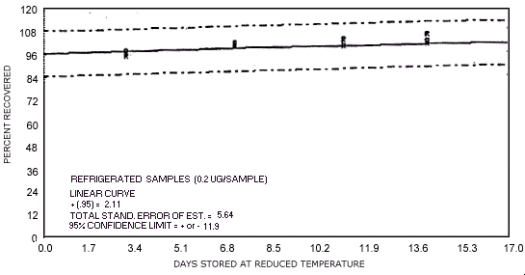
Figure 4.7.8. Reduced temperature
storage test for N-nitrosodimethylamine. 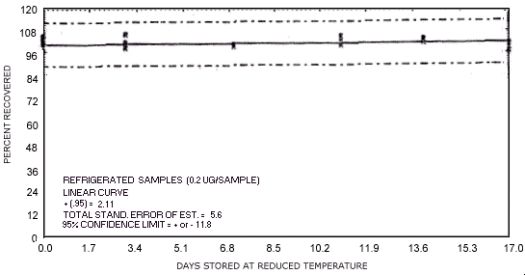
Figure 4.7.9. Reduced temperature
storage test for N-nitrosodiethylamine. 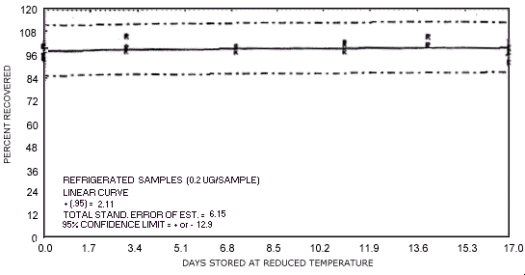
Figure 4.7.10. Reduced temperature
storage test for N-nitrosodipropylamine. 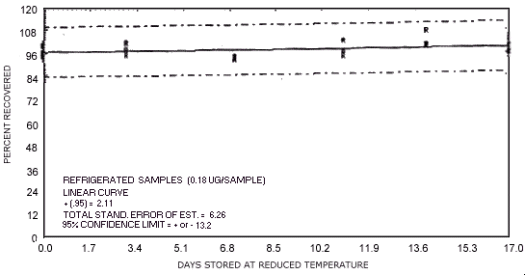
Figure 4.7.11. Reduced temperature
storage test for N-nitrosodibutylamine. 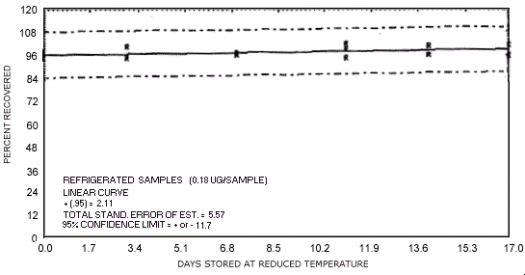
Figure 4.7.12. Reduced temperature
storage test for N-nitrosopiperidine. 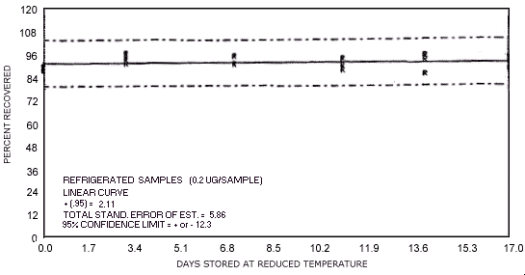
Figure 4.7.13. Reduced temperature
storage test for N-nitrosopyrrolidine. 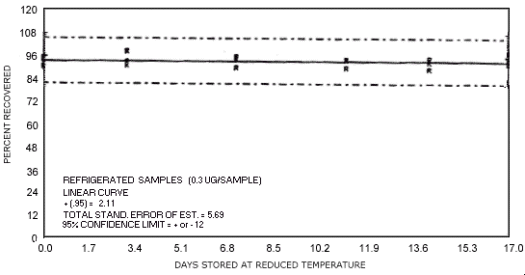
Figure 4.7.14. Reduced temperature
storage test for N-nitrosomorpholine.
5. References
- 5.1. Fine, D.H.; Rounbehler, D.P.; Rounbehler,
A.; Silvergleid, A.; Sawicki, E.; Krost, K. and DeMarrias, G.A.,
Environ. Science Technol. 11
5.2. Fine, D.H.; Rounbehler, D.P.; Sawicki, E. and Krost, K., Environ. Science Technol. 11 577-580 (1977).
5.3. Brunnemann, K.D. and Hoffmann, D.,
"Environmental Aspects of
5.4. Pellizzari, E.D.; Bunch, J.E.; Bursey, J.T.
and Berkley, R.E., Analytical Letters 9
5.5. Ceh, L.; Ender, F., Fd. Cosmet. Toxical.
16
5.6. Hendricks, W. Diethylnitrosamine (Method 13,
Organic Methods Branch, OSHA Analytical Laboratory, Salt Lake City,
Utah) Unpublished
5.7. Hendricks, W. N-nitrosomorpholine (Method
17, Organic Methods Evaluation Branch, OSHA Analytical Laboratory,
Salt Lake City, Utah) Unpublished
5.8. Fine, D.H.; Ross, R.; Fan, S.; Rounbehler,
D.P.; Silvergleid, A.; Song, L. and Morrison, J., "Determination of
5.9. Rounbehler, D.P.; Reisch, J.W.; Coombs,
J.R., and Fine, D.H., Anal. Chem. 52
5.10. Fisher, R.L. and Reiser, R.W. Anal.
Chem. 49
5.11. Sen, N.P., "Environmental Carcinogens
Selected Methods of Analysis, Analysis of Volatile Nitrosamines in
Food, Volume 1", IARC Scientific Publications No. 18, Egan, H.,
5.12. Druckrey, D.; Preussmann, R.; Ivankovic,
S. and Schmahl, D. Z. Krebsforsch 69
5.13. Registry of Toxic Effects of Chemical Substances, 1978 Edition. (Lewis, R.J. AND Tatken, R.L., Eds.) U.S. Department of Health, Education and Welfare, Public Health Service, Center for Disease Control, National Institute for Occupational Safety and Health, U.S. Government Printing Office, Washington, D.C. (1978).
5.14. "IARC Monographs on the Evaluation of the
Carcinogenic Risk of Chemicals to Humans, Some
5.15. Magee, P.N.; Montesano, R. and Preussmann,
R., "Chemical Carcinogens", Searle, C.E., Ed., ACS Monograph 173:
Washington, D.C.
5.16. Magee, P.N.; Barnes, J.M., Advan.
Cancer Res. 10
5.17. Lee, K.Y.; Lijinsky, W., J. Nat. Cancer
Inst. 37
5.18. Montesano, R.; and Bartsch, H.,
Mutation Res. 32
5.19. Magee, P.N. Fd. Cosmet Toxicol. 9
5.20. "IARC Monographs on the Evaluation of Carcinogenic Risk of Chemicals to Man, Volume 1", International Agency for Research on Cancer: Lyon (1972).
5.21. "IARC Monographs on the Evaluation of
Carcinogenic Risk of Chemicals to Man, Some Aromatic Amines, Hydrazine
and Related Substances,
5.22. Chem. Eng. News, 1979, 57 (40), 6.
5.23. Chem. Eng. News, 1979, 57 (33), 18.
5.24. Brunnemann, K.D.; Yu, L. and Hoffmann, D.,
Cancer Research 37
5.25. DAY, E.W.; West, S.D.; Koenig, D.K. and
Powers, F.L., J. Agric. Food. Chem. 27
5.26. Fiddler, W.; Pensabene, J.W.; Doerr, R.C.
and Dooley, C.J., Fd. Cosmet Toxicol. 15
5.27. Spiegelhalder, B.; Eisenbrand, G. and
Preussmann, R., Angew. Chem. Int. Ed. Engl. 17
5.28. Archer, M.C. and Wishnok, J.S., J.
Environ Sci. Health 10 & 11
5.29. Goff, E.U.; Coombs, J.R. and Fine, D.H.,
Anal. Chem. 52
5.30. Ember, L.R., Chem. Eng. News, 1980, 58 (13), 20.
5.31. Rounbehler, D.P.; Krull, I.S.; Goff, E.U.;
Mills, K.M.; Morrison, J.; Fagen, J.M. and Carson, G.A., Fd. Cosmet
Toxicol 17
5.32. Fajen, J.M.; Carson, G.A.; Rounbehler,
D.P.; Fan, T.Y.; Vita, R.; Goff, V.E.; Wolf, M.H.; Edwards, G.S.;
Fine, D.H.; Reinhold, V. and Biemann, K., Science 205
5.33. Krull, I.S.; Edwards, G.; Wolf, M.H.; Fan,
T.Y.; and Fine, D.H.;
5.34. Pitts, J.N.; Grosjean, D.; Cauwenberghe,
K.V.; Schmid, J.P. and Fitz, D.R., Environ. Science Technol. 12
5.35. Challis, B.C.; Edwards, A.; Hunma, R.R.;
Kyrtopoulos, S.A. and Outram, J.R., "Environmental Aspects of
5.36. Fine, D.H., "Monitoring Toxic Substances",
Schuetzle, D. Ed., American Chemical Society Symposium Series 94:
Washington, D.C.
5.37. March, J. "Advanced Organic Chemistry:
Reactions, Mechanisms and Structure",
5.38. Sander, J.; Schweinsberg, F.; La Bar, J.
and Burkle, G. "GANN Monograph on Cancer Research 17",
5.39. Iqbal, Z.M.; Dahl, K. and Epstein, S.S.,
Science 207
5.40. Wang, T.; Kakizoe, T.; Dion, P.; Furrer,
R.; Varghese, A.J. and Bruce, W.R., Nature, 276
5.41. Kakizoe, T.; Wang, T.-T.; Eng, V.W.S.;
Furrer, R.; Dion, P. and Bruce, W. R., Cancer Research 39
5.42. Wishnok, J.S. and Tannenbaum, S.R.,
Anal. Chem. 49
5.43. Fine, D.H., "Environmental Aspects of
5.44. "CRC Handbook of Chemistry and Physics", CRC Press: Boca Raton, FL (1979).
5.45. "ThermoSorb/N Air Sampler-Instructions for
Monitoring",
5.46. "ThermoSorb/N Air Sampling System", DS-11, Thermo Electron Corporation (1980).
5.47. Hotchkiss, J.H.; Barbour, J.F.; Libbey,
L.M. and Scanlan, R.A., J. Agric. Food Chem. 26
5.48. Instruction Manual - Thermal Energy
Analyzer, Model 502/LC, Thermal Electron Corporation, Waltham, Mass.
02145