1. General Discussion
1.1 Background
1.1.1 History
Air samples were
received at SLTC requesting analysis for isopropylamine (IPAM)
collected on tubes containing XAD-2 resin coated with 10%
1-naphthylisothiocyanate (NITC). This compound was similar to the
ethylenediamine in OSHA Method 60, so the analytical parameters of
analysis by liquid chromatography with an ultraviolet detector were
used.1
The extraction and retention studies were performed using the
Bakerbond CN LC column using a mobile phase of 90:10
isooctane:isopropanol. This column became irreparably clogged and
could not be replaced soon, therefore a Restek Pinnacle TO-11 LC
column and a mobile phase of 55:45:0.2 acetonitrile:water:phosphoric
acid was used for the remaining tests. The peak shape on the TO-11
column was sharper, giving greater sensitivity. The samples were
extracted with 2 mL N,N-dimethylformamide
(DMF), and had good extraction efficiencies averaging 99.5%. The
retention efficiency study showed no IPAM on the back-up section of
the spiked tube or back-up tube, for tubes spiked with 222 µg, that
had 20-L humid air drawn through them. The storage study showed little
loss for samples stored for up to 14 days under both refrigerated and
ambient conditions.
1.1.2 Toxic effects (This section is for
information only and should not be taken as the basis of OSHA
policy.)2
IPAM
is a moderate skin irritant, severe eye irritant, and moderate mucous
membrane irritant. It is moderately toxic by ingestion and mucous
membrane absorption. Workers exposed to IPAM reported transient visual
disturbances, such as halos around lights, after exposure to vapors
for 8 hours, probably resulting in corneal edema, which disappeared
after 3 to 4 hours.
1.1.3 Workplace exposure3,4
IPAM
is used as a solvent, depilatory, and to dissolve 2,4-D. It is used as
an intermediate in the synthesis of dyes, rubber accelerators,
insecticides, bactericides, textile specialties, surface-active agents
and pharmaceuticals.
1.1.4 Physical properties and other
descriptive information5,6
| CAS number: |
75-31-0 |
IMIS7: |
1562 |
| molecular weight: |
59.08 |
vapor density: |
2.03 |
| melting point: |
-101°C |
boiling point: |
34°C |
| appearance: |
clear liquid |
vapor pressure: |
61.33 kPa @20°C |
| odor: |
amine or ammonia |
flash point: |
-37.2°C (-35°F)(cc) |
autoignition
temperature: |
|
|
-26°C(-14.8°F)(oc) |
| 402°C (756°F) |
molecular formula: |
C3H9N |
| solubility: |
water, alcohol, acetone |
|
density:0.694 |
| synonyms: |
2-aminopropane;
2-propanamine |
|
| structural formula: |
 |
|
|
|
|
|
This method was evaluated according to the OSHA SLTC
"Evaluation Guidelines for Air Sampling Methods Utilizing Chromatographic
Analysis"8.
The Guidelines define analytical parameters, specify required laboratory
tests, statistical calculations and acceptance criteria. The analyte air
concentrations throughout this method are based on the recommended
sampling and analytical parameters.
1.2 Detection limit of the overall procedure (DLOP) and
reliable quantitation limit (RQL)
The DLOP is measured as mass
per sample and expressed as equivalent air concentrations, based on the
recommended sampling parameters. Ten samplers were spiked with equal
descending increments of analyte, such that the highest sampler loading
was 9.9 µg of IPAM. This is the amount spiked on a sampler that would
produce a peak at least 10 times the response for a sample blank. These
spiked samplers were analyzed with the recommended analytical
parameters, and the data obtained used to calculate the required
parameters (standard error of estimate (SEE) and slope) for the
calculation of the DLOP. The slope was 2.76×10⁴ and the SEE
was 3000. The RQL is considered the lower limit for precise quantitative
measurements. It is determined from the regression line parameters
obtained for the calculation of the DLOP, providing 75% to 125% of the
analyte is recovered. The DLOP and RQL were 0.326 µg and 1.087 µg,
respectively. The recovery at the RQL was 99.4%.
Table
1.2
Detection Limit of the Overall Procedure
for IPAM
|
mass per
sample
(µg) |
area
counts
(µV-s) |
0.00
0.99
1.98
2.97
3.96
4.95
5.94
6.93
7.92
8.91
9.90 |
9284
32822
61744
90771
120847
147310
174654
196427
223071
258584
281776 |
| |
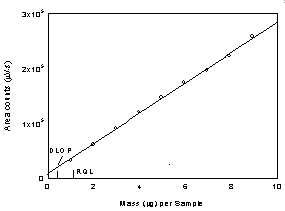
Figure
1.2.1 Plot of data to determine the DLOP/RQL for IPAM at 254
nm using a TO-11. (y = 27600x + 8519; SEE =
300) |
Below is the
chromatogram of the RQL level.
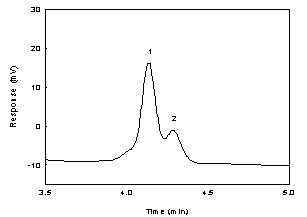
Figure
1.2.2 Chromatogram of the IPAM peak in a standard near the
RQL at 254nm using a TO-11 column. (Key: (1) IPAM; (2)
interference in NITC) | 2. Sampling Procedure
All safety practices that apply
to the work area being sampled should be followed. The sampling equipment
should be attached to the worker in such a manner that it will not
interfere with work performance or safety.
2.1 Apparatus
2.1.1 Samples are collected using a
personal sampling pump calibrated, with the sampling device attached,
to within ±5% of the recommended flow rate.
2.1.2 Samples are
collected with 7-cm × 4-mm i.d. × 7-mm o.d. glass sampling tubes
packed with two sections (80/40 mg) of XAD-2 resin coated with 10% by
weight 1-naphthylisothiocyanate. The sections are held in place and
separated with a glass wool plugs. For this evaluation, commercially
prepared sampling tubes were purchased from SKC, Inc. (catalog no.
226-30-18). 2.2
Reagents
None required.
2.3 Technique
2.3.1 Immediately before sampling,
break off the ends of the flame-sealed tube to provide an opening
approximately half the internal diameter of the tube. Wear eye
protection when breaking ends. Use tube holders to minimize the hazard
of broken glass. All tubes should be from the same lot.
2.3.2
The smaller section of the adsorbent tube is used as a back-up and is
positioned nearest the sampling pump. Attach the tube holder to the
sampling pump so that the adsorbent tube is in an approximately
vertical position with the inlet facing down during sampling. Position
the sampling pump, tube holder and tubing so they do not impede work
performance or safety.
2.3.3 Draw the air to be sampled
directly into the inlet of the tube holder. The air being sampled is
not to be passed through any hose or tubing before entering the
sampling tube.
2.3.4 After sampling for the appropriate time,
remove the adsorbent tube and seal it with plastic end caps. Seal each
sample end-to-end with an OSHA-21 form as soon as
possible.
2.3.5 Submit at least one blank sample with each set
of samples. Handle the blank sample in the same manner as the other
samples except draw no air through it.
2.3.6 Record sample air
volumes (liters), sampling time (minutes) and sampling rate (L/min)
for each sample, along with any potential interferences on the
OSHA-91A form.
2.3.7 Submit the samples to the laboratory for
analysis as soon as possible after sampling. If delay is unavoidable,
store the samples at refrigerator temperature. Ship any bulk samples
separate from the air samples. 2.4 Extraction efficiency
The extraction efficiency
was determined by spiking NITC-coated XAD-2 tubes with IPAM at 0.1 to 2
times the target concentration. These samples were stored overnight at
ambient temperature and then extracted for 30 minutes with shaking, and
analyzed. The mean extraction efficiency over the studied range was
99.5%. The wet extraction efficiency was determined at 1 times the
target concentration by spiking the analyte onto NITC-coated XAD-2 tubes
which had 20-L humid air (absolute humidity of 15.9 mg/L of water, about
80% relative humidity at 22.2 °C) drawn through them immediately before
spiking. The mean recovery for the wet samples was 99.6%.
Table
2.4
Extraction Efficiency (%) of IPAM
|
| level |
|
|
sample number |
|
|
|
× target
concn |
µg per
sample |
1 |
2 |
3 |
4 |
5 |
6 |
mean |
|
0.1
0.25
0.5
1.0
1.5
2.0
1.0
(wet) |
22.2
55.5
111
222
333
444
222 |
100.9
99.7
99.9
100.4
99.0
100.3
100.3 |
99.5
99.5
97.5
100.7
100.1
100.2
99.9 |
98.8
100.1
100.3
98.8
98.9
98.3
98.7 |
97.1
99.1
100.1
100.5
100.1
99.0
99.9 |
98.7
98.3
99.0
98.3
99.0
100.1
99.2 |
99.5
99.6
98.9
100.2
100.4
100.0
99.8 |
99.1
99.4
99.3
99.8
99.6
99.7
99.6 |
|
2.5 Retention
efficiency
Six NITC-coated XAD-2 tubes were spiked with 444 µg
(9.2 ppm) of IPAM and allowed to equilibrate for 4 h. Each spiked tube
was placed in series with a second NITC-coated XAD-2 tube. Each sampling
train had 20-L humid air (absolute humidity of 15.9 mg/L of water, about
80% relative humidity at 22.2°C) pulled through them at 0.1 L/min. The
samples were extracted and analyzed. The mean recovery was 99.6%. There
was no analyte found on the back-up section of any of the tubes or on
the second, back-up tube.
Table 2.5
Retention
Efficiency (%) of IPAM
|
|
|
|
sample number |
|
|
|
| section |
1 |
2 |
3 |
4 |
5 |
6 |
mean |
|
front of spiked tube
rear of
spiked tube
front of series tube
back of series
tube
total |
99.9
0.0
0.0
0.0
99.9 |
98.6
0.0
0.0
0.0
98.6 |
99.0
0.0
0.0
0.0
99.0 |
100.3
0.0
0.0
0.0
100.3 |
99.5
0.0
0.0
0.0
99.5 |
100.4
0.0
0.0
0.0
100.4 |
99.6
0.0
0.0
0.0
99.6 |
|
2.6 Sample
storage
Fifteen NITC-coated XAD-2 tubes were each spiked with 222
µg (4.6 ppm) of IPAM. They were allowed to equilibrate for 4 h, then 20
L of air, with an absolute humidity of 15.7 milligrams of water per
liter of air (about 80% relative humidity at 23°C), was drawn through
them. Three samples were analyzed immediately, and the rest were sealed.
Six were stored at room temperature (23 °C), while the other six were
stored at refrigerated temperature (4 °C). Three samples stored at room
temperature and three samples stored at refrigerated temperature were
analyzed after 7 days and the remaining three after 14 days. The amounts
recovered, indicate good storage stability for the time period
studied.
Table 2.6
Storage Test
for IPAM
|
time
(days) |
ambient |
storage |
recovery
(%) |
|
refrigerated |
storage |
recovery
(%) |
|
0
7
14 |
99.6
98.5
99.8 |
98.7
99.4
98.3 |
100.3
99.9
99.6 |
|
99.6
99.3
99.1 |
98.7
99.9
98.9 |
100.3
99.0
99.8 |
|
2.7 Recommended air
volume and sampling rate
Based on the data collected in this
evaluation, 20-L air samples should be collected at a sampling rate of
0.1 L/min for 200 minutes.
2.8 Interferences (sampling)
2.8.1 There are no known compounds
which will severely interfere with the collection of IPAM. Other
primary and secondary amines will collect on this media, and form
derivatives with the NITC, affecting the ability of the tube to
collect IPAM, so sampling time should be adjusted if high
concentrations of amines are expected.
2.8.2 Suspected
interferences should be reported to the laboratory with submitted
samples. 3.
Analytical Procedure
Adhere to the rules
set down in your Chemical Hygiene Plan. Avoid skin contact and inhalation
of all chemicals and review all appropriate MSDSs.
3.1 Apparatus
3.1.1 A liquid chromatograph equipped
with a UV detector. For this evaluation, a Waters 600 Controller and
pump were used, with a Waters 2487 Dual wavelength absorbance
Detector, and a Waters 717 plus Autosampler was used in this
evaluation.
3.1.2 An LC column capable of separating IPAM from
the desorption solvent and any potential interferences. A 4.6 × 250-mm
column packed with 5µ Bakerbond cyanopropyl (JT Baker, Phillipsburg,
NJ), and a 4.6 × 250-mm column packed with 5µ Pinnacle TO-11
(Bellefonte, PA) were used in the evaluation.
3.1.3 An
electronic integrator or some other suitable means of measuring peak
areas. A Waters Millennium32 Data System was used in this
evaluation.
3.1.4 Glass vials with
poly(tetrafluoroethylene)-lined caps. For this evaluation 4-mL vials
were used.
3.1.5 A dispenser capable of delivering 2.0 mL of
desorbing solvent to prepare standards and samples. If a dispenser is
not available, a 2.0-mL volumetric pipet may be used.
3.1.7
Volumetric flasks - 10-mL and other convenient sizes for preparing
standards. 3.2 Reagents
3.2.1 Isopropylamine, reagent grade.
Aldrich lot 16828HA 99.5% was used in this evaluation.
3.2.2
N,N-Dimethyl formamide, reagent grade.
Fisher 99.5%+ (lot 933764) was used for this evaluation.
3.2.3
1-Naphthylisothiocyanate, reagent grade. Aldrich 95%+ (lot 09925MY)
was used in this evaluation.
3.2.4 Isopropyl alcohol, HPLC
grade. Fisher 99.9% (lot 022995) was used in this
evaluation.
3.2.5 Isooctane, HPLC grade. Fisher 99.0%+ (lot
025050) was used in this evaluation.
3.2.6 Acetonitrile, HPLC
grade. Fisher 99.9%+ (lot 023721) was used in this
evaluation.
3.2.7 Deionized water (DI water), 18 megaohm. A
Barnstead NANOpure Diamond water deionizer was used in this
evaluation.
3.2.8 Phosphoric acid, Baker Analyzed Reagent
grade. Baker 85.9% (lot D25821) was used in this
evaluation.
3.2.9 Mobile phase was 90:10 isooctane:isopropyl
alcohol with the Bakerbond CN column.
3.2.10 Mobile phase was
55:45:0.2 acetonitrile:water:phosphoric acid with the Pinnacle TO-11
column. 3.3 Standard
preparation
3.3.1 Prepare two stock standards. A
stock standard of a concentration of 2 mg/mL may be prepared by
weighing out about 50 mg of NITC in a 10-mL flask, then weigh out 20
mg IPAM placing the drops on top of the NITC in the flask, then weigh
out about 50 mg more NITC on top of the IPAM. Allow the amine to react
with the NITC for 1 hour. Partially fill the volumetric flask with DMF
and allow to sit at least 30 minutes to dissolve the derivative, swirl
to dissolve, and fill to the mark with DMF. Do not place the flask in
a sonic bath to try to get the derivative to go into solution, as this
will destroy the derivative. There must always be an excess of the
NITC for the derivative to be completely formed. There is one amine
group which will react with the NITC, so this mole ratio must be used
in calculating the amount of NITC to be added. For example, the amount
of NITC needed for the above stock standard would be
calculated:
20 mg IPAM × (NITC MW=185.25/IPAM MW=59.08) = 62.7
mg NITC
In the above stock standard preparation a total of 100
mg NITC was weighed out so that an excess of NITC was
present.
3.3.2 Diluted standards are prepared with a solution
of 1 mg/mL NITC in DMF, so that an excess of NITC is always present.
Bracket sample concentrations with working standard concentrations. If
sample concentrations are higher than the concentration range of
prepared standards, either analyze higher standards, or dilute the
sample. The higher standards should be at least as high in
concentration as the highest sample. Diluted samples should be
prepared with a solution of 1 mg/mL NITC in the DMF. The range of
standards used in this study was from 0.5 to 444 µg/mL.
3.4 Sample preparation
3.4.1 Remove the plastic end caps from
the sample tubes and carefully transfer the adsorbent sections to
separate 4-mL vials. Discard the glass tube, urethane foam plug and
glass wool plug.
3.4.2 Add 2.0 mL of DMF to each vial using the
same dispenser as used for preparation of standards.
3.4.3
Immediately seal the vials with poly(tetrafluoroethylene)-lined
caps.
3.4.4 Shake the vials on a shaker for 30 minutes.
3.5 Analysis
3.5.1 Liquid chromatograph
conditions.
LC conditions
reverse phase
|
| column: |
Restek TO-11 5-µ, 4.6 ×
250-mm |
| injection size: |
10 µL |
| mobile phase: |
1.5 mL/min of 55:45:0.2
acetonitrile:water: phosphoric acid |
| detector |
UV at 254 & 280 nm |
| run time: |
30 min |
| retention times: |
4.12 min IPAM
24.2 min
NITC | |
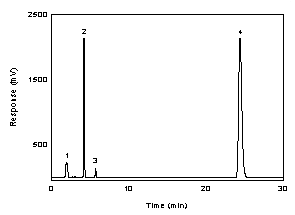
Figure
3.5.1.1 A chromatogram of 222 µg/mL IPAM in DMF with NITC at 254
nm using a TO-11 column. Key: (1) DMF; (2) IPAM; (3)
interference in NITC; and (4) NITC. |
LC conditions normal
phase
|
| column: |
Bakerbond cyanopropyl (CN)
column 5-µ, 4.6 × 250-mm |
| injection size: |
10 µL |
| mobile phase: |
2 mL/min 90:10 isooctane:
isopropyl alcohol |
| detector: |
UV at 254 & 280 nm |
| run time: |
15 min |
| retention times: |
2.71 min NITC
4.83 min
DMF
12.3 min IPAM | |
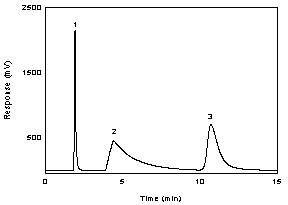
Figure
3.5.1.2 A chromatogram of 222 µg/mL IPAM in DMF with NITC at 254
nm using a Bakerbond CN column. Key: (1) NITC; (2) DMF; and (3)
IPAM. |
3.5.2 Peak areas are measured by an
integrator or other suitable means.
3.5.3 An external
standard (ESTD) calibration method is used. A calibration curve
can be constructed by response of standard injections versus
micrograms of analyte per sample. Bracket the samples with
freshly prepared analytical standards over a range of
concentrations
|
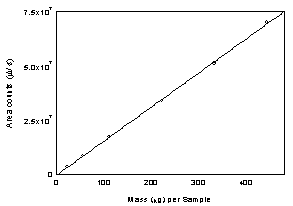
Figure
3.5.3 Calibration curve of IPAM at 254 nm using a TO-11 column.
(Y= 1.57×10⁵ x
-1.86×10⁵) | 3.6 Interferences (analytical)
3.6.1 Any compound that produces a LC
response and has a similar retention time as the analyte is a
potential interference. If any potential interferences were reported,
they should be considered before samples are extracted. Generally,
chromatographic conditions can be altered to separate an interference
from the analyte.
3.6.2 When necessary, the identity or purity
of an analyte peak may be confirmed by a photodiode array scan of the
peak, by wavelength ratioing, or by LC-mass spec.
3.7 Calculations
The amount of
analyte per sampler is obtained from the appropriate calibration curve
in terms of micrograms per sample, uncorrected for extraction
efficiency. This total amount is then corrected by subtracting the total
amount (if any) found on the blank. The air concentration is calculated
using the following formulas.
 |
where |
CM is
concentration by weight (mg/m³)
M is
micrograms per sample
V is liters of
air sampled
EE is
extraction efficiency, in decimal form
|
 |
where |
CV is concentration by volume
(ppm)
VM is molar volume at 25°C and 1 atm =
24.46
CM is concentration
by weight
Mr is molecular
weight = 59.08 | 4. Recommendations for further study
Collection,
reproducibility, and other detection limit studies need to be performed to
make this a validated method.
1. OSHA Sampling and Analytical Methods. http://www.osha-slc.gov/ (accessed
3/25/2003).
2. Documentation of the Threshold
Limit Values (TLVs) and Biological Exposure indices (BEIs), 6th
edition, American Conference of Governmental Industrial Hygienists Inc,
Cincinnati OH, 1991, p 831.
3. Lewis, R., Ed, Hawley’s Condensed Chemical Dictionary, John Wiley
& Sons: New York, 2001, p 630.
4. Documentation of the Threshold Limit Values (TLVs) and
Biological Exposure indices (BEIs), 6th edition, American
Conference of Governmental Industrial Hygienists Inc, Cincinnati OH, 1991,
p 831.
5. Documentation of the Threshold Limit
Values (TLVs) and Biological Exposure indices (BEIs), 6th edition,
American Conference of Governmental Industrial Hygienists Inc, Cincinnati
OH, 1991, p 831.
6. Lewis, R., Ed, Hawley’s
Condensed Chemical Dictionary, John Wiley & Sons: New York,
2001, p 630.
7. OSHA Chemical Sampling Information http://www.osha-slc.gov/ (accessed
3/25/2003).
8. Burright, D.; Chan, Y.; Eide, M.; Elskamp, C.;
Hendricks, W.; Rose, M. C. Evaluation Guidelines for
Air Sampling Methods Utilizing Chromatographic Analysis; OSHA Salt
Lake Technical Center, U.S. Department of Labor: Salt Lake City, UT,
1999.
|

