![]()
HALOTHANE
ISOFLURANE
| Method number: | 103 | |||||||||||||||||||||||||||||||||||||||||||||||||
| Matrix: | Air | |||||||||||||||||||||||||||||||||||||||||||||||||
| Target concentration, TC: |
| |||||||||||||||||||||||||||||||||||||||||||||||||
| OSHA PEL: ACGIH TLV: |
None 75 ppm (566 mg/m3) for enflurane 50 ppm (403 mg/m3) for halothane | |||||||||||||||||||||||||||||||||||||||||||||||||
| Procedure: | Samples are collected by drawing a known volume of
air through standard size (6-mm o.d., 150/75 mg) Anasorb CMS or
(6-mm o.d., 140/70 mg) Anasorb 747 tubes. Samples are desorbed with
| |||||||||||||||||||||||||||||||||||||||||||||||||
| Air volume and sampling rate: |
12 L at 0.05 L/min | |||||||||||||||||||||||||||||||||||||||||||||||||
| Reliable quantitation limit: |
| |||||||||||||||||||||||||||||||||||||||||||||||||
| Standard error of estimate at the target concentration: |
| |||||||||||||||||||||||||||||||||||||||||||||||||
| Special requirements: | Samples collected on Anasorb CMS for halothane should be stored at reduced temperature following receipt at the laboratory until analysis. | |||||||||||||||||||||||||||||||||||||||||||||||||
| Status of method: | Evaluated method. This method has been subjected to the established evaluation procedures of the Organic Methods Evaluation Branch. | |||||||||||||||||||||||||||||||||||||||||||||||||
| Date: May 1994 | Chemist: Donald Burright | |||||||||||||||||||||||||||||||||||||||||||||||||
OSHA Salt Lake Technical Center
Salt Lake City, UT 84165-0200
1. General Discussion
- 1.1 Background
- 1.1.1 History
The objective of this method is to eliminate the need to use two adsorbent tubes connected in series as specified for enflurane and halothane in OSHA Method 29 (Ref. 5.1), and to expand the methodology to include the newer anesthetic gases, isoflurane and desflurane. (Desflurane will appear as a separate method because it requires different analytical conditions.) Enflurane, halothane and isoflurane were each evaluated at two target concentrations because NIOSH recommended exposure limits (Refs. 5.2 and 5.3) are considerably lower than the current ACGIH TLVs (Ref. 5.4). For this reason, the method was evaluated at a lower target concentration of 1 ppm for all three analyses. Currently there are no OSHA PELs for these substances. Preliminary studies were performed with the following adsorbents: Anasorb CMS, Anasorb 747, Carbosieve S-III and activated coconut charcoal. Anasorb CMS and Anasorb 747 were both good candidates for an improved sampler as neither adsorbent required two tube in series. Evaluation tests were begun with both adsorbents in the anticipation that one would dearly surpass the other in performance. Since this did not occur, both were evaluated and are presented as sampling options.
ACGIH has recommended a
1.1.2 Toxic effects (This section is for information only and should not be taken as the basis of OSHA policy.)
Current scientific evidence obtained from human and animal studies suggest that chronic exposure to anesthetic gases increase the risk of both spontaneous abortion and congenital abnormalities in offspring among female workers and wives of male workers. Risks of hepatic and renal diseases are also increased among exposed workers. (Ref 5.2) IARC states there is inadequate evidence for the carcinogenicity of enflurane, halothane and isoflurane in both animals and humans (Ref. 5.5).
Enflurane and isoflurane have similar health effects for acute exposure. An exposure may cause irritation and redness in eyes, dryness and irritation of skin, and irritation of the mouth and throat. If inhaled, headaches, dizziness, drowsiness, unconsciousness, and death can occur. (Refs. 5.6 and 5.7)
Acute exposures of halothane can cause severe irritation to the eyes, irritation of the skin, reduction of the blood pressure, dizziness, drowsiness, and unconsciousness. Chronic exposures can possibly cause cancer. (Ref. 5.8)
1.1.3 Workplace exposure
Enflurane, halothane and isoflurane are the most commonly used organic anesthetic gases. Occupational exposure may occur whenever anesthetics are used in operating rooms, dental offices and veterinary hospitals. The number of people potentially exposed was estimated to be 215,000 in 1977 (Ref. 5.2). This number is probably much higher today if the increase in the health care industry since 1977 is considered.
1.1.4 Physical properties and other descriptive information (Refs. 5.6 - 5.9)
| enflurane | halothane | isoflurane | |
| CAS number: | 13838-16-9 | 151-67-7 | 26675-46-7 |
| molecular weight: | 184.49 | 197.39 | 184.49 |
| boiling point, °: | 56.5 | 50.2 | 48.5 |
| color: | colorless | colorless | colorless |
| specific gravity: | 1.52 | 1.872 | 1.50 |
| molecular formula: | C3H2OClF5 | C2HBrClF3 | C3H2OClF5 |
| vapor pressure, kPa (mmHg): |
25.1(188.6) @22°C |
32.4(243.3) @20°C |
34.9(261.8) @22°C |
| odor: | odorless | mild ethereal | |
| flash point, °: | >200 | none | >200 |
| solubility: | miscible with organic solvents |
miscible with pet ether and other fat solvents |
miscible with organic liquids |
| synonyms: | Ethrane;
1,1,2-trifluoroethyl difluoromethyl ether; flurether; Efrane; Alyrane |
Fluothrane; 2-bromo-2-chloro- 1,1,1-trifluoro- ethane; Rhodialothan |
Forane;
2,2,2-trigluoroethyl difluoromethyl ether; Forene |
| structural formulas: |  | ||
The analyte air concentrations throughout this method are based on the recommended sampling and analytical parameters. Air concentrations listed in ppm are referenced to 25° and 101.3 kPa (760 mmHg).
- 1.2 Limit defining parameters
- 1.2.1 Detection limit of the analytical procedure
The detection limits of the analytical procedure are 92.8, 87.3 and 44.7 pg for enflurane, halothane and isoflurane respectively. These are the amounts of each analyte that will give a response that is significantly different from the background response of a reagent blank. (Sections 4.1 and 4.2)
1.2.2 Detection limit of the overall procedure
The detection limits of the overall procedure (mass per sample) are listed below. These are the amounts of each analyte spiked on the sampler that will give a response that is signfticantly different from the background response of a sampler blank. (Sections 4.1 and 4.3)
| Table 1.2.2 | |||
| Detection Limits of the Overall Procedure | |||
|
| |||
| adsorbent enflurane halothane isoflurane | |||
|
| |||
| Anasorb CMS | 0.679 µg | 0.709 µg | 0.625 µg |
| 7.50 ppb | 7.32 ppb | 6.91 ppb | |
| 56.6 µg/m3 | 59.1 µg/m3 | 52.1 µg/m3 | |
| Anasorb 747 | 1.105 µg | 0.620 µg | 0.639 µg |
| 12.2 ppb | 6.40 ppb | 7.06 ppb | |
| 92.1 µg/m3 | 51.7 µg/m3 | 53.3 µg/m3 | |
|
| |||
1.2.3 Reliable quantitation limit
The reliable quantitation limits (mass per sample) are listed below. These are the amounts of analyses spiked on a sampler that will give a signal that is considered the lower limit for precise quantitative measurements. (Section 4.4)
| Table 1.2.3 | |||
| Reliable Quantitation Limits | |||
|
| |||
| adsorbent | enflurane | halothane | isonurane |
|
| |||
| Anasorb CMS | 2.26 µg | 2.36 µg | 2.08 µg |
| 25.0 ppb | 24.4 ppb | 23.0 ppb | |
| 188 µg/m3 | 197 µg/m3 | 173 µg/m3 | |
| Anasorb 747 | 3.68 µg | 2.07 µg | 2.13 µg |
| 40.7 ppb | 21.4 ppb | 23.5 ppb | |
| 307 µg/m3 | 172 µg/m3 | 178 µg/m3 | |
|
| |||
1.2.4 Precision (analytical Procedure)
The precisions of the analytical procedure are measured as the pooled relative standard deviation over a concentration range equivalent to the range of 0.5 to 2 times the target concentration. (Section 4.5)
| Table 1.2.4 | |||
| Precisions of the Analytical Procedure, % | |||
|
| |||
| target concn | enflurane | halothane | isoflurane |
| 1 ppm | 2.77 | 1.39 | 3.50 |
| 50 ppm | 1.37 | ||
| 75 ppm | 2.27 | 2.83 | |
|
| |||
1.2.5 Precision (overall procedure)
The precisions of the overall procedure at the 95% confidence
level for the ambient temperature
| Table 1.2.5.1 | |||
| Precision of the Overall Procedure on Anasorb CMS, % | |||
|
| |||
| target concn | enflurane | halothane | isoflurane |
|
| |||
| 1 ppm | 14.1 | 14.9‡ | 15.3 |
| 50 ppm | 13.7 | ||
| 75 ppm | 16.3 | 16.6 | |
|
| |||
| ‡ - refrigerated storage test at 4° | |||
| Table 1.2.5.2 | |||
| Precision of the Overall Procedure on Anasorb 747, % | |||
|
| |||
| target concn | enflurane | halothane | isoflurane |
|
| |||
| 1 ppm | 11.3 | 10.6 | 11.5 |
| 50 ppm | 11.4 | ||
| 75 ppm | 15.1 | 12.0 | |
|
| |||
1.2.6 Recovery
The recoveries of enflurane, halothane and isoflurane from
samples used in the
| Table 1.2.6.1 | |||
| Recovery from Anasorb CMS, % | |||
|
| |||
| target concn | enflurane | halothane | isoflurane |
|
| |||
| 1 ppm | 94.6 | 97.1‡ | 93.7 |
| 50 ppm | 94.5 | ||
| 75 ppm | 96.2 | 97.2 | |
|
| |||
| ‡ - refrigerated storage test at 4° | |||
| Table 1.2.6.2 | |||
| Recovery from Anasorb 747, % | |||
|
| |||
| target concn | enflurane | halothane | isoflurane |
|
| |||
| 1ppm | 99.6 | 99.8 | 98.7 |
| 50 ppm | 99.3 | ||
| 75 ppm | 98.0 | 97.9 | |
|
| |||
1.2.7 Reproducibility
Forty-eight samples collected from controlled test atmospheres,
along with a draft copy of this procedure, were submitted for
analysis by one of the OSHA Salt Lake Technical Center's service
branch laboratories. The samples were analyzed after
2. Sampling Procedure
- 2.1 Apparatus
- 2.1.1
Samples are collected using a personal sampling pump calibrated, with the sampling device attached, within ±5% at the recommended flow rate.
2.1.2 Samples are collected with
2.2 Reagents
None required.
2.3 Technique
- 2.3.1 Only properly trained personnel can sample in an operating
room or dental office, this is necessary to be in compliance with
OSHA's Exposure Control Plan for bloodborne pathogens. (Ref. 5.10)
2.3.2 Immediately before sampling, break off the ends of the sampling tube. All tubes should be from the same lot.
2.3.3 Attach the sampling tube to the sampling pump with
flexible,
2.3.4 Air being sampled should not pass through any hose or tubing before entering the sampling tube.
2.3.5 To avoid channeling, attach the sampler vertically with the larger section pointing downward, in the worker's breathing zone. Position the sampler so it does not impede work performance or safety.
2.3.6 After sampling for the appropriate time, immediately remove the sampling tube and seal it with plastic end caps.
2.3.7 In order to prevent occupational exposure to SLTC personnel, sampling tubes that may become contaminated with blood or other potentially infectious materials are to be examined prior to shipping and decontaminated (e.g., wiped off with bleach or other disinfectant) as necessary. Contaminated items are not to be placed or stored in areas where food is kept, and decontamination should be accomplished as soon as possible following the inspection where contamination occurred. Decontamination is not to take place in any area where food or drink is consumed. (Ref. 5.10)
2.3.8 Wrap each sample
2.3.9 Submit at least one blank sample with each set of samples. Handle the blank sampling tube
in the same manner as the other samples, except draw no air through it.
2.3.10 Record sample air volumes (in liters) for each sample, along with any potential interferences.
2.3.11 Ship any bulk sample(s) in a container separate from the air samples.
2.3.12 Submit the samples to the laboratory for analysis as soon as possible after sampling. If delay is unavoidable, store the samples at reduced temperature.
2.4 Sampler capacity
Sampler capacity is determined by measuring how much air can be sampled before the analyte breaks through the sampler, i.e., the sampler capacity is exceeded. Breakthrough is considered to
occur when the effluent from the sampler contains a concentration
of analyte that is 5% of the upstream concentration (5% breakthrough).
Testing for breakthrough was performed by using an FID to monitor the
effluent from sampling tubes containing only either the
| Table 2.4 | |||
| Sampler Capacity | |||
|
| |||
| analyte | atmospheric | Anasorb | Anasorb |
| concentration | CMS | 747 | |
|
| |||
| enflurane | 165 ppm | 28.8 L | 14.2 L |
| (1247 mg/m3) | |||
| halothane | 93 ppm | 15.8 L | 19.9 L |
| (753 mg/m3) | |||
| isoflurane | 165 ppm | 24.0 L | 17.5 L |
| (1246 mg/m3) | |||
|
| |||
2.5 Desorption efficiency
- 2.5.1 The average desorption efficiencies for the analyses from
the sampling media over the range of 0.5 to 2.0 times the target
concentrations (TC) are listed below. (Section 4.10)
| Table 2.5.1 | ||||
| Desorption Efficiencies, % | ||||
|
| ||||
| analyte | Anasorb CMS | Anasorb 747 | ||
| low TC | high TC | low TC | high TC | |
|
| ||||
| enflurane | 100.3 | 99.8 | 103.7 | 100.5 |
| halothane | 99.7 | 99.5 | 99.6 | 99.3 |
| isoflurane | 99.4 | 99.2 | 100.8 | 100.2 |
|
| ||||
2.5.2 The desorption efficiencies at 0.05, 0.1 and 0.2 times the target concentrations (TC) were found to be very high and are listed below. (Section 4.10)
| Table 2.5.2.1 | ||||||
| Desorption Efficiencies at 0.05 to 0.2 times Low TC, % | ||||||
|
| ||||||
| analyte | Anasorb CMS | Anasorb 747 | ||||
| 0.05×Tc | 0.1×TC | 0.2×TC | 0.05×TC | 0.1×TC | 0.2×TC | |
|
| ||||||
| enflurane | 100.2 | 100.4 | 99.5 | 101.3 | 99.0 | 99.0 |
| halothane | 99.6 | 100.5 | 99.8 | 84.3 | 92.6 | 94.7 |
| isoflurane | 99.3 | 98.4 | 99.9 | 96.8 | 100.0 | 101.1 |
|
| ||||||
| Table 2.5.2.2 | ||||||
| Desorption Efficiencies at 0.05 to 0.2 times High TC, % | ||||||
|
| ||||||
| analyte | Anasorb CMS | Anasorb 747 | ||||
| 0.05×TC | 0.1×TC | 0.2×TC | 0.05×TC | 0.1×TC | 0.2×TC | |
|
| ||||||
| enflurane | 100.1 | 99.8 | 99.8 | 100.2 | 100.0 | 100.3 |
| halothane | 99.3 | 98.9 | 98.5 | 99.6 | 98.6 | 100.4 |
| isoflurane | 100.0 | 99.3 | 99.2 | 98.0 | 97.2 | 99.0 |
|
| ||||||
2.5.3 Desorbed samples remain stable for at least 22.5 h.
2.6 Recommended air volume and sampling rate
- 2.6.1 For
2.6.2 For
2.6.3 When
| Table 2.6.3 | ||||||
| Reliable Quantitabon Limits at 0.75 L | ||||||
|
| ||||||
| adsorbent | enflurane | halothane | isoflurane | |||
|
| ||||||
| Anasorb CMS | 2.26 µg | 2.36µg | 2.08 µg | |||
| 399 ppb | 390 ppb | 368 ppb | ||||
| 3013 µg/m3 | 3147 µg/m3 | 2773 µg/m3 | ||||
| Anasorb 747 | 3.68 µg | 2.07 µg | 2.13 µg | |||
| 651 ppb | 342 ppb | 377 ppb | ||||
| 4707 µg/m3 | 2760 µg/m3 | 2840 µg/m3 | ||||
|
| ||||||
2.7 Interferences (sampling)
- 2.7.1 It is not known if any compounds will severely interfere
with the collection of enflurane, halothane and isoflurane on
Anasorb CMS or Anasorb 747. In general, the presence of other
contaminant vapors in the air will reduce the capacity of Anasorb
CMS or Anasorb 747 to collect the three analyses.
2.7.2 Nitrous oxide was tested as an interferant to the collection of halothane and it does not interfere. (Section 4.12)
2.7.3 Suspected interferences should be reported to the laboratory with submitted samples.
2.8 Safety precautions (sampling)
- 2.8.1 The sampling equipment should be attached to the worker in
such a manner that it will not interfere with work performance or
safety.
2.8.2 All safety practices that apply to the work area being sampled should be followed.
2.8.3 Protective eyewear should be worn when breaking the ends of the glass sampling tubes.
3. Analybcal Procedure
- 3.1 Apparatus
- 3.1.1 Gas chromatograph equipped with an FID. For this
evaluation, a
3.1.2 A GC column capable of separating the analyte of interest
from the desorption solvent, internal standard and any
interferences. A
3.1.3 An electronic integrator or some other suitable means of measuring peak areas. A Waters 860 Networking Computer System was used in this evaluation.
3.1.4
3.1.5 A dispenser capable of delivering 1.0 mL of desorbing solvent to prepare standards and samples. If a dispenser is not available, a 1.0-mL volumetric pipes may be used.
3.2 Reagents
Enflurane, USP. The enflurane used in this evaluation was manufactured by Anequest (Madison, WI), and purchased from a local hospital.
- 3.2.2 Halothane, reagent grade or better. The halothane used in
this evaluation was purchased from Aldrich Chemical (Milwaukee, WI).
3.2.3 Isoflurane, USP. The isoflurane used in this evaluation was manufactured by Anequest (Madison, WI), and purchased from a local hospital.
3.2.4 Carbon disulfide
3.2.5 A suitable internal standard, reagent grade. The n-decane used in this evaluation was purchased from ICN Pharmaceuticals, Inc. (Plainview, NY).
3.2.6 Desorption solvent. The desorption solvent contains 500
µL of n-decane per 1 L of
3.2.7 GC grade nitrogen, air, and hydrogen.
3.2.8 Toluene, chromatographic grade or better. The toluene used in this evaluation was Optima Grade and was purchased from Fisher Scientific (Fair Lawn, NJ).
3.3 Standard preparation
- 3.3.1 Prepare concentrated stock standard of enflurane,
halothane and isoflurane in toluene. Prepare working analytical
standards by injecting microliter amounts of concentrated stock
standards into
3.3.2 Bracket sample concentrations with working standard concentrations. If samples fall outside the concentration range of prepared standards, prepare and analyze additional standards or dilute the sample.
3.4 Sample preparation
- 3.4.1 Remove the plastic end caps from the sample tube and
carefully transfer each section of the adsorbent to separate
3.4.2 Add 1.0 mL of desorption solvent to each vial using the same dispenser as used for preparation of standards.
3.4.3 Immediately seal the vials with
3.4.4 Shake the vials vigorously several times during the next 30 min.
3.5 Analysis
- 3.5.1 Analytical conditions
| GC conditions | |
| zone temperatures: |
60° (column) 250° (injector) 300° (detector) |
| run time: | 15 min |
| column gas flow: | 1.2 mL/min (hydrogen) |
| septum purge: | 1.5 mL/min (hydrogen) |
| injector size: | 1.0 µL (11.3:1 split) |
| column: | 60-m × 0.32-mm i.d. capillary
|
| retention times: | 5.50 min (isoflurane) 5.97 min (halothane) 6.51 min (enflurane) 8.34 min (n-decane) |
| FID conditions | |
| hydrogen flow: | 34 mL/min |
| air flow: | 450 mL/min |
| makeup flow: | 33 mL/min (nitrogen) |
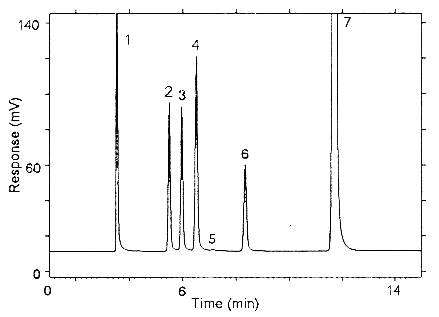
Figure 3.5.1.1. Chromatogram obtained at the high TC with the
recommended condibons. Peak identification: (1) carbon disutfide,
(2) isoflurane, (3) halothane, (4) enflurane, (5) benzene -
contaminant in 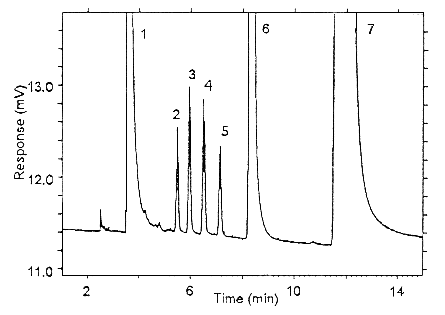
Figure 3.5.1.2. Chromatogram obtained at the low TC with the
recommended conditions. Peak identification: (1) carbon disulfide,
(2) isoflurane, (3) halothane, (4) enflurane, (5) benzene -
contaminant in
3.5.2 An internal standard (ISTD) calibration method is used. A
calibration curve can be constructed by plotting micrograms of
analyte per sample versus
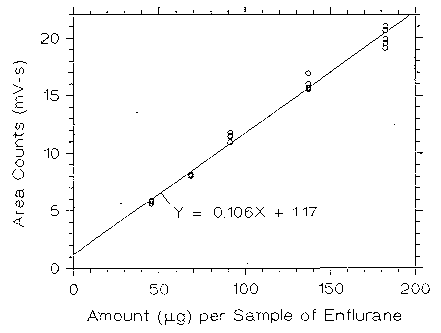
Figure 3.5.2.1. Calibrabon curve of enflurane at low TC made from
data of Table 4.5.1. 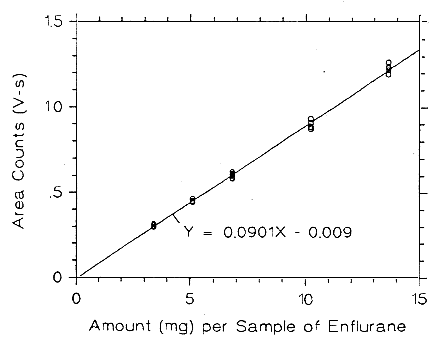
Figure 3.5.2.2. Calibrabon curve of enflurane at high TC made
from data of Table 4.5.2. 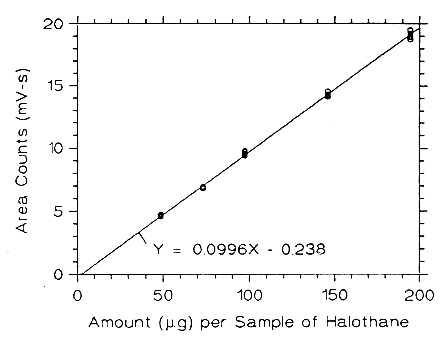
Figure 3.5.2.3. Calibrabon curve of halothane at low TC made from
data of Table 4.5.3. 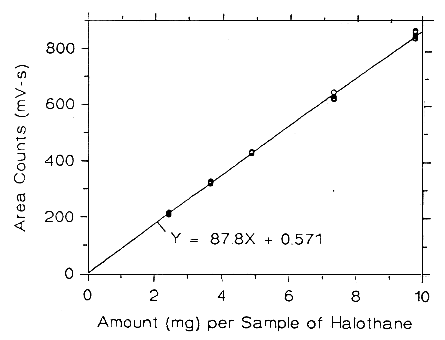
Figure 3.5.2.4. Calibration curve of halothane at high TC made
from data of Table 4.5.4. 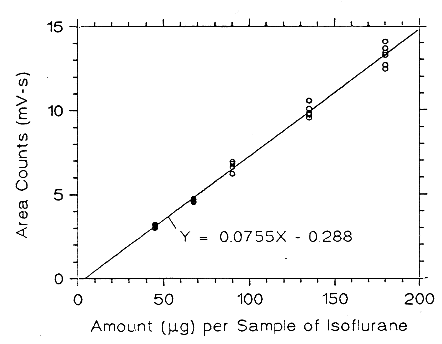
Figure 3.5.2.5. Calibration curve of isoflurane at low TC made
from data of Table 4.5.5. 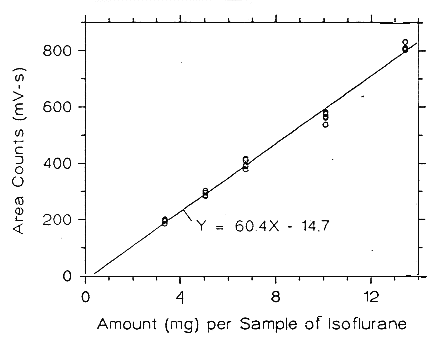
Figure 3.5.2.6. Calibration curve of isoflurane at high TC made from data of Table 4.5.6.
3.6 Interferences (analytical)
- 3.6.1 Any compound that produces an FID response and has a
similar retention time as the analyses or internal standard is a
potential interference. If any potential interferences were
reported, they should be considered before the samples are desorbed.
3.6.2 Generally, chromatographic conditions can be altered to separate an interference from the analyte.
3.6.3 When necessary, the identity or purity of an analyte peak may be confirmed with additional analytical data. (Section 4.11)
3.7 Calculations
The amount of analyte per sampler is obtained from the appropriate calibration curve in terms of micrograms per sample, uncorrected for desorption efficiency. The back (70-75 mg) section is analyzed primarily to determine if there was any breakthrough from the front (140-150 mg) section during sampling. If a significant amount of analyte is found on the back section (e.g., greater than 25% of the amount found on the front section), this fact should be reported with the sample results. If any analyte is found on the back section, it is added to the amount on the front section. This amount is then corrected by subtracting the total amount (if any) found on the blank. The air concentration is calculated using the following formulae.
| mg/m3 = | micrograms of analyte per sample
liters of air sampled × desorption efficiency |
| ppm = | 24.46 × mg/m3
molecular weight of analyte |
| where | 24.46 is the molar volume at 25° and 101.3 kPa (760 mmHg) |
| 184.49 = molecular weight of enflurane and isoflurane | |
| 197.39 = molecular weight of halothane |
3.8 Safety precautions (analytical)
- 3.8.1 Adhere to the rules set down in your Chemical Hygiene
Plan.
3.8.2 Avoid skin contact and inhalation of all chemicals.
3.8.3 Wear safety glasses, gloves and a lab coat at all ffmes while in the laboratory areas.
4. Backup Data
- 4.1 Determination of detection limits
Detection limits, in general, are defined as the amount (or
concentration) of analyte that gives a response
The measurement of YBR and

| Yobs = | observed response |
| Yest = | estimated response from regression curve |
| n = | total number of data points |
| k = | 2 for linear regression curve |
At point YDL on the regression curve
| YDL - A(DL) + YBR | A = analytical sensitivity (slope) |
therefore
| DL = | (YDL - YBR)
A |
Substituting 3(SEE) + YBR for YDL gives
| DL = | 3(SEE)
A |
4.2 Detection limit of the analytical procedure (DW)
The DW is measured as the mass of analyte actually introduced into the chromatographic columns. Ten analytical standards were prepared in equal descending increments with the highest standard containing 10.02, 10.68 and 9.89 µg/mL of enflurane, halothane and isoflurane respecffvely. This is the concentration that would produce a peak approximately 10 times the baseline noise of a reagent blank near the elution time of the analyte. These standards, and the reagent blank, were analyzed with the recommended analytical parameters (1-µL injection with a 11.3:1 split), and the data obtained were used to determine the required parameters (A and SEE) for the calculation of the DLAP.
| Table 4.2.1 | ||
| DLAP Data for Enflurane | ||
| A = 3.81 SEE = 117.9 | ||
|
| ||
| concentration | mass on column | area counts |
| (µg/mL) | (pg) | (µV-s) |
|
| ||
| 0 | 0 | 0 |
| 0.956 | 84.4 | 455 |
| 1.90 | 168 | 840 |
| 2.84 | 251 | 1002 |
| 3.77 | 333 | 1145 |
| 5.60 | 494 | 2090 |
| 6.50 | 574 | 2105 |
| 7.39 | 653 | 2610 |
| 8.28 | 731 | 2869 |
| 9.15 | 808 | 3041 |
| 10.02 | 884 | 3519 |
|
| ||
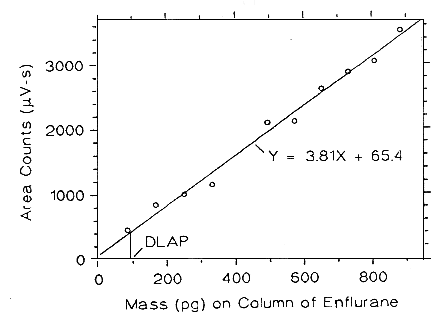
Figure 4.2.1 Plot of the data from Table 4.2.1 to determine the DLAP of enflurane, DLAP = 92.8 pg.
| Table 4.2.2 | ||
| DLAP Data for Halothane | ||
| A = 4.08 SEE = 118.7 | ||
|
| ||
| concentration | mass on column | area counts |
| (µg/mL) | (pg) | (µV-s) |
|
| ||
| 0 | 0 | 0 |
| 1.02 | 90 | 413 |
| 2.03 | 179 | 916 |
| 3.03 | 267 | 1219 |
| 5.97 | 527 | 2366 |
| 6.93 | 612 | 2501 |
| 7.88 | 696 | 2907 |
| 8.82 | 779 | 3219 |
| 9.76 | 861 | 3416 |
| 10.68 | 943 | 4035 |
|
| ||
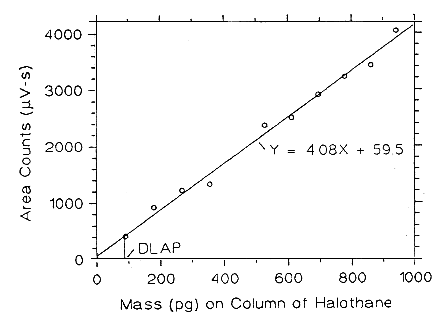
Figure 4.2.2. Plot of the data from Table 4.2.2 to determine the DW of halothane, DLAP = 87.3 pg.
| Table 4.2.3 | ||
| DLAP Data for Isoflurane | ||
| A = 2.34 SEE = 34.90 | ||
|
| ||
| concentration | mass on column | area counts |
| (µg/mL) | (pg) | (µV-s) |
|
| ||
| 0 | 0 | 0 |
| 0.944 | 83 | 288 |
| 1.88 | 166 | 421 |
| 2.80 | 247 | 627 |
| 3.72 | 328 | 794 |
| 5.53 | 488 | 1230 |
| 6.41 | 566 | 1307 |
| 7.30 | 644 | 1537 |
| 8.17 | 721 | 1711 |
| 9.03 | 797 | 1921 |
| 9.89 | 873 | 2090 |
|
| ||
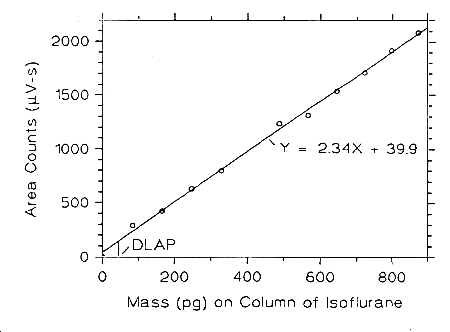
Figure 4.2.3 Plot of the data from Table 4.2.3 to determine the DLAP of isoflurane, DLAP = 44.7 pg.
4.3 Detection limit of the overall procedure (DLOP)
The DLOP is measured as mass per sample and expressed as equivalent air concentration, based on the recommended sampling parameters. Ten samplers were spiked with equal descending increments of analyte, such that the highest sampler loading was 9.15, 9.76 and 9.03 µg/sample of enflurane, halothane and isoflurane respectively. This is the amount, when spiked on a sampler, that would produce a peak approximately 10 times the baseline noise for a sample blank. These spiked samplers, plus a sample blank, were analyzed with the recommended analytical parameters, and the data obtained used to calculate the required parameters (A and SEE) for the calculation of the DLOP.
| Table 4.3.1 | ||
| DLOP Data for Enflurane | ||
|
| ||
| mass per | area counts on | area counts on |
| sample | Anasorb CMS | Anasorb 747 |
| (µg) | (µV-s) | (µV-s) |
|
| ||
| 0.956 | 441 | 292 |
| 1.90 | 651 | 735 |
| 2.84 | 1042 | 1109 |
| 3.77 | 1423 | 1449 |
| 4.69 | 1618 | 1690 |
| 5.60 | 1858 | 1786 |
| 6.50 | 2084 | 2430 |
| 7.39 | 2378 | 2393 |
| 8.28 | 2635 | 2749 |
| 9.15 | 3035 | 3238 |
|
| ||
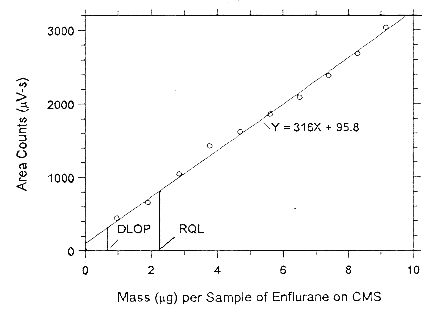
Figure 4.3.1.1. Plot of the data to determine the DLOP of enflurane
on Anasorb CMS, (SEE = 71.55). 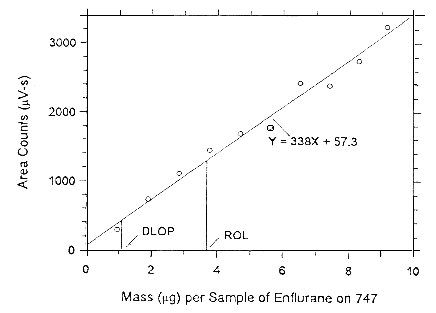
Figure 4.3.1.2. Plot of the data to determine the DLOP of enflurane on Anasorb 747, (SEE = 124.5).
| Table 4.3.2 | ||
| DLOP Data for Halothane | ||
|
| ||
| mass per | area counts on | area counts on |
| sample | Anasorb CMS | Anasorb 747 |
| (µg) | (µV-s) | (µV-s) |
|
| ||
| 0 | 0 | 0 |
| 1.02 | 512 | 382 |
| 2.03 | 761 | 812 |
| 3.03 | 1224 | 1263 |
| 4.02 | 1554 | 1670 |
| 5.00 | 1870 | 1999 |
| 5.97 | 2192 | 2481 |
| 6.93 | 2526 | 2795 |
| 7.88 | 2721 | 3059 |
| 8.82 | 3288 | 3319 |
| 9.76 | 3677 | 3761 |
|
| ||
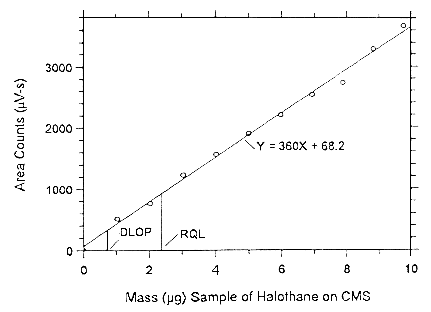
Figure 4.3.2.1. Plot of the data to determine the DLOP of halothane
on Anasorb CMS, (SEE = 85.02). 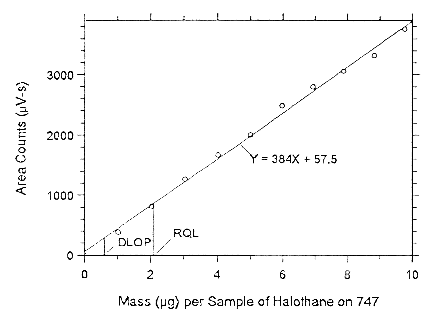
Figure 4.3.2.2 Plot of the data to determine the DLOP of halothane on Anasorb 747, (SEE = 79.37).
| Table 4.3.3 | ||
| DLOP Data for Isodurane | ||
|
| ||
| mass per | area counts on | area counts on |
| sample | Anasorb CMS | Anasorb 747 |
| (µg) | (µV-s) | (µV-s) |
|
| ||
| 0 | 0 | 0 |
| 0.944 | 274 | 245 |
| 1.88 | 444 | 442 |
| 2.80 | 654 | 630 |
| 3.72 | 845 | 813 |
| 4.63 | 963 | 1041 |
| 5.53 | 1195 | 1088 |
| 6.41 | 1349 | 1326 |
| 7.30 | 1564 | 1488 |
| 8.17 | 1622 | 1615 |
| 9.03 | 1877 | 1825 |
|
| ||
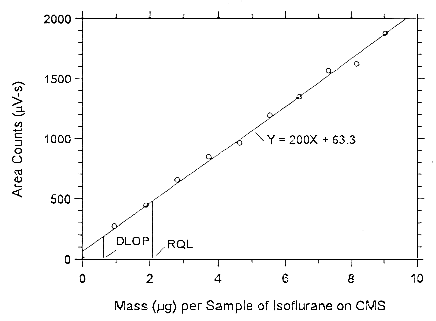
Figure 4.3.3.1. Plot of the data to determine the DLOP of
isoflurane on Anasorb CMS, (SEE = 41.65). 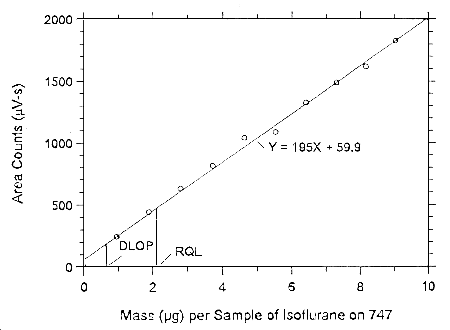
Figure 4.3.3.2. Plot of the data to determine the DLOP of isoflurane on Anasorb 747, (SEE = 41.51).
4.4 Reliable quantitation limit (RQL)
The RQL is considered the lower limit for precise quantitative measurements. It is determined from the regression line parameters obtained for the calculations of the DLOP (Section 4.3), providing at least 75% of the analyte is recovered. The RQL is defined as the amount of analyte that gives a response (YRQL) such that
therefore
| RQL = | 10(SEE)
A |
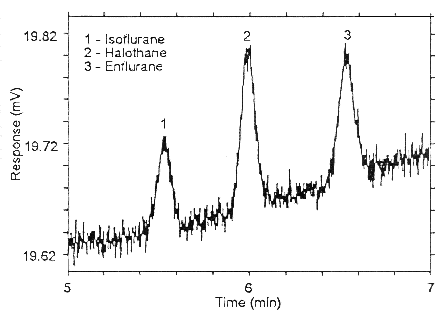
Figure 4.4.1. Chromatogram of the RQL for all three analyses on
Anasorb CMS. 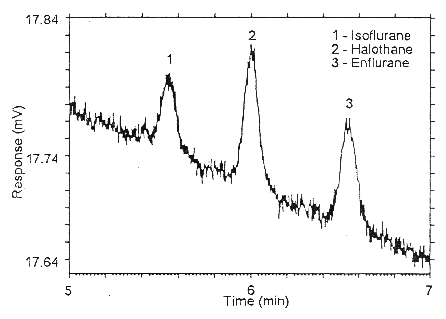
Figure 4.4.2. Chromatogram of the RQL for halothane and isoflurane
on Anasorb 747. 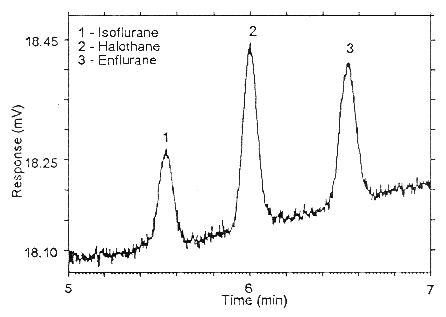
Figure 4.4.3. Chromatogram of the RQL for enflurane on Anasorb 747.
| Table 4.4 | |||
| Reliable Quantitation Limits | |||
|
| |||
| adsorbent | enflurane | halothane | isoflurane |
|
| |||
| Anasorb CMS | 2.26 µg | 2.36 µg | 9 2.08 µg |
| 225 ppb | 219 ppb | 207 ppb | |
| 1695 µg/m3 | 1770 µg/m3 | 1560µg/m3 | |
| 91.7% | 95.9% | 104.1% | |
| Anasorb 747 | 3.68 µg | 2.07 µg | 2.13 µg |
| 366 ppb | 192 ppb | 212 ppb | |
| 2760 µg/m3 | 1553 µg/m3 | 1598 µg/m3 | |
| 109.2% | 102.9% | 103.6% | |
|
| |||
The RQL for each analyte was calculated and listed above along with the recovery of the analyte peak near the RQL.
4.5 Precision (analytical method)
The precision of the analytical procedure is measured as the pooled
relative standard deviation
| Table 4.5.1 | |||||
| Instrument Response to Enflurane at Low TC | |||||
|
| |||||
| × target concn | 0.5× | 0.75× | 1× | 1.5× | 2× |
| (µg/mL) | 45.6 | 68.4 | 91.2 | 136.8 | 182.4 |
|
| |||||
| area counts | 5802 | 8044 | 11502 | 15685 | 21003 |
| (µV-s) | 5762 | 7971 | 11748 | 15514 | 20685 |
| 5592 | 8178 | 11513 | 15995 | 19527 | |
| 5604 | 8024 | 10887 | 16911 | 20585 | |
| 5898 | 8173 | 11441 | 15579 | 19114 | |
| 5902 | 8146 | 11336 | 15502 | 19871 | |
| 5760 | 8089 | 11405 | 15864 | 20131 | |
| SD | 136.8 | 87.6 | 287.4 | 544.1 | 740.3 |
| RSD (%) | 2.37 | 1.08 | 2.52 | 3.42 | 3.67 |
|
| |||||
| Table 4.5.2 | |||||
| Instrument Response to Enflurane at High TC | |||||
|
| |||||
| × target concn | 0.5× | 0.75× | 1× | 1.5× | 2× |
| (µg/mL) | 3405 | 5108 | 6810 | 10215 | 13620 |
|
| |||||
| area counts | 313768 | 442725 | 588885 | 909618 | 1266303 |
| (µV-s) | 295385 | 449118 | 614061 | 884040 | 1231585 |
| 306119 | 444388 | 600184 | 888369 | 1239847 | |
| 302927 | 452003 | 605174 | 873998 | 1195472 | |
| 302101 | 463954 | 583097 | 872158 | 1232590 | |
| 315239 | 450679 | 623083 | 934700 | 1220325 | |
| 305923 | 450478 | 602414 | 893814 | 1231020 | |
| SD | 7523.3 | 7523.5 | 15044.1 | 24117.5 | 23253.5 |
| RSD (%) | 2.45 | 1.67 | 2.48 | 2.69 | 1.88 |
|
| |||||
| Table 4.5.3 | |||||
| Instrument Response to Halothane at Low TC | |||||
|
| |||||
| × target concn | 0.5× | 0.75× | 1× | 1.5× | 2× |
| (µg/mL) | 48.62 | 72.93 | 97.24 | 145.9 | 194.5 |
|
| |||||
| area counts | 4652 | 6892 | 9563 | 14067 | 19459 |
| (µV-s) | 4572 | 6936 | 9438 | 14324 | 18888 |
| 4781 | 6802 | 9773 | 14181 | 18732 | |
| 4625 | 6931 | 9501 | 14180 | 19216 | |
| 4630 | 6802 | 9694 | 14534 | 18964 | |
| 4609 | 6960 | 9404 | 14271 | 19499 | |
| 4645 | 6887 | 9562 | 14260 | 19126 | |
| SD | 71.8 | 69.5 | 145.6 | 160.7 | 315.0 |
| RSD (%) | 1.54 | 1.00 | 1.52 | 1.12 | 1.64 |
|
| |||||
| Table 4.5.4 | |||||
| Instrument Response to Halothane at High TC | |||||
|
| |||||
| × target concn | 0.5× | 0.75× | 1× | 1.5× | 2× |
| (µg/mL) | 2431 | 3646 | 4862 | 7293 | 9724 |
|
| |||||
| area counts | 214963 | 31920 | 427008 | 631533 | 876733 |
| (µV-s) | 211987 | 326882 | 426550 | 625176 | 856581 |
| 218236 | 322866 | 430225 | 620733 | 870877 | |
| 215433 | 325338 | 429946 | 632545 | 849740 | |
| 214585 | 329467 | 436427 | 647793 | 860103 | |
| 207597 | 319337 | 433215 | 623791 | 847012 | |
| 213800 | 323849 | 430562 | 630262 | 860174 | |
| SD | 3635.3 | 4144.4 | 3759.2 | 9723.2 | 11694.2 |
| RSD (%) | 1.70 | 1.27 | 0.87 | 1.54 | 1.35 |
|
| |||||
| Table 4.5.5 | |||||
| Instrument Response to Isoflurane at Low TC | |||||
|
| |||||
| × target concn | 0.5× | 0.75× | 1× | 1.5× | 2× |
| (µg/mL) | 45.0 | 67.5 | 90.0 | 135.0 | 180.0 |
|
| |||||
| area counts | 3164 | 4584 | 6793 | 9544 | 14068 |
| (µV-s) | 3083 | 4690 | 6928 | 9750 | 13672 |
| 3239 | 4700 | 6791 | 10564 | 13408 | |
| 2983 | 4510 | 6209 | 10076 | 12670 | |
| 3120 | 4546 | 6809 | 9707 | 13257 | |
| 3147 | 4757 | 6621 | 9820 | 12437 | |
| 3123 | 4631 | 6692 | 9910 | 13252 | |
| SD | 85.9 | 98.2 | 256.0 | 364.5 | 611.5 |
| RSD (%) | 2.75 | 2.11 | 3.82 | 3.67 | 4.61 |
|
| |||||
| Table 4.5.6 | |||||
| Instrument Response to Isoflurane at High TC | |||||
|
| |||||
| × target concn | 0.5× | 0.75× | 1× | 1.5× | 2× |
| (µg/mL) | 3360 | 5040 | 6720 | 10080 | 13440 |
|
| |||||
| area counts | 192010 | 285648 | 377707 | 560192 | 831803 |
| (µV-s) | 198666 | 302263 | 389365 | 536323 | 808032 |
| 196337 | 286004 | 390013 | 576197 | 832183 | |
| 197101 | 283263 | 392882 | 581411 | 807540 | |
| 184540 | 294184 | 416447 | 572522 | 811381 | |
| 202374 | 287224 | 410104 | 564809 | 803188 | |
| 95171 | 289764 | 396086 | 565242 | 815688 | |
| SD | 6199.9 | 7149.2 | 14430.4 | 16102.5 | 12896.4 |
| RSD (%) | 3.17 | 2.46 | 3.64 | 2.84 | 1.58 |
|
| |||||
The Cochran test for homogeneity:

The critical value of the g-statistic, at the 95% confidence level, for five variances, each associated with six observations is 0.5065. Because the g-statistic does not exceed this value, the RSDs can be considered equal and they can be pooled (RSDP) to give an estimated RSD for the concentration range studied.
| Table 4.5.7 | ||||||
| Cochran Test Results and Pooled Relative Standard Deviations | ||||||
|
| ||||||
| enflurane | halothane | isoflurane | ||||
|
| ||||||
| TC | low | high | low | high | low | high |
| g | 0.3515 | 0.2808 | 0.2785 | 0.3058 | 0.3465 | 0.3317 |
| RSDP % | 2.77 | 2.27 | 1.39 | 1.37 | 3.50 | 2.83 |
|
| ||||||
4.6 Precision (overall procedure)
The precision of the overall procedure is determined from the
storage data in Section 4.7. The determination of the standard error
of estmate

| Yobs | = | observed % recovery at a given time |
| Yest | = | estimated % recovery from the regression line at the same given time |
| n | = | total number of data points |
| k | = | 2 for linear regression |
| k | = | 3 for quadratic regression |
An additional 5% for pump error (SP) is added to the
The precision at the 95% confidence level is obtained by
multiplying the standard error of estimate (with pump error included)
by 1.96 (the
| Table 4.6.1 | |||
| Precision of the Overall Procedure on Anasorb CMS, % | |||
|
| |||
| target concn | enflurane | halothane | isoflurane |
|
| |||
| 1 ppm | 14.1 | 14.9 | 15.3 |
| Fig. 4.7.2.1.1 | Fig. 4.7.2.3.2 | Fig. 4.7.2.5.1 | |
| 50 ppm | 13.7 | ||
| Fig 4.7.1.3.1 | |||
| 75 ppm | 16.3 | 16.6 | |
| Fig. 4.7.1.1.1 | Fig. 4.7.1.5.1 | ||
|
| |||
| Table 4.6.2 | |||
| Precision of the Overall Procedure on Anasorb 747, % | |||
|
| |||
| target concn | enflurane | halothane | isoflurane |
|
| |||
| 1 ppm | 11.3 | 10.6 | 11.5 |
| Fig. 4.7.2.2.1 | Fig. 4.7.2.4.1 | Fig. 4.7.2.6.1 | |
| 50 ppm | 11.4 | ||
| Fig. 4.7.1.4.1 | |||
| 75 ppm | 15.1 | 12.0 | |
| Fig. 4.7.1.2.1 | Fig. 4.7.1.6.1 | ||
|
| |||
4.7 Storage test
- 4.7.1 Analyte storage at high target concentration
- 4.7.1.1 Storage samples were generated by sampling from a
controlled test atmosphere containing
| Table 4.7.1.1 | ||||||
| Storage Test for Enflurane on Anasorb CMS | ||||||
|
| ||||||
| time | ambient storage | refrigerated storage | ||||
| (days) | recovery (%) | recovery (%) | ||||
|
| ||||||
| 0 | 90.0 | 101.5 | 98.0 | 90.0 | 101.5 | 98.0 |
| 101.9 | 103.4 | 95.3 | 101.9 | 103.5 | 95.3 | |
| 3 | 101.0 | 101.6 | 94.6 | 90.9 | 88.3 | 95.6 |
| 6 | 102.1 | 105.1 | 107.3 | 111.1 | 103.6 | 98.7 |
| 9 | 101.8 | 104.1 | 95.4 | 90.7 | 97.0 | 100.5 |
| 13 | 97.8 | 88.4 | 91.9 | 98.3 | 112.7 | 103.3 |
| 15 | 91.1 | 102.7 | 90.7 | 92.0 | 100.2 | 102.3 |
|
| ||||||
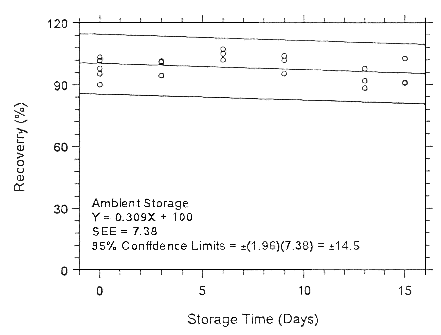
Figure 4.7.1.1.1. Ambient storage test for enflurane on Anasorb
CMS. 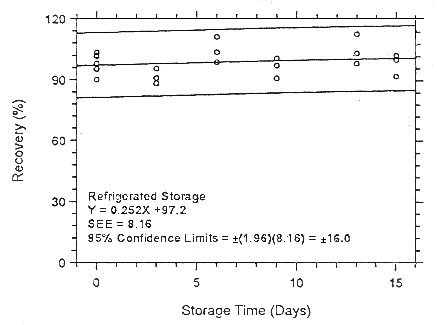
Figure 4.7.1.1.2. Refrigerated storage test for enflurane on Anasorb CMS.
4.7.1.2 Storage samples were generated by sampling from a
controlled test atmosphere containing 2118
mg/m3 of enflurane, about 3.7 times the
| Table 4.7.1.2 | ||||||
| Storage Test for Enflurane on Anasorb 747 | ||||||
|
| ||||||
| time | ambient storage | refrigerated storage | ||||
| (days) | recovery (%) | recovery (%) | ||||
|
| ||||||
| 0 | 96.3 | 97.4 | 106.9 | 96.3 | 97.4 | 106.9 |
| 102.1 | 101.7 | 102.5 | 102.1 | 101.7 | 102.5 | |
| 2 | 92.4 | 84.7 | 100.8 | 96.9 | 101.4 | 98.2 |
| 6 | 92.0 | 104.1 | 97.6 | 95.1 | 96.9 | 99.6 |
| 9 | 102.2 | 96.7 | 106.3 | 93.1 | 104.2 | 99.0 |
| 12 | 97.2 | 112.2 | 105.2 | 102.1 | 103.0 | 105.6 |
| 16 | 102.0 | 102.6 | 105.7 | 99.1 | 112.2 | 106.9 |
|
| ||||||
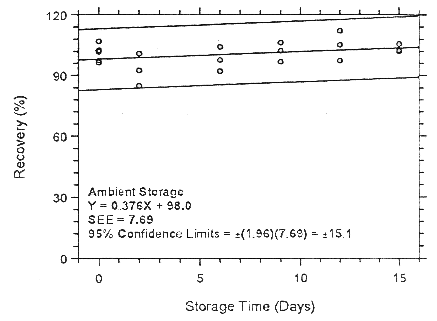
Figure 4.7.1.2.1 Ambient storage test for enflurane on Anasorb
747. 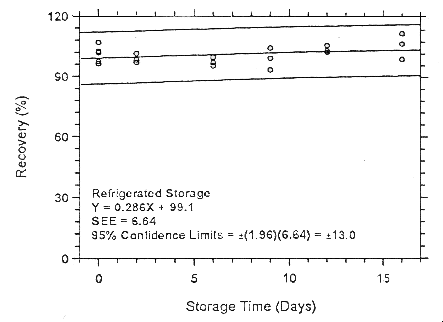
Figure 4.7.1.2.2. Refrigerated storage test for enflurane on Anasorb 747.
4.7.1.3 Storage samples were generated by sampling from a
controlled test atmosphere containing 2146
mg/m3 of halothane, about 5.3 times the
| Table 4.7.1.3 | ||||||
| Storage Test for Halothane on Anasorb CMS | ||||||
|
| ||||||
| time | ambient storage | refrigerated storage | ||||
| (days) | recovery (%) | recovery (%) | ||||
|
| ||||||
| 0 | 103.3 | 104.3 | 90.8 | 103.3 | 104.3 | 90.8 |
| 98.3 | 95.5 | 98.7 | 98.3 | 95.5 | 98.7 | |
| 4 | 101.5 | 95.4 | 96.9 | 106.6 | 91.4 | 99.6 |
| 6 | 103.2 | 88.7 | 96.0 | 99.1 | 95.8 | 98.8 |
| 8 | 103.5 | 101.1 | 97.7 | 108.3 | 92.9 | 100.4 |
| 12 | 106.0 | 91.0 | 94.5 | 108.7 | 102.0 | 102.3 |
| 15 | 96.06 | 91.1 | 93.6 | 103.6 | 90.6 | 101.1 |
|
| ||||||
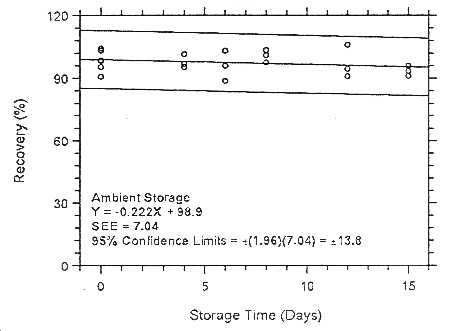
Figure 4.7.1.3.1. Ambient storage test for halothane on Anasorb
CMS. 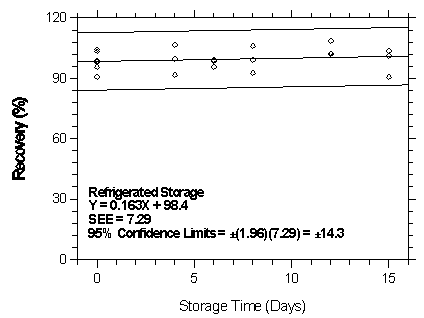
Figure 4.7.1.3.2. Refrigerated storage test for halothane on Anasorb CMS
4.7.1.4 Storage samples were generated by sampling from a
controlled test atmosphere containing 2305
mg/m3 of halothane, about 5.7 times the
| Table 4.7.1.4 | ||||||
| Storage Test for Halothane on Anasorb 747 | ||||||
|
| ||||||
| time | ambient storage | refrigerated storage | ||||
| (days) | recovery (%) | recovery(%) | ||||
|
| ||||||
| 0 | 99.1 | 100.0 | 103.9 | 99.1 | 100.0 | 103.9 |
| 100.5 | 99.7 | 96.9 | 100.5 | 99.7 | 96.9 | |
| 3 | 99.4 | 99.2 | 96.2 | 98.6 | 104.2 | 98.9 |
| 6 | 98.8 | 104.2 | 98.8 | 101.5 | 100.1 | 97.3 |
| 10 | 99.1 | 103.5 | 94.9 | 100.9 | 105.0 | 101.3 |
| 13 | 95.8 | 104.5 | 98.7 | 101.3 | 95.7 | 95.5 |
| 17 | 103.8 | 104.8 | 99.6 | 102.7 | 105.9 | 99.2 |
|
| ||||||
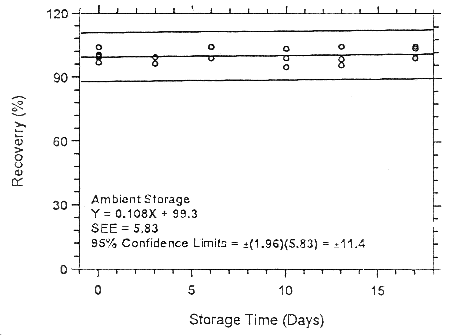
Figure 4.7.1.4.1. Ambient storage test for halothane on Anasorb
747. 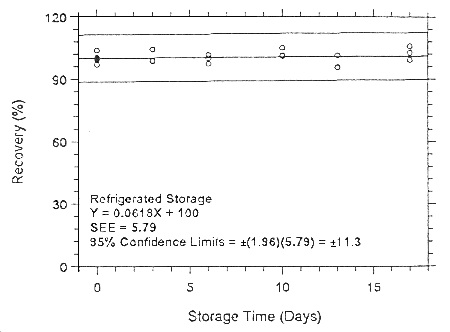
Figure 4.7.1.4.2. Refrigerated storage test for halothane on Anasorb 747.
4.7.1.5 Storage samples were generated by sampling from a
controlled test atmosphere containing 3050
mg/m3 of isoflurane, about 5.4 times the
| Table 4.7.1.5 | ||||||
| Storage Test for Isoflurane on Anasorb CMS | ||||||
|
| ||||||
| time | ambient storage | refrigerated storage | ||||
| (days) | recovery (%) | recovery (%) | ||||
|
| ||||||
| 0 | 99.7 | 103.6 | 93.9 | 99.7 | 103.6 | 93.6 |
| 99.0 | 85.4 | 97.8 | 99.0 | 85.4 | 97.8 | |
| 4 | 111.9 | 104.8 | 97.5 | 106.7 | 91.7 | 92.1 |
| 7 | 99.2 | 94.2 | 90.2 | 108.8 | 103.0 | 100.6 |
| 11 | 113.1 | 102.9 | 102.3 | 106.5 | 99.1 | 91.4 |
| 13 | 103.9 | 96.4 | 92.0 | 108.0 | 105.3 | 103.6 |
| 15 | 108.0 | 105.1 | 106.1 | 105.0 | 100.3 | 96.8 |
|
| ||||||
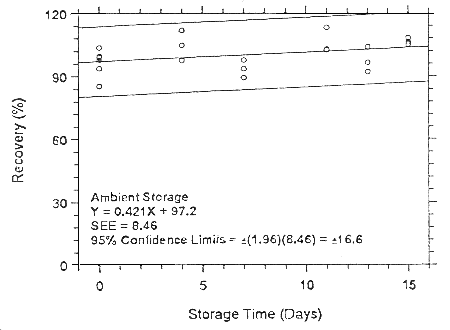
Figure 4.7.1.5.1. Ambient storage test for isoflurane on
Anasorb CMS. 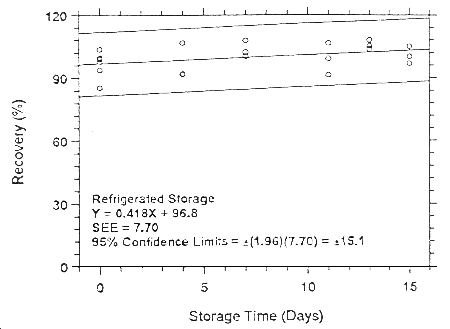
Figure 4.7.1.5.2. Refrigerated storage test for isoflurane on Anasorb CMS.
4.7.1.6 Storage samples were generated by sampling from a
controlled test atmosphere containing 2992
mg/m3 of isoflurane, about 5.3 times the
| Table 4.7.1.6 | ||||||
| Storage Test for Isoflurane on Anasorb 747 | ||||||
|
| ||||||
| time | ambient storage | refrigerated storage | ||||
| (days) | recovery (%) | recovery (%) | ||||
|
| ||||||
| 0 | 92.3 | 99.3 | 99.1 | 92.3 | 99.3 | 99.1 |
| 99.6 | 100.6 | 101.5 | 99.6 | 100.6 | 101.5 | |
| 4 | 99.6 | 97.4 | 102.6 | 97.0 | 92.1 | 98.2 |
| 7 | 92.5 | 94.9 | 101.0 | 103.2 | 102.8 | 103.5 |
| 10 | 100.5 | 103.2 | 102.5 | 98.0 | 97.0 | 100.7 |
| 14 | 103.1 | 100.6 | 108.3 | 106.8 | 102.4 | 105.9 |
| 18 | 107.7 | 100.1 | 105.1 | 103.1 | 100.5 | 104.1 |
|
| ||||||
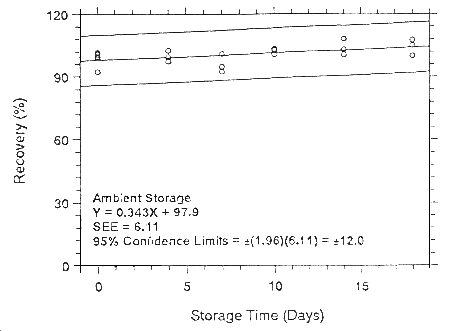
Figure 4.7.1.6.1. Ambient storage test for isoflurane on
Anasorb 747. 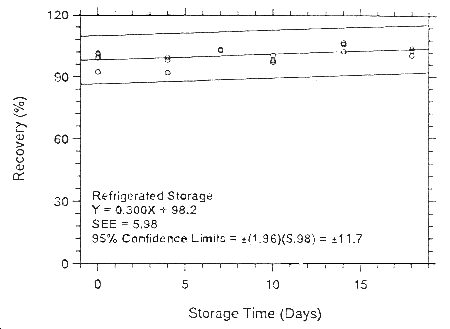
Figure 4.7.1.6.2. Refrigerated storage test for isoflurane on Anasorb 747.
4.7.2 Analyte storage at low target concentration
- 4.7.2.1 Storage samples were generated by sampling from a
controlled test atmosphere containing 58.2
mg/m3 of enflurane, about 7.7 times the
| Table 4.7.2.1 | ||||||
|
| ||||||
| time | ambient storage | refrigerated storage | ||||
| (days) | recovery (%) | recovery (%) | ||||
|
| ||||||
| 0 | 82.6 | 88.7 | 94.1 | 82.6 | 88.7 | 94.1 |
| 98.8 | 98.3 | 102.9 | 98.8 | 98.3 | 102.9 | |
| 4 | 90.1 | 92.9 | 97.0 | 90.4 | 101.0 | 101.7 |
| 7 | 91.6 | 99.9 | 102.2 | 96.6 | 103.9 | 99.0 |
| 11 | 99.1 | 96.6 | 100.9 | 90.0 | 100.8 | 96.9 |
| 13 | 88.3 | 95.9 | 97.3 | 104.9 | 97.7 | 98.1 |
| 15 | 96.3 | 92.1 | 95.6 | 86.6 | 93.0 | 102.0 |
|
| ||||||
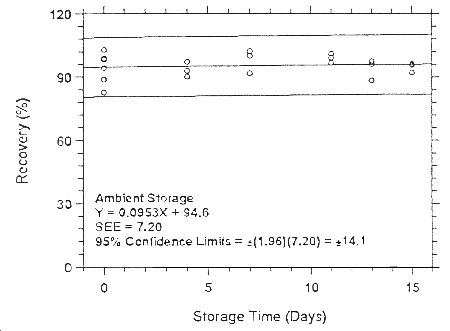
Figure 4.7.2.1.1. Ambient storage test for enflurane on Anasorb
CMS. 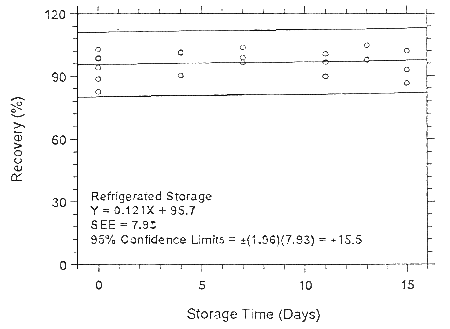
Figure 4.7.2.1.2. Refrigerated storage test for enflurane on Anasorb CMS.
4.7.2.2 Storage samples were generated by sampling from a
controlled test atmosphere containing 59.4
mg/m3 of enflurane, about 7.9 times the
| Table 4.7.2.2 | ||||||
| Storage Test for Enflurane on Anasorb 747 | ||||||
|
| ||||||
| time | ambient storage | refrigerated storage | ||||
| (days) | recovery (%) | recovery (%) | ||||
|
| ||||||
| 0 | 101.8 | 93.4 | 96.5 | 101.8 | 93.4 | 96.5 |
| 100.0 | 103.4 | 98.3 | 100.0 | 103.4 | 98.3 | |
| 3 | 102.3 | 98.9 | 97.3 | 99.0 | 96.3 | 101.1 |
| 6 | 101.7 | 104.0 | 102.9 | 98.8 | 101.8 | 100.3 |
| 12 | 98.3 | 100.2 | 96.4 | 98.0 | 98.2 | 101.3 |
| 14 | 101.1 | 101.3 | 102.7 | 102.2 | 104.2 | 96.7 |
| 18 | 98.6 | 99.0 | 95.8 | 106.9 | 100.7 | 103.0 |
|
| ||||||
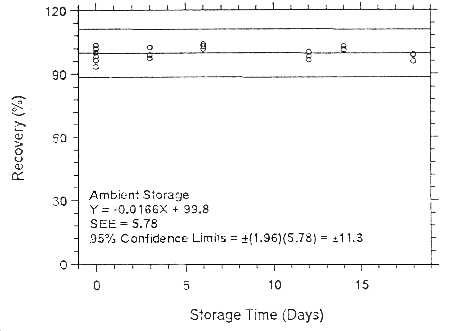
Figure 4.7.2.2.1. Ambient storage test for enflurane on Anasorb 747.
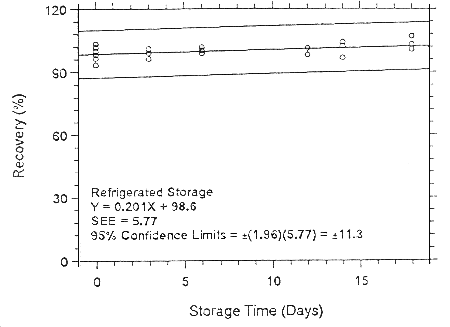
Figure 4.7.2.2.2. Refrigerated storage test for enflurane on Anasorb 747.
4.7.2.3 Storage samples were generated by sampling from a
controlled test atmosphere containing 70.1
mg/m3 of halothane, about 8.7 times the
1-ppm target concentration. Anasorb CMS tubes were used to sample
for 30 min at 0.05 L/min, the relative humidity was about 80% at
22°.
| Table 4.7.2.3 | ||||||
| Storage Test for Halothane on Anasorb CMS | ||||||
|
| ||||||
| time | ambient storage | refrigerated storage | ||||
| (days) | recovery (%) | recovery (%) | ||||
|
| ||||||
| 0 | 91.7 | 93.8 | 98.7 | 91.7 | 93.8 | 98.7 |
| 101.1 | 103.6 | 106.9 | 101.1 | 103.6 | 106.9 | |
| 3 | 80.6 | 88.4 | 95.5 | 89.3 | 95.4 | 105.5 |
| 8 | 78.8 | 85.6 | 90.1 | 92.6 | 99.3 | 100.5 |
| 12 | 79.2 | 85.3 | 92.4 | 86.5 | 107.4 | 100.0 |
| 14 | 77.2 | 86.9 | 98.0 | 97.0 | 98.6 | 101.2 |
| 16 | 73.4 | 80.0 | 92.0 | 92.5 | 94.4 | 100.2 |
|
| ||||||
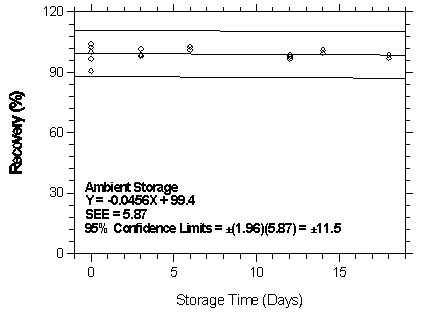
Figure 4.7.2.3.1. Ambient storage test for halothane on Anasorb CMS.
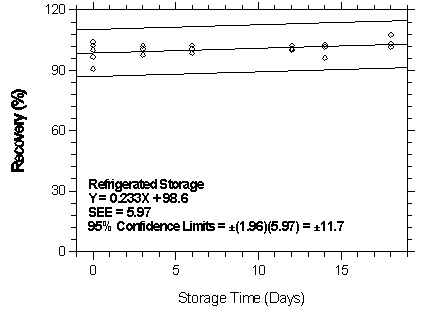
Figure 4.7.2.3.2. Refrigerated storage test for halothane on Anasorb CMS.
4.7.2.4 Storage samples were generated by sampling from a
controlled test atmosphere containing 71.2
mg/m3 of halothane, about 8.8 times the
| Table 4.7.2.4 | ||||||
| Storage Test for Halothane on Anasorb 747 | ||||||
|
| ||||||
| time | ambient storage | refrigerated storage | ||||
| (days) | recovery (%) | recovery (%) | ||||
|
| ||||||
| 0 | 97.8 | 104.5 | 97.5 | 97.8 | 104.5 | 97.5 |
| 99.4 | 101.0 | 99.8 | 99.4 | 101.0 | 99.8 | |
| 3 | 99.2 | 102.0 | 98.0 | 97.3 | 99.0 | 103.4 |
| 6 | - | 100.2 | 100.8 | 98.4 | 105.3 | 97.1 |
| 9 | 104.5 | 103.7 | 101.0 | 98.9 | 111.2 | 102.6 |
| 13 | 101.0 | 102.7 | 100.6 | 106.0 | 102.3 | 99.7 |
| 15 | 105.7 | 103.0 | 101.4 | 113.3 | 101.0 | 101.1 |
|
| ||||||
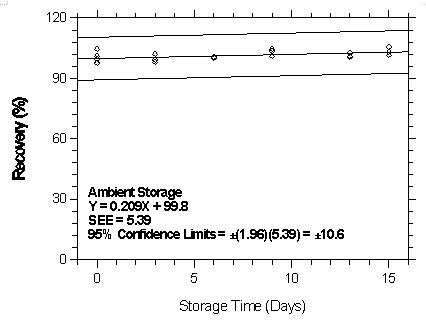
Figure 4.7.2.4.1. Ambient storage test for halothane on Anasorb 747.
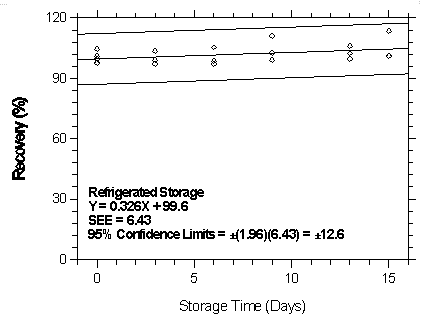
Figure 4.7.2.4.2. Refrigerated storage test for halothane on Anasorb 747.
4.7.2.5 Storage samples were generated by sampling from a
controlled test atmosphere containing 50.4
mg/m3 of isoflurane, about 6.7 times the
| Table 4.7.2.5 | ||||||
| Storage Test for Isoflurane on Anasorb CMS | ||||||
|
|
||||||
| time | ambient storage | refrigerated storage | ||||
| (days) | recovery (%) | recovery (%) | ||||
|
|
||||||
| 0 | 79.1 | 88.1 | 91.8 | 79.1 | 88.1 | 91.8 |
| 98.9 | 98.0 | 103.2 | 98.9 | 98.0 | 103.2 | |
| 4 | 97.8 | 96.5 | 101.7 | 90.7 | 101.8 | 105.7 |
| 7 | 91.5 | 97.4 | 102.2 | 94.5 | 103.7 | 100.8 |
| 11 | 97.6 | 94.0 | 98.7 | 89.3 | 102.3 | 100.0 |
| 13 | 85.4 | 95.1 | 98.0 | 105.3 | 98.9 | 96.1 |
| 15 | 92.1 | 87.4 | 92.7 | 85.0 | 89.4 | 99.4 |
|
| ||||||
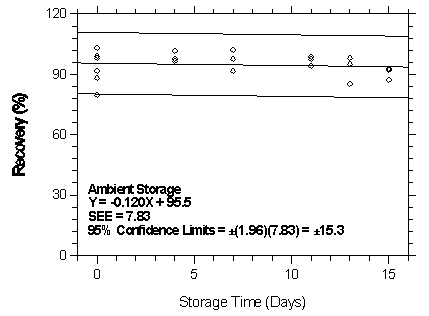
Figure
4.7.2.5.1. Ambient storage test for isonurane on Anasorb CMS.
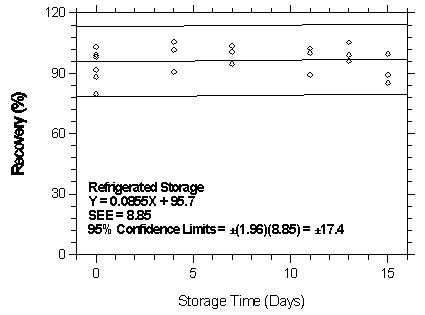
Figure
4.7.2.5.2. Refrigerated storage test for isoflurane on Anasorb
CMS.
4.7.2.6 Storage samples were generated by sampling from a
controlled test atmosphere containing 52.7
mg/m3 of isoflurane, about 7 times the
| Table 4.7.2.6 | ||||||
| Storage Test for Isoflurane on Anasorb 747 | ||||||
|
| ||||||
| time | ambient storage | refrigerated storage | ||||
| (days) | recovery (%) | recovery (%) | ||||
|
| ||||||
| 0 | 102.3 | 90.5 | 96.7 | 102.3 | 90.5 | 96.7 |
| 100.0 | 104.2 | 96.8 | 100.0 | 104.2 | 96.8 | |
| 3 | 101.8 | 98.0 | 98.4 | 100.7 | 97.4 | 102.0 |
| 6 | 102.5 | 102.6 | 101.2 | 98.4 | 102.3 | 100.6 |
| 12 | 97.7 | 98.5 | 96.7 | 99.9 | 100.5 | 102.3 |
| 14 | 99.5 | 99.5 | 100.9 | 102.8 | 101.6 | 96.0 |
| 16 | 98.4 | 96.9 | 97.0 | 107.6 | 101.8 | 103.2 |
|
| ||||||
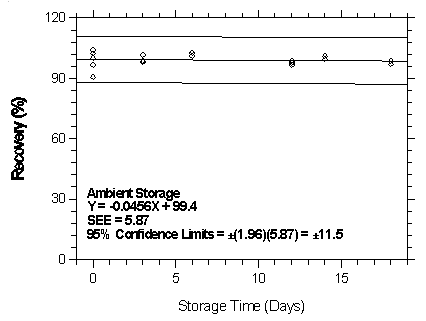
Figure
4.7.2.6.1. Ambient storage test for isoflurane on Anasorb 747.
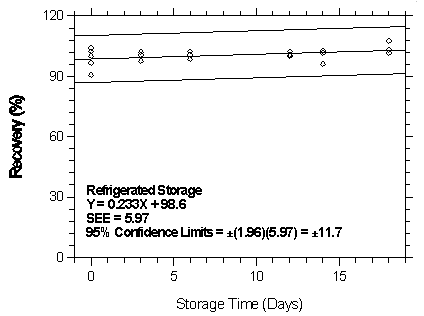
Figure
4.7.2.6.2. Refrigerated storage test for isoflurane on Anasorb
747.
4.8 Reproducibility
- 4.8.1 Analyte reproducibility at high target concentration
- 4.8.1.1 Six samples for each adsorbent were prepared by
collecting them from a 75-ppm controlled test atmosphere
containing enflurane and isoflurane for 4 h at 0.05 L/min. The
samples were submitted to an OSHA Salt Lake Technical Center
service branch. The samples were analyzed after being stored for
21 days at 4°. Sample results were corrected for desorption
efficiency. No sample result for enflurane or isoflurane had a
deviation greater than the precision of the overall procedure
determined in Section 4.6.
| Table 4.8.1.1.1 | |||||||
| Reproducibility Data for Enflurane | |||||||
|
| |||||||
| Anasorb CMS | Anasorb 747 | ||||||
| sample | expected | reported | recovery | deviation | reported | recovery | deviation |
| (mg/m3) | (mg/m3) | (%) | (%) | (mg/m3) | (%) | (%) | |
|
| |||||||
| 1 | 570 | 546.3 | 95.9 | -4.1 | 517.6 | 90.8 | -9.2 |
| 2 | 570 | 517.3 | 90.9 | -9.1 | 533.1 | 93.5 | -6.5 |
| 3 | 570 | 544.1 | 95.5 | -4.5 | 520.3 | 91.3 | -8.7 |
| 4 | 570 | 556.9 | 97.7 | -2.3 | 532.1 | 93.4 | -6.6 |
| 5 | 570 | 518.7 | 91.0 | -9.0 | 499.6 | 87.7 | -12.3 |
| 6 | 570 | 536.9 | 94.2 | -5.8 | 524.0 | 91.9 | -8.1 |
|
| |||||||
| Table 4.8.1.1.2 | |||||||
| Reproducibility Data for Isoflurane | |||||||
|
| |||||||
| Anasorb CMS | Anasorb 747 | ||||||
| sample | expected | reported | recovery | deviabon | reported | recovery | deviation |
| (mg/m3) | (mg/m3) | (%) | (%) | (mg/m3) | (%) | (%) | |
|
| |||||||
| 1 | 562.5 | 596.6 | 106.1 | +6.1 | 562.3 | 100.0 | 0 |
| 2 | 562.5 | 550.2 | 97.8 | -2.2 | 576.6 | 102.5 | +2.5 |
| 3 | 562.5 | 591.1 | 105.1 | +5.1 | 564.0 | 100.3 | +0.3 |
| 4 | 562.5 | 609.0 | 108.3 | +8.3 | 578.1 | 102.8 | +2.8 |
| 5 | 562.5 | 564.8 | 100.3 | +0.3 | 540.3 | 96.1 | -3.9 |
| 6 | 562.5 | 587.4 | 104.4 | +4.4 | 569.2 | 101.2 | 1.2 |
|
| |||||||
4.8.1.2 Six samples for each adsorbent were prepared by collecting them from a 50-ppm controlled test atmosphere containing halothane for 4 h at 0.05 L/min. The samples were submilted to an OSHA Salt Lake Technical Center service branch. The samples were analyzed after being stored for 17 days at 4°. Sample results were corrected for desorption efficiency. No sample result for halothane had a deviation greater than the precision of the overall procedure determined in Section 4.6.
| Table 4.8.1.2 | |||||||
| Reproducibility Data for Halothane | |||||||
|
| |||||||
| Anasorb CMS | Anasorb 747 | ||||||
| sample | expected | reported | recovery | deviation | reported | recovery | deviation |
| (mg/m3) | (mg/m3) | (%) | (%) | (mg/m3) | (%) | (%) | |
|
| |||||||
| 1 | 408 | 411.0 | 100.7 | +0.7 | 406.2 | 99.6 | -0.4 |
| 2 | 408 | 406.6 | 99.7 | -0.3 | 411.1 | 100.8 | +0.8 |
| 3 | 408 | 402.8 | 98.7 | -1.3 | 411.5 | 100.8 | +0.8 |
| 4 | 408 | 409.8 | 100.4 | +0.4 | 410.6 | 100.6 | +0.6 |
| 5 | 408 | 399.7 | 98.0 | -2.0 | 401.7 | 98.5 | -1.5 |
| 6 | 408 | 406.4 | 99.6 | -0.4 | 408.1 | 100.0 | 0 |
|
| |||||||
4.8.2 Analyte reproducibility at low target concentration
- 4.8.2.1 Six samples for each adsorbent were prepared by
collecting them from a 1-ppm controlled test atmosphere containing
enflurane and isoflurane for 4 h at 0.05 L/min. The samples were
submitted to an OSHA Salt Lake Technical Center service branch.
The samples were analyzed after being stored for 22 days at 4°.
Sample results were corrected for desorption efficiency. No sample
result for enflurane and isoflurane had a deviation greater than
the precision of the overall procedure determined in Section 4.6.
| Table 4.8.2.1.1 | |||||||
| Reproducibility Data for Enflurane | |||||||
|
| |||||||
| Anasorb CMS | Anasorb 747 | ||||||
| sample | expected | reported | recovery | deviation | reported | recovery | deviation |
| (mg/m3) | (mg/m3) | (%) | (%) | (mg/m3) | (%) | (%) | |
|
| |||||||
| 1 | 7.62 | 8.02 | 105.2 | +5.2 | 7.81 | 102.5 | +2.5 |
| 2 | 7.62 | 7.58 | 99.5 | -0.5 | 7.82 | 102.6 | +2.6 |
| 3 | 7.62 | 7.62 | 100.0 | 0 | 7.82 | 102.6 | +2.6 |
| 4 | 7.62 | 6.55 | 86.0 | -14.0 | 6.95 | 91.2 | -8.8 |
| 5 | 7.62 | 7.58 | 99.5 | -0.5 | 7.73 | 101.4 | +1.4 |
| 6 | 7.62 | 7.65 | 100.4 | +0.4 | 8.48 | 111.3 | +11.3 |
|
| |||||||
| Table 4.8.2.3 | |||||||
| Reproducibility Data for Isoflurane | |||||||
|
| |||||||
| Anasorb CMS | Anasorb 747 | ||||||
| sample | expected | reported | recovery | deviation | reported | recovery | deviation |
| (mg/m3) | (mg/m3) | (%) | (%) | (mg/m3) | (%) | (%) | |
|
| |||||||
| 1 | 7.52 | 7.74 | 102.9 | +2.9 | 7.91 | 105.2 | +5.2 |
| 2 | 7.52 | 7.47 | 99.3 | -0.7 | 8.22 | 109.3 | +9.3 |
| 3 | 7.52 | 7.65 | 101.7 | +1.7 | 8.32 | 110.6 | +10.6 |
| 4 | 7.52 | 6.58 | 87.5 | -12.5 | 7.09 | 94.3 | -5.7 |
| 5 | 7.52 | 7.15 | 95.1 | -4.9 | 8.22 | 109.3 | +9.3 |
| 6 | 7.52 | 7.59 | 100.9 | +0.9 | 7.70 | 102.4 | +2.4 |
|
| |||||||
4.8.2.2 Six samples for each adsorbent were prepared by collecting them from a 1-ppm controlled test atmosphere containing halothane for 4 h at 0.05 L/min. The samples were submitted to an OSHA Salt Lake Technical Center service branch. The samples were analyzed after being stored for 23 days at 4°. Sample results were corrected for desorption efficiency. No sample result for halothane had a deviation greater than the precision of the overall procedure determined in Section 4.6.
| Table 4.8.2.2 | |||||||
| Reproducibility Data for Halothane | |||||||
|
| |||||||
| Anasorb CMS | Anasorb 747 | ||||||
| sample | expected | reported | recovery | deviation | reported | recovery | deviation |
| (mg/m3) | (mg/m3) | (%) | (%) | (mg/m3) | (%) | (%) | |
|
| |||||||
| 1 | 8.40 | 7.38 | 37.9 | -12.1 | 8.79 | 104.6 | +4.6 |
| 2 | 8.40 | 7.80 | 92.9 | -7.1 | 8.53 | 101.5 | +1.5 |
| 3 | 8.40 | 8.32 | 99.0 | -1.0 | 9.03 | 107.5 | +7.5 |
| 4 | 8.40 | 7.93 | 94.4 | -5.6 | 8.81 | 104.9 | +4.9 |
| 5 | 8.40 | 8.20 | 97.6 | -2.4 | 8.70 | 103.6 | +3.6 |
| 6 | 8.40 | 8.67 | 103.2 | +3.2 | 8.93 | 106.3 | +6.3 |
|
| |||||||
4.9 Sampler capacity
- 4.9.1 Anasorb CMS
- 4.9.1.1 The sampling capacity of the front section of an
Anasorb CMS sampling tube was tested by sampling from a
dynamically generated test atmosphere of enflurane (1247
mg/m3 or 165 ppm). The samples were
collected at 0.05 L/min and the relative humidity was about 80% at
22°. A GC with a gas sampling valve was placed
| Table 4.9.1.1 | |||
| Capacity of Enflurane on Anasorb CMS | |||
|
| |||
| first test | second test | ||
| air volume | breakthrough | air volume | breakthrough |
| (L) | (%) | (L) | (%) |
|
| |||
| 17.54 | 0 | 16.39 | 0 |
| 18.24 | 0.79 | 17.11 | 0.27 |
| 19.62 | 1.57 | 20.76 | 0.69 |
| 21.93 | 2.07 | 20.97 | 1.04 |
| 23.18 | 2.50 | 22.18 | 1.34 |
| 24.19 | 2.87 | 22.90 | 1.57 |
| 25.06 | 3.23 | 24.20 | 1.98 |
| 26.12 | 3.93 | 25.55 | 2.38 |
| 26.99 | 4.41 | 26.46 | 2.83 |
| 28.48 | 5.03 | 27.57 | 3.33 |
| 29.23 | 5.59 | 27.72 | 3.81 |
| 29.99 | 6.25 | 28.44 | 4.24 |
|
| |||
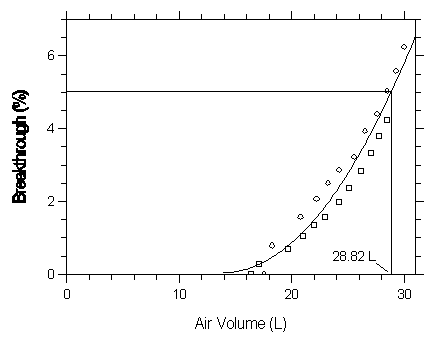
Figure 4.9.1.1. Five percent breakthrough air volume for enflurane on Anasorb CMS.
4.9.1.2 The sampling capacity of the front section of an
Anasorb CMS sampling tube was tested by sampling from a
dynamically generated test atmosphere of halothane (753
mg/m3 or 93.3 ppm). The samples were
collected at 0.05 L/min and the relative humidity was about 80% at
22°. A GC with a gas sampling valve was placed
| Table 4.9.1.2 | |||
| Capacity of Halothane on Anasorb CMS | |||
|
| |||
| first test | second test | ||
| air volume | breakthrough | air volume | breakthrough |
| (L) | (%) | (L) | (%) |
|
| |||
| 5.88 | 0 | 6.06 | 0 |
| 7.10 | 0 | 7.26 | 0 |
| 8.37 | 0 | 8.52 | 0 |
| 12.42 | 3.11 | 12.53 | 3.08 |
| 12.93 | 3.28 | 13.03 | 3.21 |
| 13.44 | 3.71 | 13.53 | 3.65 |
| 13.94 | 4.11 | 14.03 | 4.00 |
| 14.55 | 4.53 | 14.63 | 4.29 |
| 15.06 | 4.64 | 15.13 | 4.47 |
| 15.56 | 4.97 | 15.63 | 4.72 |
| 16.07 | 5.26 | 16.13 | 4.96 |
| 16.58 | 5.74 | 16.63 | 5.19 |
| 17.09 | 5.83 | 17.73 | 5.58 |
| 17.59 | 6.24 | 17.64 | 5.87 |
| 18.10 | 6.32 | ||
|
| |||
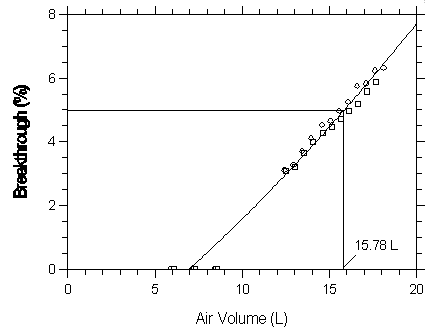
Figure 4.9.1.2. Five percent breakthrough air volume for haothane on Anasorb CMS.
4.9.1.3 The sampling capacity of the front section of an
Anasorb CMS sampling tube was tested by sampling from a
dynamically generated test atmosphere of isoflurane (1246
mg/m3 or 165 ppm). The samples were
collected at 0.05 L/min and the relative humidity was about 80% at
22°. A GC with a gas sampling valve was placed
| Table 4.9.1.3 | |||
| Capacity of Isoflurane on Anasorb CMS | |||
|
| |||
| first test | second test | ||
| air volume | breakthrough | air volume | breakthrough |
| (L) | (%) | (L) | (%) |
|
| |||
| 9.10 | 0 | 10.10 | 0 |
| 13.48 | 0.42 | 14.11 | 0.96 |
| 14.51 | 0.73 | 15.12 | 1.42 |
| 15.50 | 1.03 | 16.13 | 1.76 |
| 16.48 | 1.39 | 17.14 | 1.96 |
| 17.76 | 1.75 | 18.50 | 2.42 |
| 19.19 | 2.36 | 20.06 | 3.15 |
| 20.41 | 2.86 | 21.17 | 3.74 |
| 21.50 | 3.24 | 22.27 | 4.24 |
| 22.68 | 3.67 | 23.49 | 5.21 |
| 23.86 | 4.32 | 24.70 | 6.16 |
| 24.85 | 4.65 | 25.70 | 6.89 |
|
| |||
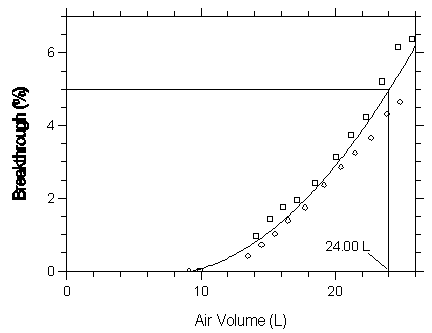
Figure 4.9.1.3. Five percent breakthrough air volume for isoflurane on Anasorb CMS.
4.9.2 Anasorb 747
- 4.9.2.1 The sampling capacity of the front section of an
Anasorb 747 sampling tube was tested by sampling from a
dynamically generated test atmosphere of enflurane (1247
mg/m3 or 165 ppm). The samples were
collected at 0.05 L/min and the relative humidity was about 80% at
22°. A GC with a gas sampling valve was placed
| Table 4.9.2.1 | |||
| Capacity of Enflurane on Anasorb 747 | |||
|
| |||
| first test | second test | ||
| air volume | breakthrough | air volume | breakthrough |
| (L) | (%) | (L) | (%) |
|
| |||
| 9.85 | 0 | 10.10 | 0 |
| 13.13 | 1.40 | 13.43 | 2.22 |
| 13.69 | 3.12 | 13.94 | 3.98 |
| 14.24 | 5.61 | 14.49 | 6.29 |
| 14.75 | 7.77 | 15.00 | 8.12 |
| 15.25 | 9.13 | 15.50 | 9.95 |
|
| |||

Figure 4.9.2.1. Five percent breakthrough air volume for enflurane on Anasorb 747.
4.9.2.2 The sampling capacity of the front section of an
Anasorb 747 sampling tube was tested by sampling from a
dynamically generated test atmosphere of halothane (753
mg/m3 or 93.3 ppm). The samples were
collected at 0.05 L/min and the relative humidity was about 80% at
22°. A GC with a gas sampling valve was placed
| Table 4.9.2.2 | |||
| Capacity of Halothane on Anasorb 747 | |||
|
| |||
| first test | second test | ||
| air volume | breakthrough | air volume | breakthrough |
| (L) | (%) | (L) | (%) |
|
| |||
| 16.07 | 0 | 16.13 | 0 |
| 17.34 | 0 | 17.38 | 0 |
| 18.86 | 0.52 | 18.89 | 0.45 |
| 19.87 | 2.56 | 19.94 | 2.37 |
| 20.18 | 5.06 | 20.19 | 4.86 |
| 20.43 | 8.67 | 20.44 | 8.70 |
| 20.69 | 12.58 | 20.69 | 12.70 |
|
| |||
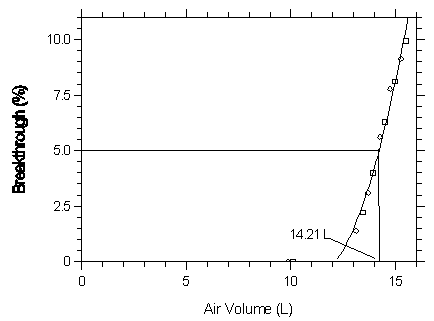
Figure 4.9.2.2. Five percent breakthrough air volume for halothane on Anasorb 747.
4.9.2.3 The sampling capacity of the front section of an
Anasorb 747 sampling tube was tested by sampling from a
dynamically generated test atmosphere of isoflurane (1246
mg/m3 or 165 ppm). The samples were
collected at 0.05 L/min and the relative humidity was about 80% at
22°. A GC with a gas sampling valve was placed
| Table 4.9.2.3 | |||
| Capacity of Isoflurane on Anasorb 747 | |||
|
| |||
| first test | second test | ||
| air volume | breakthrough | air volume | breakthrough |
| (L) | (%) | (L) | (%) |
|
| |||
| 11.21 | 0 | 10.66 | 0 |
| 12.20 | 0 | 11.62 | 0 |
| 13.20 | 0.18 | 12.68 | 0.12 |
| 13.94 | 0.35 | 13.64 | 0.61 |
| 14.44 | 0.59 | 14.39 | 1.12 |
| 14.94 | 0.93 | 14.90 | 1.59 |
| 15.44 | 1.36 | 15.40 | 2.13 |
| 15.94 | 1.94 | 15.91 | 2.86 |
| 16.43 | 2.50 | 16.41 | 3.72 |
| 16.93 | 3.29 | 16.92 | 4.62 |
| 17.43 | 4.07 | 17.42 | 5.56 |
| 17.93 | 4.85 | 17.93 | 6.69 |
| 18.43 | 5.73 | 18.43 | 7.69 |
| 18.94 | 8.76 | ||
|
| |||
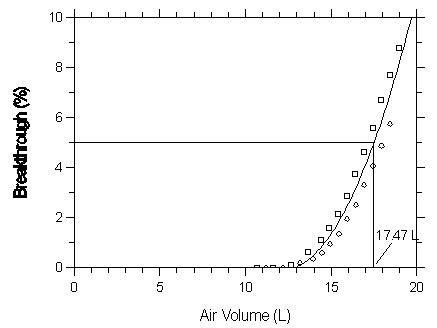
Figure 4.9.2.3 Five percent breakthrough air volume for isoflurane on Anasorb 747.
4.10 Desorption efficiency and stability of desorbed samples
- 4.10.1 Anasorb CMS at high target concentration (TC)
- 4.10.1.1 Enflurane
The desorption efficiencies (DE) of enflurane were determined
by
| Table 4.10.1.1.1 | ||||||
| Desorbtion Efficiency of Enflurane from Anasorb CMS at High TC | ||||||
|
| ||||||
| × target concn | 0.05× | 0.1× | 0.2× | 0.5× | 1.0× | 2.0× |
| (µg/sample) | 340.5 | 681 | 1362 | 3403 | 6810 | 13620 |
|
| ||||||
| DE (%) | 101.4 | 98.5 | 100.2 | 100.2 | 99.8 | 99.3 |
| 98.7 | 98.3 | 97.2 | 99.6 | 98.2 | 98.9 | |
| 100.5 | 100.3 | 100.1 | 99.9 | 100.6 | 98.9 | |
| 98.9 | 100.7 | 101.6 | 101.2 | 100.7 | 100.1 | |
| 100.8 | 100.0 | 99.6 | 100.3 | 99.7 | 97.8 | |
| 100.1 | 100.7 | 100.2 | 101.0 | 101.0 | 99.2 | |
| 100.1 | 99.8 | 99.8 | 100.4 | 100.0 | 99.0 | |
|
| ||||||
The stability of desorbed samples was investigated by reanalyzing the target concentration samples 22.5 h after intial analysis. After the original analysis was performed, three vials were recapped with new septa while the remaining three retained their punctured septa. The samples vials were stored in the refrigerated sampling tray for the GC injector. The samples were reanalyzed with fresh standards. The average percent change was -2.0% for samples that were resealed with new septa, and -4.2% for those that retained their punctured septa.
| Table 4.10.1.1.2 | |||||
| Stability of Desorbed Samples for Enflurane from Anasorb CMS | |||||
|
| |||||
| punctured septa replaced | punctured septa retained | ||||
| initial | DE after | initial | DE after | ||
| DE | one day | difference | DE | one day | difference |
| (%) | (%) | (%) | (%) | ||
|
| |||||
| 99.8 | 97.3 | -2.5 | 100.7 | 98.7 | -2.0 |
| 98.2 | 96.7 | -1.5 | 99.7 | 95.4 | -4.3 |
| 100.6 | 98.6 | -2.0 | 101.0 | 94.8 | -6.2 |
| (averages) | (averages) | ||||
| 99.5 | 97.5 | -2.0 | 100.5 | 96.3 | -4.2 |
|
| |||||
4.10.1.2. Halothane
The desorption efficiencies (DE) of halothane were determined
by
| Table 4.10.1.2.1 | ||||||
| Desorption Efficiency of Halothane from Anasorb CMS at High TC | ||||||
|
| ||||||
| ×target concn | 0.05× | 0.1× | 0.2× | 0.5× | 1.0× | 2.0× |
| (µg/sample) | 243.1 | 486.2 | 972.4 | 2431 | 4862 | 9724 |
|
| ||||||
| DE (%) | 99.4 | 98.6 | 98.9 | 99.1 | 99.8 | 99.6 |
| 99.6 | 98.5 | 96.5 | 98.8 | 98.0 | 99.9 | |
| 97.4 | 99.1 | 98.5 | 101.8 | 100.0 | 99.4 | |
| 101.0 | 99.3 | 99.5 | 99.6 | 99.7 | 100.1 | |
| 99.0 | 98.9 | 98.3 | 99.5 | 99.2 | 98.6 | |
| 99.2 | 99.0 | 99.1 | 99.8 | 99.9 | 98.5 | |
| 99.3 | 98.9 | 98.5 | 99.8 | 99.4 | 99.4 | |
|
| ||||||
The stability of desorbed samples was investigated by reanalyzing the target concentration samples 22.5 h after initial analysis. After the original analysis was performed, three vials were recapped with new septa while the remaining three retained their punctured septa. The samples vials were stored in the refrigerated sampling tray for the GC injector. The samples were reanalyzed with fresh standards. The average percent change was -1.5% for samples that were resealed with new septa, and -3.4% for those that retained their punctured septa.
| Table 4.10.1.2.2 | |||||
| Stability of Desorbed Samples for Halothane from Anasorb CMS | |||||
|
| |||||
| punctured septa replaced | punctured septa retained | ||||
| initial | DE after | initial | DE after | ||
| DE | one day | difference | DE | one day | difference |
| (%) | (%) | (%) | (%) | ||
|
| |||||
| 99.8 | 97.4 | -2.4 | 99.7 | 97.7 | -2.0 |
| 98.0 | 97.1 | -0.9 | 99.2 | 96.1 | -3.1 |
| 100.0 | 98.8 | -1.2 | 99.9 | 94.8 | -5.1 |
| (averages) | (averages) | ||||
| 99.3 | 97.8 | -1.5 | 99.6 | 96.2 | -3.4 |
|
| |||||
4.10.1.3 Isoflurane
The desorption efficiencies (DE) of isoflurane were determined
by
| Table 4.10.1.3.1 | ||||||
| Desorption Efficiency of Isoflurane from Anasorb CMS at High TC | ||||||
|
| ||||||
| × target concn | 0.05× | 0.1× | 0.2× | 0.5× | 1.0× | 2.0× |
| (µg/sample) | 336 | 672 | 1344 | 3360 | 6720 | 13440 |
|
| ||||||
| DE (%) | 100.2 | 97.3 | 99.6 | 99.8 | 99.1 | 97.6 |
| 99.2 | 99.3 | 99.4 | 99.3 | 97.6 | 97.3 | |
| 98.7 | 99.9 | 100.9 | 99.4 | 99.7 | 97.8 | |
| 101.3 | 100.2 | 99.3 | 100.7 | 99.7 | 98.5 | |
| 100.9 | 99.1 | 99.5 | 100.2 | 103.3 | 96.8 | |
| 99.9 | 99.9 | 96.5 | 100.8 | 99.5 | 98.1 | |
| 100.0 | 99.3 | 99.2 | 100.0 | 99.8 | 97.7 | |
|
| ||||||
The stability of desorbed samples was investigated by reanalyzing the target concentration samples 22.5 h after initial analysis. After the original analysis was performed, three vials were recapped with new septa while the remaining three retained their punctured septa. The samples vials were stored in the refrigerated sampling tray for the GC injector. The samples were reanalyzed with fresh standards. The average percent change was -2.3% for samples that were resealed with new septa, and -4.1% for those that retained their punctured septa.
| Table 4.10.1.3.2 Stability of Desorbed Samples for Isoflurane from Anasorb CMS | |||||
|
| |||||
| punctured septa replaced | punctured septa retained | ||||
| initial | DE after | initial | DE after | ||
| DE | one day | difference | DE | one day | difference |
| (%) | (%) | (%) | (%) | ||
|
| |||||
| 99.1 | 96.2 | -2.9 | 99.7 | 98.0 | -1.7 |
| 97.6 | 95.5 | -2.1 | 103.3 | 98.1 | -5.2 |
| 99.7 | 97.8 | -1.9 | 99.5 | 93.9 | -5.4 |
| (averages) | (averages) | ||||
| 98.8 | 96.5 | -2.3 | 100.8 | 96.7 | -4.1 |
|
| |||||
4.10.2 Anasorb 747 at high target concentration (TC)
- 4.1 0.2.1 Enflurane
The desorption efficiencies (DE) of.enflurane were determined
by
| Table 4.10.2.1.1 | ||||||
| Desorption Effidency of Enflurane from Anasorb 747 at High TC | ||||||
|
| ||||||
| × target concn | 0.05× | 0.1× | 0.2× | 0.5× | 1.0× | 2.0× |
| (µg/sample) | 340.5 | 681 | 1362 | 3405 | 6810 | 13620 |
|
| ||||||
| DE (%) | 100.9 | 100.6 | 101.4 | 98.9 | 103.9 | 99.5 |
| 99.1 | 99.1 | 98.0 | 100.0 | 100.9 | 100.3 | |
| 101.1 | 99.5 | 98.4 | 98.9 | 105.3 | 102.6 | |
| 101.7 | 99.6 | 102.5 | 98.3 | 99.5 | 101.0 | |
| 99.9 | 101.8 | 102.0 | 100.6 | 100.2 | 102.3 | |
| 98.6 | 99.6 | 99.7 | 97.6 | 100.5 | 97.5 | |
| 100.2 | 100.0 | 100.3 | 99.1 | 101.8 | 100.5 | |
|
| ||||||
The stability of desorbed samples was investigated by reanalyzing the target concentration samples 22.5 h after initial analysis. After the original analysis was perfommed, three vials were recapped with new septa while the remaining three retained their punctured septa. The samples vials were stored in the refrigerated sampling tray for the GC injector. The samples were reanalyzed with fresh standards. The average percent change was -0.5% for samples that were resealed with new septa, and -3.7% for those that retained their punctured septa.
| Table 4.10.2.1.2 | |||||
| Stability of Desorbed Samples for Enflurane from Anasorb 747 | |||||
|
| |||||
| punctured septa replaced | punctured septa retained | ||||
| initial | DE after | initial | DE after | ||
| DE | one day | difference | DE | one day | difference |
| (%) | (%) | (%) | (%) | ||
|
| |||||
| 99.5 | 99.4 | -0.1 | 105.3 | 99.3 | -6.0 |
| 100.2 | 98.9 | -1.3 | 103.9 | 99.8 | -4.1 |
| 100.5 | 100.3 | -0.2 | 100.9 | 99.8 | -1.1 |
| (averages) | (averages) | ||||
| 100.1 | 99.5 | -0.5 | 103.4 | 99.6 | -3.7 |
|
| |||||
4.10.2.2 Halothane
The desorption efficiencies (DE) of halothane were determined
by
| Table 4.10.2.2.1 | ||||||
| Desorption Efficiency of Halothane from Anasorb 747 at High TC | ||||||
|
| ||||||
| × target concn | 0.05× | 0.1× | 0.2× | 0.5× | 1.0× | 2.0× |
| (µg/sample) | 243.5 | 486.2 | 972.4 | 2431 | 4862 | 9724 |
|
| ||||||
| DE (%) | 98.9 | 98.9 | 100.0 | 99.9 | 99.3 | 99.1 |
| 98.7 | 98.2 | 98.1 | -100.1 | 100.6 | 98.4 | |
| 100.4 | 98.2 | 101.5 | 100.2 | 100.1 | 100.7 | |
| 100.6 | 98.3 | 100.4 | 100.5 | 96.5 | 99.6 | |
| 100.4 | 98.1 | 101.3 | 99.3 | 96.6 | 101.1 | |
| 98.7 | 99.9 | 100.8 | 100.7 | 97.0 | 97.1 | |
| 99.6 | 98.6 | 100.4 | 100.1 | 98.4 | 99.3 | |
|
| ||||||
The stability of desorbed samples was investigated by reanalyzing the target concentration samples 22.5 h after infflal analysis. After the original analysis was performed, three vials were recapped with new septa while the remaining three retained their punctured septa. The samples vials were stored in the refrigerated sampling tray for the GC injector. The samples were reanalyzed with fresh standards. The average percent change was +1.5% for samples that were resealed with new septa, and -1.6% for those that retained their punctured septa.
| Table 4.10.2.2.2 | |||||
| Stability of Desorbed Samples for Halothane from Anasorb 747 | |||||
|
| |||||
| punctured septa replaced | punctured septa retained | ||||
| initial | DE after | initial | DE after | ||
| DE | one day | difference | DE | one day | difference |
| (%) | (%) | (%) | (%) | ||
|
| |||||
| 96.5 | 96.6 | +0.1 | 99.3 | 98.0 | -1.36 |
| 96.6 | 98.6 | +2.0 | 100.6 | 99.0 | -1.6 |
| 97.0 | 99.3 | +2.3 | 100.1 | 98.3 | -1.8 |
| (averages) | (averages) | ||||
| 96.7 | 98.2 | +1.5 | 100.0 | 98.4 | -1.6 |
|
| |||||
4.10.2.3 Isoflurane
The desorption effciencies (DE) of isoflurane were determined
by
| Table 4.10.2.3.1 | ||||||
| Desorption Efficiency of Isoflurane from Anasorb 747 at High TC | ||||||
|
| ||||||
| × target concn | 0.05× | 0.1× | 0.2× | 0.5× | 1.0× | 2.0× |
| (µg/sample) | 336 | 672 | 1344 | 3360 | 6720 | 13440 |
|
| ||||||
| DE (%) | 97.9 | 97.7 | 99.3 | 100.3 | 102.8 | 98.3 |
| 98.5 | 96.6 | 96.4 | 101.5 | 104.0 | 99.5 | |
| 99.3 | 97.1 | 100.2 | 98.2 | 99.6 | 101.7 | |
| 98.9 | 96.7 | 99.9 | 100.4 | 100.1 | 100.2 | |
| 96.9 | 98.6 | 101.3 | 100.3 | 99.5 | 101.3 | |
| 96.7 | 96.6 | 97.1 | 99.6 | 99.1 | 96.5 | |
| 98.0 | 97.2 | 99.0 | 100.1 | 100.9 | 99.6 | |
|
| ||||||
The stability of desorbed samples was investigated by reanalyzing the target concentration samples 22.5 h after initial analysis. After the original analysis was performed, three vials were recapped with new septa while the remaining three retained their punctured septa. The samples vials were stored in the refrigerated sampling tray for the GC injector. The samples were reanalyzed with fresh standards. The average percent change was -3.4% for samples that were resealed with new septa, and -4.8% for those that retained their punctured septa.
| Table 4.10.2.3.2 | |||||
| Stability of Desorbed Samples for Isoflurane from Anasorb 747 | |||||
|
| |||||
| punctured septa replaced | punctured septa retained | ||||
| initial | DE after | initial | DE after | ||
| DE | one day | difference | DE | one day | difference |
| (%) | (%) | (%) | (%) | ||
|
| |||||
| 100.1 | 94.0 | -6.1 | 102.8 | 97.2 | -5.6 |
| 99.5 | 96.4 | -3.1 | 104.0 | 97.2 | -6.8 |
| 99.1 | 98.1 | -1.0 | 99.6 | 97.6 | -2.0 |
| (averages) | (averages) | ||||
| 99.6 | 96.2 | -3.4 | 102.1 | 97.3 | -4.8 |
|
| |||||
4.10.3 Anasorb CMS at low target concentration (TC)
- 4.10.3.1 Enflurane
The desorption efficiencies (DE) of enflurane were determined
by
| Table 4.10.3.1.1 | ||||||
| Desorption Efficiency of Enflurane from Anasorb CMS at Low TC | ||||||
|
| ||||||
| × target concn | 0.05× | 0.1× | 0.2× | 0.5× | 1.0× | 2.0× |
| (µg/sample) | 4.56 | 9.12 | 18.24 | 45.6 | 91.2 | 182.4 |
|
| ||||||
| DE (%) | 99.4 | 100.2 | 99.5 | 101.0 | 98.7 | 99.1 |
| 99.2 | 98.7 | 99.3 | 102.2 | 98.7 | 100.2 | |
| 101.4 | 101.2 | 97.7 | 101.1 | 97.7 | 101.8 | |
| 101.5 | 100.0 | 99.0 | 101.3 | 98.7 | 100.4 | |
| 99.4 | 101.6 | 100.0 | 99.4 | 99.4 | 102.8 | |
| 99.4 | 100.5 | 101.7 | 100.9 | 100.3 | 101.8 | |
| 100.2 | 100.4 | 99.5 | 101.0 | 98.9 | 101.0 | |
|
| ||||||
The stability of desorbed samples was investigated by reanalyzing the target concentration samples 22.5 h after initial analysis. After the original analysis was perfommed, three vials were recapped with new septa while the remaining three retained their punctured septa. The samples vials were stored in the refrigerated sampling tray for the GC injector. The samples were reanalyzed with fresh standards. The average percent change was +3.3% for samples that were resealed with new septa, and +0.9% for those that retained their punctured septa.
| Table 4.10.3.1.2 | |||||
| Stability of Desorbed Samples for Enflurane from Anasorb CMS | |||||
|
| |||||
| punctured septa replaced | punctured septa retained | ||||
| initial | DE after | initial | DE after | ||
| DE | one day | difference | DE | one day | difference |
| (%) | (%) | (%) | (%) | ||
|
| |||||
| 98.7 | 101.4 | +2.7 | 98.7 | 98.7 | 0 |
| 98.7 | 101.9 | +3.2 | 99.4 | 99.8 | +0.4 |
| 97.7 | 101.7 | +4.0 | 100.3 | 102.8 | +2.5 |
| (averages) | (averages) | ||||
| 98.4 | 101.7 | +3.3 | 99.5 | 100.4 | +0.9 |
|
| |||||
4.10.3.2 Halothane
The desorption efficiencies (DE) of enflurane were determined
by
| Table 4.10.3.2.1 | ||||||
| Desorpbon Efficiency of Halothane from Anasorb CMS at Low TC | ||||||
|
| ||||||
| × target concn | 0.05× | 0.1× | 0.2× | 0.5× | 1.0× | 2.0× |
| (µg/sample) | 4.862 | 9.724 | 19.45 | 48.62 | 97.24 | 194.5 |
|
| ||||||
| DE (%) | 101.1 | 100.3 | 100.8 | 99.1 | 98.7 | 98.2 |
| 99.7 | 103.2 | 99.1 | 98.3 | 99.5 | 98.7 | |
| 98.8 | 99.5 | 100.8 | 100.3 | 99.1 | 100.1 | |
| 99.7 | 100.0 | 98.5 | 100.0 | 100.2 | 100.5 | |
| 99.5 | 100.5 | 99.4 | 98.9 | 102.4 | 100.1 | |
| 98.9 | 99.7 | 100.2 | 97.5 | 101.1 | 101.7 | |
| 99.6 | 100.5 | 99.8 | 99.0 | 100.2 | 99.9 | |
|
| ||||||
The stability of desorbed samples was investigated by reanalyzing the target concentration samples 2.5 h after initial analysis. After the original analysis was performed, three vials were recapped with new septa while the remaining three retained their punctured septa. The samples vials were stored in the refrigerated sampling tray for the GC injector. The samples were eanalyzed with fresh standards. The average percent change was +1.1% for samples that were resealed with new septa, and -1.6% for those that retained their punctured septa.
| Table 4.10.3.2.2 | |||||
| Stability of Desorbed Samples for Halothane from Anasorb CMS | |||||
|
| |||||
| punctured septa replaced | punctured septa retained | ||||
| initial | DE after | initial | DE after | ||
| DE | one day | difference | DE | one day | difference |
| (%) | (%) | (%) | (%) | ||
|
| |||||
| 98.7 | 100.9 | +2.2 | 100.2 | 99.3 | -0.9 |
| 99.5 | 99.5 | 0 | 102.4 | 99.2 | -3.2 |
| 99.1 | 100.1 | +1.0 | 101.1 | 100.4 | -0.7 |
| (averages) | (averages) | ||||
| 99.1 | 100.2 | +1.1 | 101.2 | 99.6 | -1.6 |
|
| |||||
4.10.3.3 Isoflurane
The desorption efficiencies (DE) of isoflurane were determined
by
| Table 4.10.3.3.1 | ||||||
| Desorption Efficiency of Enflurane from Anasorb CMS at Low TC | ||||||
|
| ||||||
| × target concn | 0.05× | 0.1× | 0.2× | 0.5× | 1.0× | 2.0× |
| (µg/sample) | 4.50 | 9.00 | 18.0 | 45.0 | 90.0 | 183.0 |
|
| ||||||
| DE% | 98.6 | 99.3 | 100.2 | 100.3 | 96.9 | 98.6 |
| 99.3 | 98.1 | 98.1 | 98.9 | 97.6 | 100.2 | |
| 99.1 | 98.5 | 101.1 | 101.3 | 97.1 | 101.5 | |
| 99.0 | 98.3 | 100.1 | 99.6 | 97.9 | 98.7 | |
| 100.1 | 97.2 | 98.5 | 100.2 | 98.5 | 101.6 | |
| 99.5 | 99.0 | 101.4 | 100.6 | 98.4 | 100.4 | |
| 99.3 | 98.4 | 99.9 | 100.2 | 97.7 | 100.2 | |
|
| ||||||
The stability of desorbed samples was investigated by reanalyzing the target concentration samples 22.5 h after initial analysis. After the original analysis was perfomned, three vials were recapped with new septa while the remaining three retained their punctured septa. The samples vials were stored in the refrigerated sampling tray for the GC injector. The samples were reanalyzed with fresh standards. The average percent change was +3.6% for samples that were resealed with new septa, and +1.9% for those that retained their punctured septa.
| Table 4.10.3.3.2 | |||||
| Stability of Desorbed Samples for Enflurane from Anasorb CMS | |||||
|
| |||||
| punctured septa replaced | punctured septa retained | ||||
| initial | DE after | initial | DE after | ||
| DE | one day | difference | DE | one day | difference |
| (%) | (%) | (%) | (%) | ||
|
|
|||||
| 96.9 | 101.6 | +4.7 | 97.9 | 97.1 | -0.8 |
| 97.6 | 99.8 | +2.2 | 98.5 | 101.1 | +2.6 |
| 97.1 | 101.1 | +4.0 | 98.4 | 102.5 | +4.1 |
| (averages) | (averages) | ||||
| 97.2 | 100.8 | +3.8 | 98.3 | 100.2 | +1.9 |
|
| |||||
4.10.4 Anasorb 747 at low target concentration (TC)
- 4.10.4.1 Enflurane
The desorption efficiencies (DE) of enflurane were determined
by
| Table 4.10.4.1.1 | ||||||
| Desorption Efficiency of Enflurane from Anasorb 747 at Low TC | ||||||
|
| ||||||
| × target concn | 0.05× | 0.1× | 0.2× | 0.5× | 1.0× | 2.0× |
| (µg/sample) | 4.56 | 9.12 | 18.24 | 45.6 | 91.2 | 182.4 |
|
| ||||||
| DE (%) | 102.0 | 100.5 | 99.1 | 103.2 | 102.3 | 101.9 |
| 102.2 | 100.2 | 98.4 | 102.3 | 104.2 | 105.3 | |
| 96.9 | 97.9 | 99.6 | 102.2 | 101.6 | 103.7 | |
| 102.4 | 98.2 | 98.2 | 100.9 | 104.6 | 103.8 | |
| 101.2 | 97.7 | 99.7 | 107.8 | 106.3 | 103.6 | |
| 102.9 | 99.4 | 99.0 | 107.4 | 100.6 | 104.6 | |
| 101.3 | 99.0 | 99.0 | 104.0 | 103.3 | 103.8 | |
|
| ||||||
The stability of desorbed samples was investigated by reanalyzing the target concentration samples 22.5 h after initial analysis. After the original analysis was performed, three vials were recapped with new septa while the remaining three retained their punctured septa. The samples vials were stored in the refrigerated sampling tray for the GC injector. The samples were reanalyzed with fresh standards. The average percent change was -2.1% for samples that were resealed with new septa, and -2.9% for those that retained their punctured septa.
| Table 4.10.4.1.2 | |||||
| Stability of Desorbed Samples for Enflurane from Anasorb 747 | |||||
|
| |||||
| punctured septa replaced | punctured septa retained | ||||
| initial | DE after | initial | DE after | ||
| DE | one day | difference | DE | one day | difference |
| (%) | (%) | (%) | (%) | ||
|
|
|||||
| 102.3 | 98.4 | -3.9 | 104.6 | 99.4 | -5.2 |
| 104.2 | 100.9 | -3.3 | 106.3 | 101.9 | -4.4 |
| 101.6 | 102.6 | +1.0 | 100.6 | 101.4 | +0.8 |
| (averages) | (averages) | ||||
| 102.7 | 100.6 | -2.1 | 103.8 | 100.9 | -2.9 |
|
| |||||
4.10.4.2 Halothane
The desorption efficiencies (DE) of halothane were determined
by
| Table 4.10.4.2.1 | ||||||
| Desorption Efficiency of Halothane from Anasorb 747 at Low TC | ||||||
|
| ||||||
| × target concn | 0.05× | 0.1× | 0.2× | 0.5× | 1.0× | 2.0× |
| (µg/sample) | 4.862 | 9.724 | 19.45 | 48.62 | 97.24 | 194.5 |
|
| ||||||
| DE(%) | 85.2 | 95.7 | 94.8 | 98.0 | 98.3 | 101.0 |
| 84.5 | 93.3 | 97.2 | 98.3 | 100.2 | 100.9 | |
| 85.2 | 92.7 | 94.3 | 99.7 | 97.9 | 99.0 | |
| 83.1 | 91.7 | 94.2 | 99.8 | 100.9 | 98.9 | |
| 84.5 | 90.7 | 93.7 | 99.7 | 101.6 | 99.1 | |
| 83.5 | 91.4 | 94.2 | 98.9 | 100.7 | 100.5 | |
| 84.3 | 92.6 | 94.7 | 99.1 | 99.9 | 99.9 | |
|
| ||||||
The stability of desorbed samples was investigated by reanalyzing the target concentration samples 22.5 h after initial analysis. After the original analysis was performed, three vials were recapped with new septa while the remaining three retained their punctured septa. The samples vials were stored in the refrigerated sampling tray for the GC injector. The samples were reanalyzed with fresh standards. The average percent change was ±0% for samples that were resealed with new septa, and -3.0% for those that retained their punctured septa.
| Table 4.10.4.2.2 | |||||
| Stability of Desorbed Samplies for Halothane from Anasorb 747 | |||||
|
| |||||
| punctured septa replaced | punctured septa retained | ||||
| initial | DE after | initial | DE after | ||
| DE | one day | difference | DE | one day | difference |
| (%) | (%) | (%) | (%) | ||
|
|
|||||
| 98.3 | 98.4 | +0.1 | 100.9 | 97.6 | -3.3 |
| 100.2 | 98.1 | -2.1 | 101.6 | 97.8 | -3.8 |
| 97.9 | 99.9 | +2.0 | 100.7 | 98.9 | -1.8 |
| (averages) | (averages) | ||||
| 98.8 | 98.8 | ±0 | 101.1 | 98.1 | -3.0 |
|
| |||||
4.10.4.3 Isoflurane
The desorption efficiencies (DE) of isoflurane were determined
by
| Table 4.10.4.3.1 | ||||||
| Desorption Efficiency of Isoflurane from Anasorb 747 at Low TC | ||||||
|
| ||||||
| × target concn | 0.05× | 0.1× | 0.2× | 0.5× | 1.0× | 2.0× |
| (µg/sample) | 4.50 | 9.00 | 18.0 | 45.0 | 90.0 | 180.0 |
|
| ||||||
| DE (%) | 97.1 | 100.0 | 98.1 | 103.2 | 99.3 | 99.4 |
| 92.3 | 99.6 | 102.2 | 97.6 | 99.9 | 102.8 | |
| 96.4 | 100.2 | 101.1 | 99.4 | 99.2 | 100.8 | |
| 97.8 | 100.0 | 102.5 | 98.5 | 101.5 | 101.7 | |
| 99.4 | 100.0 | 101.0 | 104.0 | 102.9 | 100.8 | |
| 97.9 | 100.1 | 101.4 | 103.8 | 97.5 | 101.5 | |
| 96.8 | 100.0 | 101.1 | 101.1 | 100.1 | 101.2 | |
|
| ||||||
The stability of desorbed samples was investigated by reanalyzing the target concentration samples 22.5 h after initial analysis. After the original analysis was performed, three vials were recapped with new septa while the remaining three retained their punctured septa. The samples vials were stored in the refrigerated sampling tray for the GC injector. The samples were reanalyzed with fresh standards. The average percent change was -1.3% for samples that were resealed with new septa, and -4.4% for those that retained their punctured septa.
| Table 4.10.4.3.2 | |||||
| Stability of Desorbed Samples for Isoflurane from Anasorb 747 | |||||
|
| |||||
| punctured septa replaced | punctured septa retained | ||||
| initial | DE after | initial | DE after | ||
| DE | one day | difference | DE | one day | difference |
| (%) | (%) | (%) | (%) | ||
|
|
|||||
| 99.3 | 97.4 | -1.9 | 101.5 | 96.8 | -4.7 |
| 99.9 | 97.0 | -2.9 | 102.9 | 95.0 | -7.9 |
| 99.2 | 100.2 | +1.0 | 97.5 | 96.8 | -0.7 |
| (averages) | (averages) | ||||
| 99.5 | 98.2 | -1.3 | 100.6 | 96.2 | -4.4 |
|
| |||||
4.11 Qualitative analysis
The anesthetic gases can be easily separated and identified by
GCA\MS. Mass spectra for enflurane, halothane and isoflurane, which
were separated using conditions similar to the information given in
Section 3.5, were obtained from a
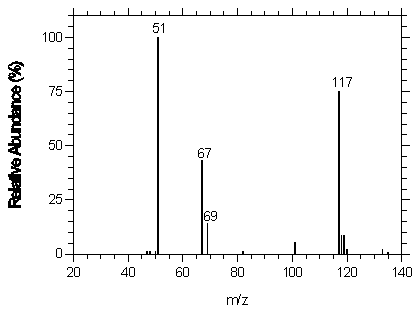
Figure 4.11.1. Mass spectrum of enflurane.
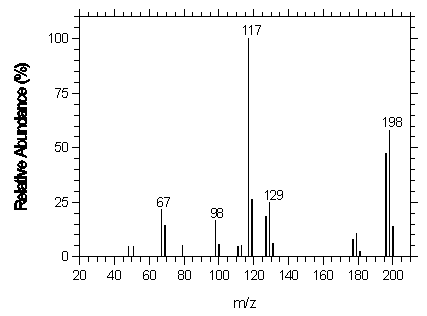
Figure 4.11.2. Mass spectrum of halothane.
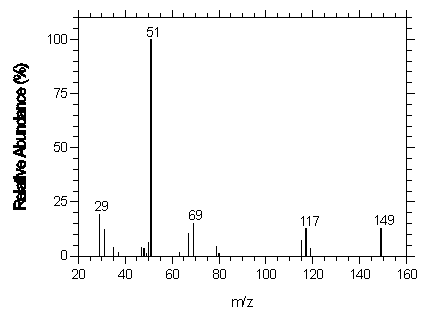
4.12 Nitrous oxide interference
A test was developed to study the ability of nitrous oxide to
interfere with the collection of anesthetic gases on the recommended
sampling tubes. A
| Table 4.12 | ||
| Parts-per-million recovered from
| ||
|
| ||
| Anasorb | halothane | halothane with |
| nitrous oxide | ||
|
| ||
| CMS | 44.9 | 40.3 |
| 747 | 45.6 | 45.7 |
|
| ||
5. References
5.1 OSHA Analytical Methods Manual, 2nd ed., U.S. Department of Labor, Occupational Safety and Health Administration; Salt Lake Technical Center; Salt Lake City, UT 1993; "Method 29 - Enflurane and Halothane" (1981); American Conference of Governmental Industrial Hygienists (ACGIH); Cincinnati, OH, Publ. No. 4542.
5.2 NIOSH Criteria for a Recommended Standard: Occupational
Exposure to Waste Anesthetic Gases and Vapors, U.S. Department of
Health and Human Services, Public Health Service, Center for Disease
Control, National Institute for Health for Occupational Safety and
Health, Cincinnati, OH, 1977, DHHS (NIOSH) Publ.
5.3 NIOSH Recommendations for Occupational Safety and Health:
Compendium of Policy Documents and Statements, U.S. Department of
Health and Human Services, Public Health Service, Center for Disease
Control, National Institute for Health for Occupational Safety and
Health, Cincinnati, OH, 1992, DHHS (NIOSH) Publ.
5.4 Documentation of the Threshold Limit Values and Biological Exposure Indices, 5th ed., American Conference of Governmental Industrial Hygienists (ACGIH); Cincinnati, OH, 1986.
5.5 MRC Monograph on the Evaluation of Carcinogenic Risks to
Humans: Overall Evaluation of Carcinogenicity: An Update of IARC
Monographs Volumes 1 to 42, International Agency for Research on
Cancer (IARC), Lyon, France, 1987, Supplement 7, pp.
5.6 Material Safety Data Sheet: Ethrane, Anaquest, Liberty Corner, NJ, March 1992.
5.7 Material Safety Data Sheet: Forane, Anaquest, Liberty Corner, NJ, March 1992.
5.8 Material Safety Data Sheet
5.9 Merck Index, Budavari, S. Ed., 11th ed., Merck & Co., Rahway, NJ, 1989.
5.10 OSHA Instruction CPL