![]()
| Method no.: | 98 |
| Matrix: | Air |
| Target concentration: | 40 µg/m3 |
| Procedure: | Samples are collected open face on glass fiber
filters coated with veratrylamine
|
| Recommended air volume and sampling rate: |
480 L at 2.0 L/min |
| Reliable quantitation limit: | 0.623 µg/m3 |
| Standard error of estimate at the target concentration: (Section 4.7.) |
6.4% |
| Status of method: | Evaluated method. This method has been subjected to the established evaluation procedures of the Organic Methods Evaluation Branch. |
| Date: November 1992 | Chemist: Yihlin Chan |
OSHA Salt Lake Technical Center
Salt Lake City, UT 84165-0200
1. General Discussion
- 1.1. Background
- 1.1.1. History
Over the years, many authors have reported air sampling and analytical procedures for trimellitic anhydride (TMA). Purnell and Warwick (1980, Ref. 5.1.) collected TMA on glass fiber filters, extracted with aqueous sodium hydroxide, and analyzed by HPLC. Palassis et al. (1981, Ref. 5.2.) collected TMA on DM-800 (PVC-copolymer) membrane filters, extracted with methanol, converted TMA to trimethyl ester with boron trifluoride, and analyzed by GC/FID. Geyer et al. (1986, Ref. 5.3.) also used glass fiber filters, but extracted the samples with 0.05 M sodium hydroxide and analyzed by HPLC using acidified mobile phase. A similar method was published by Ledbetter et al. (1987, Ref. 5.4.) involving glass fiber filters, acetonitrile/water extraction, and HPLC or GC/FID analysis. The current (1990) NIOSH Method (Ref. 5.5.) was based on the procedure of Palassis et al. However, all of these procedures are susceptible to interference from trimellitic acid that is present in the sampled air because none of them differentiates TMA from trimellitic acid.
Rushing et al. (1982, Ref. 5.6.) presented an analytical method for simultaneously determining TMA and trimellitic acid, whereby a sample was dissolved in anhydrous ether and treated with diazomethane. Under anhydrous conditions the anhydride functional group was left intact and TMA was converted to monomethyl ester whereas trimellitic acid was converted to trimetyl ester. However, this procedure can not be applied to air samples because TMA will react with water in the air to form trimellitic acid even in the solid state at room temperature (Ref. 5.7.). TMA deposited on the sampling filter will continually undergo hydrolysis as more air is drawn through the filter.
OSHA has been using a partially evaluated method whereby TMA is collected in 2-propanol bubblers. TMA is converted to mono-2-propyl esters (two isomers) while trimellitic acid is not affected. They are separated by HPLC. Problems with this procedure are that the use of a bubbler is inconvenient, and trace amounts of water in 2-propanol, either present originally or collected during sampling, may hydrolyze a portion of the TMA to the acid before it is converted to the ester.
The method presented here uses coated filters for collecting
airborne TMA. Glass fiber filters are coated with veratrylamine in
order to derivatize TMA in situ.
1.1.2. Toxic effects (This section is for information only and should not be taken as the basis of OSHA policy.) (Refs. 5.8.-5.10.)
TMA causes severe respiratory irritation and sensitization. Exposure may result in noncardiac pulmonary edema, immunological sensitization, and irritation of the pulmonary tract, eyes, nose, and skin. Repeated inhalation of TMA dust or fume over a period of weeks to years can cause an allergic reaction: TMA binds to a protein (human serum albumin) forming an antigen. In susceptible individuals, the body then forms one or more types of antibodies specific to the TMA-antigen. Upon re-exposure, the antibodies react with the TMA-antigen and an allergic reaction occurs. TMA is listed in the Table Z-1-A of the Code of Federal Regulations with a Final Rule Limit of 0.04 mg/m3 TWA. ACGIH, in its Notice of Intended Change, has set the TLV for TMA at 0.04 mg/m3 ceiling.
The pulmonary tract, eyes, nose, and skin all present a moist environment, therefore it is not unreasonable to suspect that the hydrolysis product, trimellitic acid, may be a contributor to the toxic effects attributed to TMA. Despite the fact that this is not established, much less addressed in the literature, the exposure burden to trimellitic acid may be useful supplemental information. Although this method has not been evaluated for trimellitic acid, the analytical conditions presented allow the detection and quantitation of the acid.
1.1.3. Workplace exposure (Refs. 5.1., 5.8.-5.9. and 5.11.)
Trimellitic anhydride is used as a curing agent for epoxy and other resins. It is also used in vinyl chloride plasticizers, various polymers and polyesters, agricultural chemicals, dyes and pigments, paints and coatings, pharmaceuticals, surface active agents, numerous modifiers and intermediates, and specialty chemicals. A number of epoxy resin and surface coating systems, containing between 2-10% TMA, are available as dry powder formulations and are intended for application either by electrostatic dry powder spraying or by dipping pre-heated articles into fluidized beds. Primary occupational exposure to TMA may occur from inhalation of airborne dust and fume when bulk material is handled or during the application of dry powder formulations to surfaces. In 1978, NIOSH estimated that approximately 20,000 U.S. workers were at risk of exposure to trimellitic anhydride in its various applications. The NIOSH 1972 National Occupational Hazard Survey found 475 workers out of 3515 employed in nonmetallic mineral products and engine electrical equipment industries were exposed to TMA. The NIOSH 1982 survey found 97 workers of the total payroll of 269 in the printing ink industry were exposed.
1.1.4. Physical properties and other descriptive information
| TMA | (Refs. 5.12.-5.14.) |
| CAS no.: | 552-30-7 |
| synonyms: | |
| structural formula: |  |
| molecular wt: | 192.13 |
| melting point: | 161-163.5°C |
| boiling point: | 240-245°C at 1.9 kPa (14 mmHg); 390°C at 101.3 kPa (760 mmHg) |
| appearance: | white solid |
| vapor pressure: | 5.3 × 10⁻⁷kPa (4 × 10⁻⁶ mmHg) at 25°C; 0.3 kPa at 200°C; 2 kPa at 250°C; 11 kPa at 300°C |
| flash point: | 227°C by the closed-cup method |
| solubility: | at 25°C, in g/100 g solvent: carbon tetrachloride 0.002; ligroin 0.06; mixed xylenes 0.4; dimethylformamide 15.5; acetone 49.6; ethyl acetate 21.6; 2-butanone 36.5; cyclohexanone 38.4 |
| Derivatives (mixture of two isomers) (personal observations) | |
| chemical name: | |
| synonyms: | TMAVA |
| mixture melting point: | 133-138°C |
| solubility: | soluble in dilute ammonium hydroxide, methanol (reacts slowly), acetone, chloroform |
| appearance: | white crystalline solid |
| molecular wt: | 359.35 |
| structural formula: | |
 | |
The analyte air concentrations throughout this method are based on the recommended sampling and analytical parameters.
- 1.2. Limit defining parameters
- 1.2.1. Detection limit of the analytical procedure
The detection limit of the analytical procedure is 0.30 ng per injection (10-µL injection of a 0.030 µg/mL solution). This is the amount of analyte that will produce a peak with a height that is approximately 5 times the baseline noise. (Section 4.1.)
1.2.2. Detection limit of the overall procedure
The detection limit of the overall procedure is 0.106 µg per sample (0.221 µg/m3). This is the amount of analyte spiked on the sampling device that, upon analysis, produces a peak similar in size to that of the detection limit of the analytical procedure. (Section 4.2.)
1.2.3. Reliable quantitation limit
The reliable quantitation limit is 0.299 µg per sample (0.623 µg/m3). This is the smallest amount of analyte which can be quantitated within the requirements of a recovery of at least 75% and a precision (±1.96 SD) of ±25% or better. (Section 4.3.)
The reliable quantitation limit and detection limits reported in the method are based upon optimization of the instrument for the smallest possible amount of analyte. When the target concentration of analyte is exceptionally higher than these limits, they may not be attainable at the routine operating parameters.
- 1.2.4. Instrument response to the analyte
The instrument response over concentration ranges representing 0.5 to 2 times the target concentration is linear. (Section 4.4.)
1.2.5. Recovery
The recovery of TMAVA from samples used in a 16-day ambient storage test remained above 99%. (Section 4.5.)
1.2.6. Precision (analytical procedure)
The pooled coefficient of variation obtained from replicate determinations of analytical standards at 0.5, 1 and 2 times the target concentration is 0.032. (Section 4.6.)
1.2.7. Precision (overall procedure)
The precision at the 95% confidence level for the 16-day ambient temperature storage test is ±12.5%. (Section 4.7.) This includes an additional ±5% for sampling error.
1.2.8. Reproducibility
Six samples, collected from a test atmosphere of trimellitic anhydride, and a draft copy of this procedure were given to a chemist unassociated with this evaluation. The samples were analyzed after 2 days of storage at room temperature. No individual sample result deviated from its theoretical value by more than the precision reported in Section 1.2.7. (Section 4.8.)
2. Sampling Procedure
- 2.1. Apparatus
- 2.1.1. A personal sampling pump that can be calibrated within
±5% of the recommended flow rate with the sampling device in line.
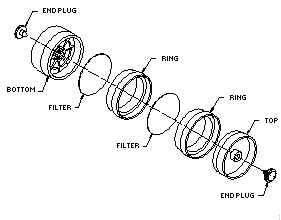
2.1.2. A four-piece polystyrene cassette containing two coated glass fiber filters assembled as shown.
2.1.3. Treated glass fiber filters each coated with 10 mg of
veratrylamine
2.2. Reagents
No reagents are required for sampling.
2.3. Technique
- 2.3.1. Prepare the sampler for open-face sampling by removing
the top piece and the end plug from the bottom piece. Attach the
sampler to the sampling pump with a piece of flexible tubing and
place it in the worker's breathing zone with the open face of the
cassette facing down.
2.3.2. Replace the top piece and the end plug after sampling. Seal each sample with an official Form OSHA-21.
2.3.3. Submit at least one blank with each set of samples. Handle the blank the same as the other samples except draw no air through it.
2.3.4. List any potential interferences on the sample data sheet.
2.4. Sampler capacity
Sampling capacity is approximately 300 µg at a sampling rate of 2.0 L/min. This loading is equivalent to an air volume of 3750 L at 2 times the target concentration. (Section 4.9.)
2.5. Extraction efficiency (Section 4.10.)
- 2.5.1. The average extraction efficiency of TMAVA from the
treated glass fiber filters is 99%.
2.5.2. Extracted samples remain stable for at least 24 h.
2.6. Recommended air volume and sampling rate
- 2.6.1. For TWA samples the recommended air volume is 480 L at
2.0 L/min.
2.6.2. For short term samples the recommended air volume is 30 L at 2.0 L/min (15-min samples).
2.6.3. When short term samples are required, the reliable quantitation limit becomes larger. For example, the reliable quantitation limit is 9.97 µg/m3 when 30 L of air is collected.
2.7. Safety precautions (sampling)
Attach the sampling equipment to the worker in such a manner that it will not interfere with work performance or safety. Follow all safety practices applicable to the work area.
3. Analytical Procedure
- 3.1. Apparatus
- 3.1.1. An HPLC equipped with a UV detector. A BAS 200 HPLC
(Bioanalytical Systems) and Waters WISP auto-sampler were used in
this evaluation.
3.1.2. An HPLC column capable of separating TMAVA from any interferences. An Asahipak C4P-50 column (4.6 × 250 mm) (a polymeric based C4 column, obtained from Keystone Scientific) was used in this evaluation. A Nova-pak C18 column (8 × 100 mm) (Millipore Waters) was used in the alternate HPLC conditions.
3.1.3. An electronic integrator or other suitable means of measuring detector response. A Waters 860 Networking Computer System was used in this evaluation.
3.1.4. Sample vials, 4-mL glass, with poly(tetrafluoroethylene)-lined caps.
3.2. Reagents
- 3.2.1. Trimellitic anhydride. Trimellitic anhydride, 97%, was
obtained from Aldrich. The bottle was 10 years old, and the TMA
content was analyzed to be 93.5%.
3.2.2. Water, HPLC grade. Water was obtained from a Millipore Milli-Q water purification system.
3.2.3. Extraction solution, 0.02 N ammonium hydroxide. The extraction solution was prepared by diluting 5.28 mL of concentrated ammonium hydroxide to 4 L with water.
3.2.4. Acetonitrile, HPLC grade. Acetonitrile, Optima grade, was obtained from Fisher Scientific.
3.2.5. Phosphoric acid. Phosphoric acid, Baker Analyzed Reagent grade, was obtained from J T Baker.
3.2.6. Veratrylamine. Veratrylamine, 97%, was obtained from Aldrich.
3.2.7. Ethyl acetate. Ethyl acetate, B&J Brand High Purity Solvent, was obtained from Baxter.
3.2.8. Toluene. Toluene, B&J Brand High Purity Solvent, was obtained from Baxter.
3.2.9. Acetone. Acetone, B&J Brand High Purity Solvent, was obtained from Baxter.
3.3. Standard preparation
- 3.3.1. Synthesis of TMAVA:
Dissolve TMA (97%, 1.98 g, 0.01 mole) in 50 mL of ethyl acetate. Dilute veratrylamine (97%, 1.72 g, 0.01 mole) with 20 mL of ethyl acetate. With constant stirring, slowly add the TMA solution to the veratrylamine solution. Sonicate the mixture for 1 h. Collect the resulting white precipitate. The yield of the first crop should be approximately 81%. Recrystallize from acetone/toluene. Melting point (capillary tube): 133°C-138°C.
3.3.2. Prepare stock standards by weighing 10-20 mg of TMAVA in 10-mL volumetric flasks and diluting to volume with the extraction solution. Apply a factor of 0.5347 to the weight of TMAVA to convert it to that of TMA. For example, 10 mg of TMAVA dissolved in 10 mL will give a standard stock solution representing 534.7 µg/mL of TMA.
(MW TMA)/(MW TMAVA) = 192.13/359.35 = 0.5347
3.3.3. Alternately, TMA of known purity may be weighed and derivatized with excess veratrylamine in acetonitrile. Weigh 10-15 mg of TMA in a 10-mL volumetric flask. Add 2 mL of acetonitrile and 2 drops of veratrylamine. Sonicate for 15 min. Add the extraction solvent to mark.
3.3.4. Prepare analytical standards by diluting the stock standards with extraction solvent. A 6.4 µg/mL standard solution corresponds to the target concentration.
3.3.5. Prepare a sufficient number of analytical standards to generate a calibration curve. Analytical standard concentrations must bracket sample concentrations.
3.4. Sample preparation
- 3.4.1. Transfer the two filters to separate 4-mL glass vials.
3.4.2. Add 3.0 mL of the extraction solution to each vial.
3.4.3. Cap the vials and shake them on a mechanical shaker for 30 min.
3.5. Analysis
- 3.5.1. HPLC conditions
| column: | Asahipak C4P-50 |
| eluent: | acetonitrile/water/phosphoric acid, 25/75/0.1 |
| flow rate: | 0.8 mL/min |
| injection vol: | 10 µL |
| UV detector: | 205 nm |
| alternate l: | 232 nm |
| ret. times: | trimellitic acid 7.1 min TMAVA 12.8 min |

Figure 3.5.1. Chromatogram of a mixture of TMAVA (6.27 µg/mL) and trimellitic acid (6.12 µg/mL). Key: (1) trimellitic acid, (2) TMAVA.
3.5.2. Alternate HPLC conditions
| column: | Novapak C18 |
| eluent: | acetonitrile/water/phosphoric acid, 22.5/77.5/0.1 |
| flow rate: | 1.0 mL/min |
| injection vol: | 10 µL |
| UV detector: | 205 nm |
| alternate l: | 232 nm |
| ret. times: | trimellitic acid 1.75 min TMAVA isomers 5.2 min and 6.6 min |

Figure 3.5.2. Chromatogram of a mixture of TMAVA (6.27 µg/mL) and trimellitic acid (6.12 µg/mL) under the alternate analytical conditions. Key: (1) trimellitic acid, (2) and (3) TMAVA isomers.
3.5.3. Construct a calibration curve using an external standard method by plotting micrograms per milliliter versus detector response of standards. If the two isomers are separated, sum the peak areas.
3.6. Interferences (analytical)
- 3.6.1. Any compound that absorbs at 205 nm and has a similar
retention time as the analyte is a potential interference.
Generally, chromatographic conditions can be altered to separate an
interference from the analyte.
3.6.2. Retention time on a single column is not considered proof of chemical identity. Additional means of identification could involve: analysis using an alternate HPLC column, detection at another wavelength (peak ratioing), and GC/MS. The mass spectrum obtained from GC/MS showed the base peak at m/e 297, representing the cyclic imide, apparently produced through decarboxylation and cyclization in the GC.
3.7. Calculations
The analyte amount for a sample is obtained from the calibration curve in terms of micrograms per milliliter uncorrected for extraction efficiency. The analyte amount is corrected by subtracting the amount found in the blank. The air concentration is obtained by using the following equation.
| mg/m3 = | A × B
C × D |
| where | A | = | micrograms of analyte per milliliter (blank corrected) |
| B | = | extraction volume | |
| C | = | liters of air sampled | |
| D | = | extraction efficiency |
3.8. Safety precautions (analytical)
- 3.8.1. Restrict the use of all chemicals to a fume hood.
3.8.2. Avoid skin contact and inhalation of all chemicals.
3.8.3. Wear safety glasses, gloves and a lab coat at all times while working with chemicals.
4. Backup Data
- 4.1. Detection limit of the analytical procedure
The injection size recommended in the analytical procedure (10 µL) was used in the determination of the detection limit of the analytical procedure. The detection limit of 0.30 ng on-column was determined by analyzing a dilute standard of TMAVA (0.030 µg/mL). This amount gave a peak with a height about 5 times the height of the baseline noise.
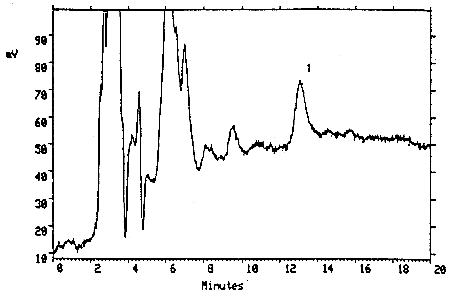
Figure 4.1. Detection limit of the analytical procedure. Key: (1) TMAVA.
4.2. Detection limit of the overall procedure
The detection limit of the overall procedure was determined by analyzing filters liquid spiked with 0.106 µg of TMAVA. This amount corresponds to an air concentration of 0.221 µg/m3. The injection size listed in the analytical procedure (10 µL) was used in the determination of the detection limit of the overall procedure.
Detection Limit of the
Overall Procedure
|
| ||
| µg | µg | percent |
| spiked | recovered | recovered |
|
| ||
| 0.106 | 0.118 | 111.3 |
| 0.106 | 0.132 | 124.5 |
| 0.106 | 0.184 | 173.6 |
| 0.106 | 0.114 | 107.5 |
| 0.106 | 0.098 | 92.5 |
| 0.106 | 0.118 | 111.3 |
|
| ||
4.3. Reliable quantitation limit
The reliable quantitation limit was determined by analyzing filters liquid spiked with 0.299 µg of TMAVA. This amount corresponds to an air concentration of 0.623 µg/m3. The recovery of the analyte from the spiked samples was greater than 75% with a precision of ±25% or better.
Reliable Quantitation Limit
|
| ||
| µg | µg | percent |
| spiked | recovered | recovered |
|
| ||
| 0.299 | 0.296 | 99.0 |
| 0.299 | 0.293 | 98.0 |
| 0.299 | 0.292 | 97.7 |
| 0.299 | 0.294 | 98.3 |
| 0.299 | 0.285 | 95.3 |
| 0.299 | 0.283 | 94.6 |
|
| ||
| mean = 97.2% | ||
| SD = 1.8% | ||
| precision = 3.5% | ||
|
| ||
4.4. Instrument response to the analyte
The instrument response to TMAVA over the range of 0.5 to 2 times the target concentration was determined from multiple injections of analytical standards. The response is linear with a slope of 2.08 × 10⁴ area counts per microgram per milliliter.
Instrument Response
|
| |||
| × target concn | 0.5× | 1.0× | 2.0× |
| µg/mL | 3.21 | 6.42 | 12.83 |
|
| |||
| area counts | 61041 | 131012 | 265178 |
| 66302 | 134085 | 266730 | |
| 63616 | 136377 | 264288 | |
| 65737 | 137022 | 262804 | |
| 65851 | 121815 | 261018 | |
| 65042 | 126993 | 265654 | |
| 65042 | 126993 | 265654 | |
|
| |||
| mean | 64598 | 131217 | 264279 |
|
| |||
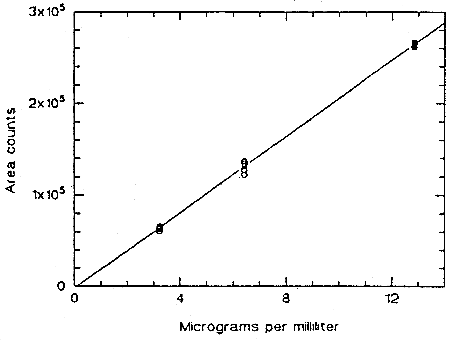
Figure 4.4. Calibration curve for TMAVA.
4.5. Storage data
Storage samples were prepared from a test atmosphere of TMA aerosol. The generation of TMA aerosol is described in detail in Section 4.9. Thirty-six samples were collected from the chamber in two sessions. Six samples were analyzed immediately. The rest of the samples were divided into two groups: 15 were stored in a refrigerator at 5°C, and the other 15 were stored in a closed drawer at about 22°C. Six samples, three from each group, were analyzed at intervals over a period of sixteen days. The average concentration of the day 0 samples, which was 53.6 µg/m3, was set at 100% (no loss due to storage). The recovery of the analyte from the samples stored at ambient temperature remained above 98.9% (from the regression line).
Storage Test
|
| |||||||
| days of storage |
% recovery (ambient) |
%
recovery (refrigerated) | |||||
|
| |||||||
| 0 0 3 6 9 14 16 |
102.2 98.7 94.3 101.3 105.5 98.7 96.4 |
98.2 104.8 104.1 109.5 102.0 98.9 92.8 |
97.3 98.7 95.2 99.9 100.4 100.8 97.8 |
102.2 98.7 102.7 98.2 111.6 97.5 93.6 |
98.2 104.8 94.0 111.6 99.6 97.3 96.8 |
97.3 98.7 108.3 103.4 100.4 99.2 102.9 | |
|
| |||||||
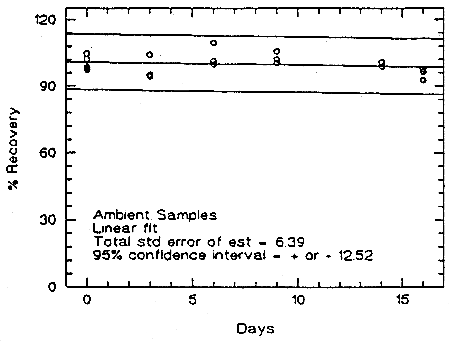
Figure 4.5.1. Storage test at ambient temperature.
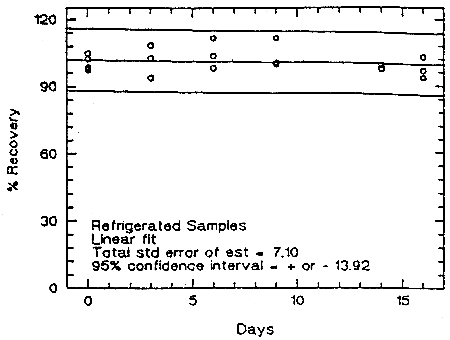
Figure 4.5.2. Storage test at reduced temperature (5°C).
4.6. Precision (analytical method)
The precision of the analytical procedure is defined as the pooled coefficient of variation determined from replicate injections of analytical standards representing 0.5, 1, and 2 times the target concentration. The coefficients of variation are calculated from the data in Table 4.4. The pooled coefficient of variation is 0.032.
Precision of the Analytical Method
(Based on the Data of Table 4.4.)
|
| |||
| × target concn | 0.5× | 1.0× | 2.0× |
| µg/mL | 3.21 | 6.42 | 12.83 |
|
| |||
| SD1 | 1979 | 5913 | 2074 |
| CV | 0.031 | 0.045 | 0.008 |
|
| |||
| 1 - in area counts | |||
4.7. Precision (overall procedure)
The precision of the overall procedure is determined from the storage data. The determination of the standard error of estimate (SEE) for a regression line plotted through the graphed storage data allows the inclusion of storage time as one of the factors affecting overall precision. The SEE is similar to the standard deviation, except it is a measure of dispersion of data about a regression line instead of about a mean. It is determined with the following equation:

| where | n | = | total number of data points |
| k | = | 2 for linear regression | |
| k | = | 3 for quadratic regression | |
| Yobs | = | observed percent recovery at a given time | |
| Yest | = | estimated percent recovery from the regression line at the same given time |
An additional 5% for pump error is added to the SEE by the addition of variances. The precision at the 95% confidence level is obtained by multiplying the SEE (with pump error included) by 1.96 (the z-statistic from the standard normal distribution at the 95% confidence level). The 95% confidence intervals are drawn about their respective regression line in the storage graph as shown in Figure 4.5.1. The data for Figure 4.5.1. were used to determine the SEE of ±6.39% and the precision of the overall procedure of ±12.5%.
4.8. Reproducibility data
Six samples were collected from a test atmosphere of trimellitic anhydride aerosol at 25°C and 80% RH. A draft copy of this method and the samples were submitted to a chemist unassociated with this evaluation for analysis. All of the sample results were within the range of ±12.5%, the precision of the overall procedure.
Reproducibility Data
|
| |||
| µg/m3 | µg/m3 | percent | percent |
| expected | found | found | deviation |
|
| |||
| 40.9 | 40.8 | 99.8 | -0.2 |
| 40.9 | 41.4 | 101.2 | + 1.2 |
| 40.9 | 40.9 | 100.0 | 0.0 |
| 40.9 | 41.0 | 100.2 | + 0.2 |
| 40.9 | 40.4 | 98.8 | -1.2 |
| 40.9 | 40.7 | 99.5 | -0.5 |
|
| |||
4.9. Sampler capacity
The sampler capacity was assessed by sampling from a dynamically generated test atmosphere of TMA at 25°C and 80% RH. The test atmosphere of TMA aerosol was generated by pumping an ethyl acetate solution of TMA at a rate of 0.8 mL/min through a TSI Model 3076 atomizer (TSI Incorporated, St. Paul, MN), where it was dispersed with an air stream of 3.5 L/min. The aerosol passed through an electrostatic charge neutralizer and was mixed with a dilution air stream of 97 L/min (25°C, 80% RH). The diluted aerosol flowed into a chamber containing 18 sampling ports. Each port was fitted with a sampler. After an appropriate equilibration time, sampling was started at 2 L/min. Three samplers were removed every hour. Both the front and the back filters were analyzed for TMAVA and trimellitic acid. Many experiments were run, with different concentrations of TMA feed solution ranging from 60 µg/mL to 1500 µg/mL (actual TMA content of the feed solution was 93.5%, with 6.5% trimellitic acid). The "total" aerosol concentration (sum of trimellitic acid and trimellitic anhydride) obtained ranged from 0.08 to 2.3 mg/m3. No TMAVA or trimellitic acid was detected on the back filter after 6 h of sampling at a total concentration of 2.3 mg/m3. The front filters contained TMAVA and trimellitic acid in a ratio of 90/10 indicating that the aerosol contained approximately 90% trimellitic anhydride and 10% trimellitic acid. Apparently some of the TMA (about 3.5%) in the feed solution was hydrolyzed by the humid air during the short path from the atomizer to the test chamber. This 90/10 ratio remained constant at lower concentrations, but began to decrease at higher concentrations and longer sampling time, indicating that some of the TMA collected on the filter at later stages failed to be derivatized. The plot of the amount of TMAVA collected against the total amount collected (TMAVA and trimellitic acid) showed that the "failure point" occurred at about 300 µg of TMAVA. Beyond this point, some of the TMA deposited on the filter was hydrolyzed by the water in the air before it could react with the derivatizing agent. This failure point is equivalent to 3750 L at 2 times the target concentration.

Figure 4.9. Sampler capacity. Data from five different runs covering high and low concentration ranges.
4.10. Extraction efficiency and stability of extracted samples
- 4.10.1. Extraction efficiency
To determine the extraction efficiency, six glass fiber filters were liquid spiked with TMAVA at the target concentration. These samples were stored overnight at ambient temperature and then extracted with the extraction solvent and analyzed. The average recovery was 99.0%.
Extraction Efficiency
|
| |||
| sample no. |
µg spiked |
µg recovered |
% recovery |
|
| |||
| 1 | 19.09 | 19.21 | 100.6 |
| 2 | 19.09 | 18.84 | 98.7 |
| 3 | 19.09 | 18.67 | 97.8 |
| 4 | 19.09 | 19.12 | 100.2 |
| 5 | 19.09 | 17.94 | 94.0 |
| 6 | 19.09 | 19.54 | 102.4 |
|
| |||
| mean | 99.0 | ||
|
| |||
4.10.2. Stability of extracted samples
The stability of extracted samples was ascertained by reanalyzing the above samples 24 h later with fresh standards. The samples were stored at room temperature and were not recapped. The average recovery was 99.2%.
Stability of Extracted Samples
|
| ||
| initial recovery (%) |
recovery after 24 h (%) |
percent change |
|
| ||
| 100.6 | 100.4 | -0.2 |
| 98.7 | 100.1 | + 1.4 |
| 97.8 | 99.7 | + 1.9 |
| 100.2 | 99.9 | -0.3 |
| 94.0 | 97.4 | + 3.4 |
| 102.4 | 97.6 | -4.8 |
|
| ||
5. References
- 5.1. Purnell, C.J. and C.J. Warwick, J. High Resolut.
Chromatogr. Chromatogr. Commun., 1980, 3, 482-484.
5.2. Palassis, J., J.C. Posner, E. Slick and K. Schulte, Am. Ind. Hyg. Assoc. J., 1981, 42(11), 785.
5.3. Geyer, R., R.C. Jones, and N. Mezin, J. High Resolut. Chromatogr. Chromatogr. Commun., 1986, 9(5), 308-309.
5.4. Ledbetter, A.D., C.L. Leach, N.S. Hatoum and J-C. Roger, Am. Ind. Hyg. Assoc. J., 1987, 48(1), 35-38.
5.5. NIOSH Manual of Analytical Methods, 3rd ed., U.S. Department of Health and Human Services, Center for Disease Control, National Institute of Occupational Safety and Health; DHHS (NIOSH) Publication No. 90-121, U.S. Government Printing Office, Washington, DC, 1990; Method No. P&CAM 322.
5.6. Rushing, L.G., J.R. Althaus, and H.C. Thompson, Jr., J.
Anal. Toxicol., 1982, 6,
5.7. Towle, P.H., et al., in Kirk-Othmer Encyclopedia of Chemical Technology, Standen, A., Ed., 2nd ed., John Wiley & Sons, New York, NY, 1968; Vol. 15, p 473.
5.8. "Notice of Intended Change - Trimellitic Anhydride", Appl. Occup. Environ. Hyg., 1991, 6(7), 625.
5.9. Current Intelligence Bulletin 21: Trimellitic Anhydride (TMA), U.S. Department of Health, Education, and Welfare, Center for Disease Control, National Institute of Occupational Safety and Health, DHEW (NIOSH) Publication No. 78-121, U.S. Government Printing Office, Washington, DC, 1978.
5.10. "Table Z-1-A -- Limits for Air Contaminants", Code of Federal Regulations, Title 29; 1910.1000, U.S. Office of the Federal Register National Archives and Records Administration, Washington, DC; 1991.
5.11. OSHA Computerized Information System Database, OSHA Regulated Substances (PEL Standard) Profiles, Trimellitic Anhydride, Revision Date: 08/15/88, OSHA SLTC, Salt Lake City, UT.
5.12. Merck Index, Budavari, S., Ed., 11th ed., Merck & Co., Rahway, NJ, 1989; p 1386.
5.13. Registry of Toxic Effects of Chemical Substances, Sweet, D.V., Ed.,1985-86 edition, U.S. Department of Health and Human Services, DHHS (NIOSH) Publication No. 87-114, Government Printing Office, Washington, DC, 1987; Vol. 1, p 851.
5.14. Bemis, A.G., et al., in Kirk-Othmer Encyclopedia of Chemical Technology, Grayson, M., et al., Ed., 3rd ed., John Wiley & Sons, New York, NY, 1982; Vol. 17, p 764.