2,4,6-TRINITROTOLUENE (TNT)
| Method no.: | 44 | ||||||
| Matrix: | Air | ||||||
| Target concentration: | DNT or TNT 1.5 mg/m3 (OSHA
PEL) (skin notations apply) | ||||||
| Procedure: | Samples are collected by drawing known volumes of air
through laboratory modified commercial | ||||||
| Recommended air volume and sampling rate: |
60 L at 1 L/min | ||||||
| |||||||
| Reliable quantitation limit, µg/m3: |
| ||||||
| Standard error of estimate at the target concentration, %: (Section 4.7.) |
| ||||||
| Special requirements: | The air sampling pump must be certified by NIOSH or MSHA as intrinsically safe for use in coal mines. | ||||||
| Status of method: | A sampling and analytical method that has been subjected to the established evaluation procedures of the Organic Methods Evaluation Branch. | ||||||
| Date: October 1983 | Chemist: Warren Hendricks | ||||||
OSHA Analytical Laboratory
Salt Lake City, Utah
1. General Discussion
- 1.1. Background
- 1.1.1. History
The fully validated NIOSH air sampling procedure for DNT recommends the use of a 37-mm diameter mixed cellulose ester filter connected in series with a midget bubbler containing ethylene glycol (Ref. 5.1.).
NIOSH has evaluated a collection procedure for TNT which resulted in a failure report. The failure report cited inadequate collection of TNT vapors. The test method utilized filter collection because initial data indicated that TNT would exist primarily as particulate. However, it was determined that generated test atmospheres contained a considerable vapor component which was not retained by the filter. The failure report also indicated poor storage stability for both generated and spiked samples. Volatilization and chemical decomposition were given as possible reasons for the low recoveries following storage. The failure report concluded that a particulate/vapor sampling train should definitely be used to collect TNT (Ref. 5.2.).
This work was undertaken because no adequate TNT sampling method was available and also because the DNT sampling method employs a bubbler which is inconvenient for field use. In addition, a common sampling procedure for DNT and TNT is appropriate because the analytes may be present together.
This method recommends the use of a commercial, large size,
two-section
The air sampling device was evaluated by conducting experiments using a TSI Model 3050 Bergland-Liu Vibrating Orifice Monodisperse Aerosol Generator and a TSI Model 3076 Constant Output Atomizer sub-micrometer aerosol generator. A TSI Model 3200 Particle Mass Monitor was used to detect the presence of an aerosol in the test atmospheres.
Glass fiber filters, midget bubblers containing toluene or
acetone,
Several very adequate analytical techniques are available for DNT and TNT. These techniques include high performance liquid chromatography (HPLC) with ultraviolet detection (Ref. 5.1.), gas chromatography (GC) with electron capture detection (Ref. 5.3.), GC with flame ionization detection (Ref. 5.4.), and GC using a specialized chemiluminescent (TEA/EAP) detector (Ref. 5.5.). A GC/(TEA/ EAP) analytical procedure was selected because the TEA/EAP has been shown to have a sensitive and selective response to the analytes. The GC separation method was necessary because HPLC solvents are not compatible with the TEA/EAP when it is operated in the high temperature nitro mode.
1.1.2. Toxic effects (This section is for information only and should not be taken as the basis of OSHA policy).
DNT Inhalation and skin absorption are both significant
means of occupational exposure to DNT. Intense headaches are
frequently the first reported symptom of overexposure to DNT.
Additional complaints may include fatigue, nausea, vomiting, chest
pain, and weight loss. These symptoms are caused by anoxia (loss of
Technical grade 2,4-DNT, and all six individual isomers of DNT were reported to be mutagenic in the Ames Salmonella/microsome test (Ref. 5.7.). The Salmonella/microsome mutagenicity test was developed for use as a screening method to identify potential carcinogens (Ref. 5.8.).
Practical-grade 2,4-DNT (purity greater than 95%) was administered to rats and mice in a bioassay to test its possible carcinogenicity. The compound was administered in the food to male and female animals of each species for 78 weeks. The results of the study show that dietary administration of 2,4-DNT resulted in fibroma of the skin and subcutaneous tissue of male rats and fibroadenoma of the mammary gland for female rats. No evidence was observed for the carcinogenicity of the agent in mice of either sex (Ref. 5.9.).
TNT Occupational exposure to TNT has been reported to occur by inhalation, ingestion, and skin absorption. Symptoms of overexposure to TNT include liver damage, cyanosis, sneezing, cough, sore throat, peripheral neuritis, muscular pain, kidney damage, cataracts, sensitization dermatitis, leukocytosis (large increase in the number of white cells in the blood) or leukopenia (abnormally low number of white cells in the blood), and aplastic anemia (Ref. 5.6.).
Toxic effects have been observed in humans at TNT levels well below the current OSHA PEL of 1.5 mg/m3. The effects included upper respiratory and gastrointestinal complaints, anemia, liver function abnormalities, and possibly aplastic anemia. A standard of 0.5 mg/m3 (eight hour time-weighted exposure) was suggested for protection against adverse health effects due to TNT exposure (Ref. 5.10.).
TNT was reported to be mutagenic in the Ames Salmonella/microsome test (Ref. 5.11.).
A literature search resulted in no evidence for the carcinogenicity of TNT. Additional carcinogenicity testing of TNT is recommended because the agent is a bacterial mutagen and exposure has been shown to result in aplastic anemia. Aplastic anemia is a condition characterized by defective functioning of the blood-forming organs. Other chemicals which cause aplastic anemia have been identified as carcinogens (Ref. 5.10.).
1.1.3. Potential workplace exposure
DNT In 1975, 308 million pounds of 2,4-DNT and 273 million pounds of a mixture of 2,4- and 2,6-DNT were produced. The chemical is used by the dye manufacturing and munitions industries. It is also used as a chemical intermediate to produce toluene diisocyanate which is used to make polyurethane foam (Ref. 5.12.).
TNT The production of TNT was estimated to be 48 million pounds in 1976. TNT is used as a military explosive (Ref. 5.12.). It is also used as an intermediate in dyestuffs and in photographic chemicals (Ref. 5.13.).
1.1.4. Physical properties (Ref. 5.13. and 5.14.)
|
| ||
| DNT | TNT | |
|
| ||
| CAS no.: | 121-14-2 | 118-96-7 |
| molecular weight: | 182.14 | 227.13 |
| physical appearance: | yellow solid | pale yellow solid |
| UV l maximum, nm: | 252 | 225 |
| melting point (°C): | 71 | 82 |
| boiling point (°C): | 300 (sl. dec.) | 240 (explodes) |
| density (g/mL) (at 71°C): | 1.3208 | 1.654 |
| solubility | ||
| water: | insoluble | insoluble |
| alcohol: | soluble | slightly soluble |
| ether: | soluble | soluble |
| acetone: | very soluble | soluble |
| benzene: | soluble | soluble |
|
| ||
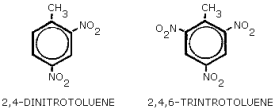
structures: Figure 1.1.4.
synonyms: (Ref. 5.15.)
DNT
TNT
1.2. Limit Defining Parameters (The analyte air concentrations listed throughout this method are based on an air volume of 60 L and a desorption volume of 3.0 mL.)
- 1.2.1. Detection limits of the analytical procedure
The detection limits of the analytical procedures are 0.36 ng for DNT and 0.37 ng for TNT per injection. These are the amounts of analytes which gave peaks whose heights were about 5 times the height of the baseline noise. (Section 4.1.)
1.2.2. Detection limits of the overall procedure
The detection limits of the overall procedure for DNT and TNT are 1.21 µg (20 µg/m3) and 1.23 µg (21 µg/m3) per sample respectively. These are the amounts of analytes spiked on the sampling device which allow recoveries approximately equivalent to the detection limits of the analytical procedure. (Section 4.2.)
1.2.3. Reliable quantitation limits
The reliable quantitation limits for DNT and TNT are 1.21 µg (20 µg/m3) and 1.23 µg (21 µg/m3) per sample respectively. These are the smallest amounts of the analytes which could be quantitated within the requirements of a recovery of at least 75% and a precision (1.96 SD) of ±25% or better. (Section 4.3.)
The reliable quantitation limit and detection limits reported in the method are based upon optimization of the instrument for the smallest possible amount of analyte. When the target concentration of an analyte is exceptionally higher than these limits, they may not be attainable at the routine operating parameters.
- 1.2.4. Sensitivity
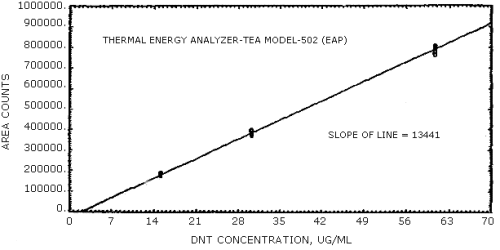
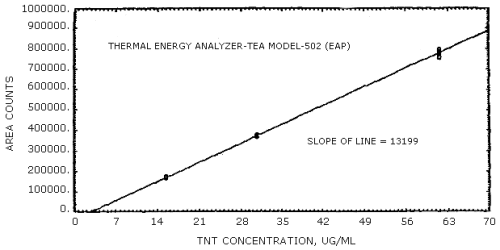
The sensitivities of the analytical procedure over concentration ranges representing 0.5 to 2 times the OSHA PEL, based on the recommended air volume, are 13441 area units per µg/mL for DNT and 13199 area units per µg/mL for TNT. These were determined by the slope of the calibration curves. (Section 4.4.) The sensitivity may vary with the particular instrument used in the analysis.
1.2.5. Recovery
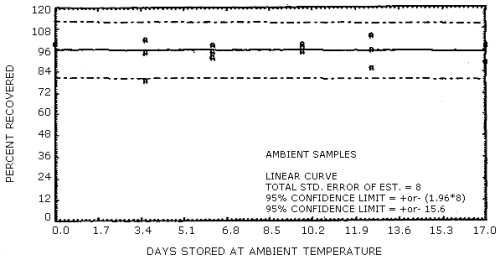
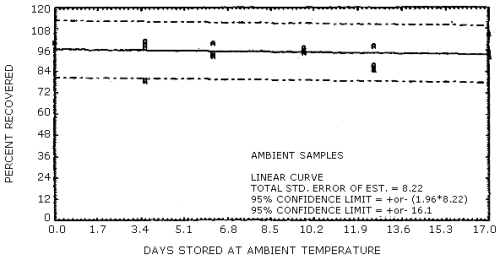
The recoveries of DNT and TNT from samples used in the 19-day ambient temperature test are 95.0% and 93.7%, respectively, relative to control samples. These were recoveries at day 19, determined from the linear regression line of the storage data. (Section 4.7.) The recovery of the analyte from the collection device following storage must be at least 75%.
1.2.6. Precision (analytical procedure only)
The pooled coefficient of variation obtained from replicate determinations of analytical standards at 0.5, 1, and 2 times the target concentration are 0.021 for DNT and 0.015 for TNT. (Section 4.4.)
1.2.7. Precision (overall procedure)
The precisions at the 95% confidence level for the 19-day ambient temperature storage test are ±15.6% for DNT and ±16.1% for TNT. (Section 4.7.) These values each include an additional ±5% for sampling error. The overall procedure must provide results at the target concentration that are ±25% or better at the 95% confidence level.
1.2.8. Reproducibility
Six spiked samples and a draft copy of this procedure were given to a chemist unassociated with this evaluation. The samples were analyzed after 6 days of storage at ambient temperature. The average recoveries (corrected for desorption efficiencies) were 99.2% for DNT and 98.0% for TNT. The standard deviations were 4.9% for DNT and 9.3% for TNT. (Section 4.9.)
1.3. Advantages
- 1.3.1. The sampling and analytical procedures are precise,
reliable, and convenient.
1.3.2. Air samples are stable even when stored at ambient temperature for 19 days.
1.4. Disadvantages
- 1.4.1. This method has not been field tested.
1.4.2. The sampling device is not commercially available.
1.4.3. The TEA/EAP detector is expensive.
2. Sampling Procedure
- 2.1. Apparatus
- 2.1.1. Samples are collected by use of a personal sampling pump
that can be calibrated to within ±5% of the recommended flow rate
with the sampling device in line. The sampling pump must be
certified by NIOSH or MSHA as intrinsically safe for use in coal
mines.
2.1.2. Samples are collected on laboratory modified, commercial,
The laboratory modification of the sampling tubes is performed as
follows: remove the flame sealed tip of the glass sampling tube
nearest the 100-mg section of resin. Leave about 2.5 cm of glass
tubing in front of the 100-mg resin bed. Remove the steel lockspring
wire. Prepare Teflon-support rings by cutting Teflon tubing of 6-mm
o.d. and 4-mm i.d. into 0.5-cm lengths. Cut each Teflon ring along
its 0.5-cm length to permit its easy insertion into the sampling
tube. Place a Teflon-support ring on top of the exposed glass wool
plug of the sampling tube. Be careful not to compress the glass
wool. Severe compression of the glass wool will cause high back
pressures when sampling. Prepare
2.2. Reagents
None required
2.3. Technique
- 2.3.1. Break open the closed end of the laboratory modified
2.3.2. Place the sampling tube vertically in the employee's breathing zone.
2.3.3. After sampling, seal the tube immediately with plastic caps and wrap it lengthwise with OSHA Form 21.
2.3.4. Submit at least one blank for each sample set. The blank should be handled in the same manner as the samples, except that no air is drawn through it.
2.3.5. List any potential interferences on the sample data sheet.
2.3.6. Ship bulk material samples in a separate container to prevent contamination of the air samples. Shipping restrictions may apply to DNT and TNT bulk samples.
2.4. Breakthrough
Several studies were performed to investigate breakthrough and the collection efficiency of the air sampling device. No breakthrough from the 100-mg to the 50-mg resin bed was observed when the recommended air sampler was used. (Section 4.5.)
2.5. Desorption efficiency
The average desorption efficiencies for DNT and TNT from samples spiked at 0.5, 1, and 2 times the OSHA PEL are 97.4% and 95.8% respectively. (Section 4.6.)
2.6. Recommended air volume and sampling rate
- 2.6.1. The recommended air volume is 60 L. The recommended air
volume was not selected because of breakthrough problems but because
the filter disc was found to be somewhat susceptible to plugging. It
was observed that the filter could partially plug when DNT and TNT
concentrations were significantly higher than the PEL. When,
however, the levels were near the PEL, filter plugging was not
significant, even when the test atmosphere was sampled for extended
periods. The 60 L recommended air volume should provide an adequate
safety margin to prevent filter plugging. (Section 4.5.)
2.6.2. The recommended air sampling rate is 1 L/min.
2.7. Interferences (sampling)
- 2.7.1. There are no known interferences to the sampling method.
2.7.2. Suspected interferences should be reported to the laboratory on the sampling data sheets.
2.8. Safety precautions (sampling)
- 2.8.1. The air sampling pump must be certified by NIOSH or MSHA
as intrinsically safe for use in coal mines.
2.8.2. Exercise due caution when breaking open the sampling tubes. Take measures to prevent cuts from the sharp ends of the broken glass tubes.
2.8.3. Attach the sampling equipment to the worker in such a manner that it will not interfere with work performance or safety.
2.8.4. Follow all safety practices that apply to the work area being sampled.
3. Analytical Procedure
- 3.1. Apparatus
- 3.1.1. A GC apparatus equipped with a TEA/EAP detector. For this
evaluation, a Hewlett-Packard Model 5840A gas chromatograph was used
in series with a Thermo Electron Corporation Model 502 A TEA/EAP.
Injections were made using a
3.1.2. A GC column capable of resolving the analytes from each other and potential interferences. A 3-ft × 0.2-mm i.d. glass GC column containing 3% OV 225 on 100/120 mesh Chromosorb W AW was used in this evaluation.
3.1.3. Vials, 4-mL with Teflon-lined caps. Waters WISP vials were used in this evaluation.
3.1.4. Volumetric flasks, pipets and syringes for preparing standards, making dilutions and making injections.
3.2. Reagents
- 3.2.1. HPLC grade acetone.
3.2.2. GC grade helium, oxygen, and air.
3.2.3. DNT and TNT of known purity.
3.3. Standard preparation
- 3.3.1. Prepare stock standards by diluting known amounts of DNT
and TNT with acetone.
3.3.2. Prepare an intermediate standard mixture using known volumes of the stock standards and diluting the mixture with acetone. The intermediate standard should contain 1.5 mg/mL of each analyte.
3.3.3. Prepare fresh working range standards daily by diluting the intermediate standard mixture with acetone. A standard representing the OSHA PEL was obtained by diluting the intermediate standard mixture 1 to 50 with acetone.
3.3.4. Prepare standards at concentrations other than the OSHA PEL in order to generate calibration curves.
3.3.5. Store the standards in a freezer using well-sealed dark containers.
3.4. Sample preparation
- 3.4.1. Transfer both Teflon-support rings, the glass-fiber
filter disc, the front glass wool plug, and the front
3.4.2. Add 3.0 mL of acetone to each vial.
3.4.3. Seal the vials with Teflon-lined caps and allow them to desorb for 1 h. Shake the vials by hand with moderate force several times during the desorption time.
3.4.4. Wash the inside of the glass sampling tube into a separate vial with three 1-mL volumes of acetone.
3.5. Analysis
- 3.5.1. GC conditions
| injection temperature: | 175°C |
| column temperature: | temperature programmed from 150 to 210°C at
|
| helium flow rate: | 30 mL/min |
| injection volume: | 0.9 µL |
| GC column: | 3% OV 225 on 100/120 mesh Chromosorb W AW |
3.5.2. TEA/EAP conditions
| GC pyrolyzer temperature: | 800°C |
| GC interface temperature: | 225°C |
| oxygen flow rate: | 5 mL/min |
3.5.3. Chromatogram: Section 4.8.
3.5.4. Detector response is measured with an electronic integrator.
3.5.5. Use an external standard method to prepare the calibration curve with at least three standard solutions of different concentrations. Prepare the calibration curve daily. Program the integrator to report results in µg/mL.
3.5.6. Bracket sample concentrations with standards.
3.6. Interferences (analytical)
- 3.6.1. Any compound with the same general retention time as DNT
or TNT and which also gives a detector response is a potential
interference. Possible interferences should be reported to the
laboratory with submitted samples by the industrial hygienist.
3.6.2. GC parameters (temperature, column, etc.) may be changed to possibly circumvent interferences.
3.6.3. A useful means of structural designation is GC/MS. It is recommended this procedure be used to confirm samples whenever possible.
3.7. Calculations
- 3.7.1. Results are obtained by use of a calibration curve. The
detector response, for each standard, is plotted against its
concentration in µg/mL and the best straight line through the data
points is determined by linear regression.
3.7.2. The concentration, in µg/mL, for a particular sample is determined by comparing its detector response to the calibration curve. If any DNT and/or TNT is found on the backup section or in the tubing wash, it is added to the amount found on the sampling section. This total amount is then blank corrected.
3.7.3. The DNT and/or TNT air concentration can be expressed using the following equation:
| where | A = µg/mL from Section 3.7.2. |
| B = desorption volume | |
| C = liters of air sampled | |
| D = desorption efficiency (decimal form) |
3.8. Safety precautions (analytical)
- 3.8.1. Avoid skin contact and inhalation of all chemicals used.
3.8.2. Restrict the use of all chemicals to a fume hood whenever possible.
3.8.3. Check that the TEA exhaust is connected to a fume hood.
3.8.4. Wear safety glasses and a lab coat in all laboratory areas.
4. Backup Data
- 4.1. Detection limits of the analytical procedure
The detection limits of the analytical procedure are 0.36 ng for DNT and 0.37 ng for TNT per injection. These amounts produce peaks whose heights were about 5 times the height of the baseline noise (Figure 4.1.).
4.2. Detection limits of the overall procedure
The detection limits of the overall procedure are 1.21 µg (20 µg/m3) for DNT and 1.23 µg (21 µg/m3) for TNT per sample. These are the amounts of analytes spiked on the sampling device which allow recoveries approximately equivalent to the detection limits of the analytical procedure (Table 4.3.1.). The 0.9-µL injection size recommended in the analytical procedure was used in the determination of the detection limits of the overall procedure.
4.3. Reliable quantitation limits
The reliable quantitation limits were determined by liquid spiking six air samplers with 1.21 µg of DNT and 1.23 µg of TNT. These samples were desorbed with 3.0 mL of acetone for 1 h. The 0.9-µL injection volume recommended in the analytical procedure was used to determine the reliable quantitation limits. The results of the analysis of the spiked samples are presented in Table 4.3.1.
Reliable Quantitation Limit Data
|
| ||||
| DNT | TNT | DNT | TNT | |
| sample no. | mass spiked, µg | % recovery | ||
|
| ||||
| 1 2 3 4 5 6 SD 1.96 × SD |
1.21 1.21 1.21 1.21 1.21 1.21 |
1.23 1.23 1.23 1.23 1.23 1.23 |
85.2 95.4 92.0 88.6 105.6 92.7 93.2 7.01 13.7 |
83.2 99.8 101.0 96.2 111.7 89.1 96.8 9.93 19.5 |
|
| ||||
Since the recoveries were near 100% and the precisions were better than ±25%, the detection limits of the overall procedure and the reliable quantitation limits were the same.
4.4. Sensitivity and precision (analytical method only)
The data in Tables 4.4.1. and 4.4.2. were obtained from multiple injections of analytical standards. The data are also presented graphically in Figures 4.4.1. and 4.4.2. The sensitivity for DNT was 13441 area counts per µg/mL and that for TNT was 13199 area counts per µg/mL.
DNT Sensitivity and Precision Data
|
| |||
| × target conc. µg/mL |
0.5× 15.2 |
1× 30.4 |
2× 60.7 |
|
| |||
| area counts SD CV |
180900 181600 188400 179300 180500 180200 181816.7 3313.9 0.0182 |
375000 372500 383900 374900 396200 380500.0 9793.6 0.0257 |
797200 807000 782800 796400 769600 801200 792366.7 13723.2 0.0173 |
|
| |||
TNT Sensitivity and Precision Data
|
| |||
| × target conc. µg/mL |
0.5× 15.4 |
1× 30.8 |
2× 61.6 |
|
| |||
| area counts SD CV |
176300 173600 169900 173100 171200 170900 172500.0 2324.7 0.0135 |
376400 370200 380800 369600 379500 375300.0 5186.5 0.0138 |
794000 779000 784200 798000 758000 780000 782200.0 14096.8 0.0180 |
|
| |||
4.5. Breakthrough
Breakthrough and collection efficiency studies were conducted using
micrometer and
Micrometer Aerosol Data
Test atmospheres were generated by pumping an acetone solution containing 0.46 mg/mL DNT and 0.46 mg/mL TNT into the vibrating orifice aerosol generator at 0.15 mL/min. The frequency of the 20 µm orifice was set at 36 KHz. The monodisperse particle diameters were calculated to be 3.2 µm.
Two runs were performed using both modified and unmodified
Sampling Device Comparison: Micrometer Aerosol
|
| ||||||||
| device | DNT, µg | TNT, µg | ||||||
| type | filter | GW | A | B | filter | GW | A | B |
|
| ||||||||
| run
1 filter/Tenax Tenax run 2 filter/Tenax Tenax |
3.4 --- 15.1 --- |
0.4 2.7 I/A 9.2 |
18.8 23.8 22.4 28.0 |
ND ND ND ND |
15.1 --- 26.6 --- |
1.1 16.9 I/A 29.4 |
2.6 4.2 5.3 4.8 |
ND ND ND ND |
|
| ||||||||
| filter = filter disc in the
recommended air sampling device; GW = front glass wool plug; A = Tenax-GC tube "A" section; B = Tenax-GC tube "B" section; I/A = included A; ND = none detected. | ||||||||
The data in Table 4.5.1. show that both sampling devices provided similar results when the test atmosphere contained 3 µm particles. The front glass wool plug of the unmodified device acted as a partially effective filter for both analytes. The common practice of discarding front glass wool plugs from adsorbent tubes is not supported by these data.
Submicrometer Aerosol Data
Test atmospheres were generated by pumping an acetone solution containing DNT and TNT into the atomizer assembly at 0.7 mL/min. Aerosols generated in this manner are polydisperse and are estimated to have mean particle diameters of 0.02 to 0.3 µm.
Several runs were performed which demonstrated the effectiveness of
the recommended glass fiber filter/
The data in Table 4.5.2. are the results obtained when a
submicrometer aerosol was sampled with two
Sampling Device Comparison With Submicrometer Aerosol
|
| |||
device |
device component |
DNT, µg |
TNT, µg |
|
| |||
| toluene bubblers (two in series) tubes w/o filters (two in series) tube with filter |
bubbler 1 bubbler 2 tube 1 glass wool Tenax A Tenax B tube 2 glass wool Tenax A Tenax B filter Tenax A Tenax B |
84.8 22.6 6.0 73.0 6.3 ND 6.0 3.2 15.4 86.0 ND |
65.8 36.6 34.6 22.8 22.7 7.0 13.3 8.7 124.2 12.2 ND |
|
| |||
The data in Table 4.5.2. show that toluene bubblers and unmodified
A study was performed to determine if midget bubblers containing acetone would be more effective than toluene bubblers. The sampling time for this run was 30 min. The bubbler results are the average of two separate air samples.
Sampling Device Comparison With Submicrometer Aerosol
|
| |||
device |
device components |
DNT, µg |
TNT, µg |
|
| |||
| acetone bubblers (two in series) tube with filter |
bubbler 1 bubbler 2 filter Tenax A Tenax B |
27.6 4.4 21.2 28.1 ND |
20.8 5.8 69.6 1.5 ND |
|
| |||
The acetone bubbler results, presented in Table 4.5.3. show this device to be especially ineffective when used to sample the generated test atmosphere. The acetone bubbler pair results were 35% low for DNT and 62% low for TNT when compared to results obtained with a tube containing a filter.
The data presented in Table 4.5.4. are the results obtained when
the sub-micrometer aerosol was sampled with the recommended device and
also with three
Sampling Device Comparison With Sub-micrometer Aerosols
|
| |||
device |
device components |
DNT, µg |
TNT, µg |
|
| |||
| three tubes in series, with the third tube containing a filter tube with filter |
tube 1 Tenax A Tenax B tube 2 Tenax A Tenax B tube 3 filter Tenax A Tenax B filter Tenax A Tenax B |
233.1 48.7 37.7 5.1 0.9 23.1 ND 216.8 111.8 ND |
201.2 96.3 41.8 11.1 42.9 5.6 ND 396.6 5.2 ND |
|
| |||
The data in Table 4.5.4. show that the breakthrough from tube 1 to the remainder of the multiple tube device was 19% for DNT and 25% for TNT. These data also show that the results from two unmodified tubes were 7% low for DNT and 12% low for TNT. These data agree with the data presented in Table 4.5.2. and show conclusively that a filter disc is required to sample sub-micrometer aerosols containing DNT and TNT.
It was observed that the filter disc was somewhat susceptible to plugging when the generated test atmosphere contained DNT and TNT at concentrations significantly higher than the OSHA PEL. However, filter plugging was not significant when the levels were near the PEL. The data in Table 4.5.6. were taken from five separate studies.
Filter Disc Plugging vs.
Concentrations of DNT and TNT in a Combined Atmosphere
|
| ||||
| DNT conc., mg/m3 |
TNT conc., mg/m3 |
sampling time, min |
air flow rate before sampling, L/min |
air flow rate after sampling, L/min |
|
| ||||
| 6.0 2.0 1.4 1.2 1.1 |
7.1 4.0 2.0 1.2 1.2 |
70 103 58 254 257 |
0.97 0.99 0.96 0.97 0.97 |
0.64 0.88 0.97 0.94 0.90 |
|
| ||||
Filter disc plugging is likely caused by TNT because DNT is easily
air-stripped from the filter. When the recommended sampling device was
preceded by an unmodified
It was decided not to evaluate filter discs preceded by
The high affinity of
4.6. Desorption efficiency
The following data are the results of the analysis of modified
Desorption Efficiency From Sampler When the Filter Was Spiked
|
| ||||||
| × target conc. | 0.5× | 1× | 2× | |||
| analyte µg/sample |
DNT 45.5 |
TNT 46.2 |
DNT 91.0 |
TNT 92.4 |
DNT 182 |
TNT 185 |
|
| ||||||
| desorption efficiency, % |
96.8 93.4 96.9 93.0 99.3 94.9 95.7 |
96.2 94.5 95.1 94.6 95.0 95.0 95.1 |
97.4 95.5 102 96.8 98.9 99.7 98.4 |
91.7 95.6 98.9 94.2 102 97.7 96.7 |
98.4 93.2 102 96.3 95.1 103 98.0 |
98.2 93.0 98.0 96.4 92.4 96.4 95.7 |
|
| ||||||
| The average desorption efficiency for DNT was 97.4% and that for TNT was 95.8%. | ||||||
To determine if the desorption efficiencies were different for DNT
and TNT spiked directly on
Desorption Efficiency
From Sampler When the Sorbent Bed Was Spiked
|
| ||
| analyte × target conc. µg/sample |
DNT 2× 182 |
TNT 2× 185 |
|
| ||
| desorption efficiency, % |
94.4 93.9 91.0 98.6 99.7 95.5 95.5 |
97.3 93.6 94.0 100.8 101.3 98.9 97.6 |
|
| ||
The difference between the means of the desorption efficiencies obtained by spiking different components of the sampling device at 2× the OSHA PEL was tested using a two-tailed Student t distribution. The computations showed that there was no statistical difference between the desorption efficiencies of the two media at the 0.05 level of significance. Therefore, the average desorption efficiencies reported following Table 4.6.1. (97.4% for DNT and 95.8% for TNT) are those which should be used for this method.
4.7. Storage data
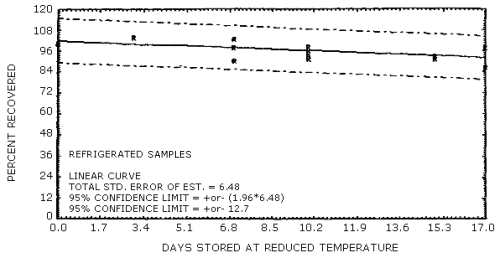
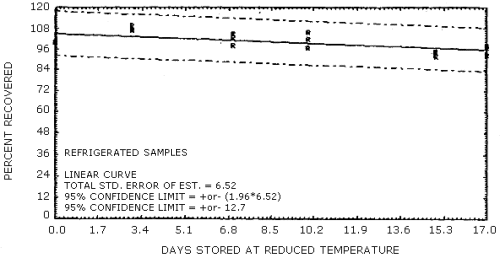
The data in Tables 4.7.1. and 4.7.2. represent the effects of storage at ambient (21 to 26°C) and reduced (-20°C) temperature on samples taken from submicrometer aerosol test atmospheres. The results are not corrected for desorption efficiency. The data are presented graphically in Figures 4.7.1. - 4.7.4.
Because some variability in the air concentrations of DNT and TNT occurred during the generation process, the recoveries in Table 4.7.1. are reported relative to control samples. Four sets of six samples were collected for each temperature studied and then two samples from each set were selected as controls to be analyzed immediately. The remaining four samples from each set were put into the storage sample pool and then, when analyzed, corrected by the appropriate control samples. For the ambient temperature study, the average control sample was 1.60 mg/m3 for DNT and 2.02 mg/m3 for TNT. The average control sample, for the reduced temperature study, was 1.17 mg/m3 for DNT and 1.30 mg/m3 for TNT.
Ambient Temperature Storage Tests
|
| |||||||
| storage time | DNT | TNT | |||||
| (days) | (% recovery) | ||||||
|
| |||||||
| 0 4 7 11 14 19 |
100 102 98.9 99.3 104 98.7 |
100 79.2 91.9 95.0 86.0 98.4 |
100 94.8 94.8 96.9 96.0 89.1 |
100 101 99.7 97.1 97.9 105 |
100 78.8 92.7 94.7 84.7 92.1 |
100 98.1 93.7 94.6 87.4 95.0 | |
|
| |||||||
Reduced Temperature Storage Tests
|
| |||||||
| storage time | DNT | TNT | |||||
| (days) | (% recovery) | ||||||
|
| |||||||
| 0 3 7 10 15 17 |
100 104 90.3 91.5 90.9 86.3 |
100 104 103 98.2 91.5 97.8 |
100 104 97.6 94.1 92.4 97.5 |
100 107 98.3 96.8 92.3 93.0 |
100 110 105 102 94.8 97.3 |
100 108 103 106 94.6 98.3 | |
|
| |||||||
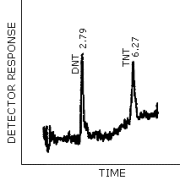
4.8. Chromatogram
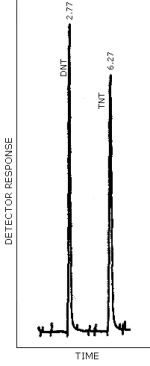
Figure 4.8.1. is a chromatogram obtained by the injection of a standard mixture containing the analytes. The GC column was 3 ft × 0.2-mm i.d., constructed of glass and packed with 3% OV 225 on 100/120 mesh Chromosorb W AW. The injector temperature was maintained at 175°C and the column was temperature programmed from 150 to 210°C at 6°C/min. A TEA Model 502 A (EAP) detector was used in the nitro mode. The TEA/GC pyrolyzer was set at 800°C and the GC interface temperature was 225°C.
4.9. Reproducibility study
Six liquid spiked air samplers and a draft copy of this evaluation were given to a chemist unassociated with this work. The samples were analyzed after 6 days storage at ambient temperature. The results are corrected for desorption efficiency.
Reproducibility Study
|
| ||
amount spiked, µg |
DNT 91.0 |
TNT 92.4 |
|
| ||
| % recovery SD |
101. 107. 99.0 99.2 92.0 96.7 99.2 4.9 |
93.8 111. 97.9 102. 83.0 100. 98.0 9.3 |
|
| ||
5. References
- 5.1. "NIOSH Manual of Analytical Methods", 2nd ed.; Department of
Health, Education and Welfare, National Institute for Occupational
Safety and Health; Cincinnati, OH 1977; Vol. 4, Method No. S215; DHEW
(NIOSH) Publ. (US), NO. 78-175.
5.2. "FAILURE REPORT NO. S226"; National Institute for Occupational Safety and Health; Cincinnati, OH March 17, 1978.
5.3. Bishop, R.E.; Ayers, T.A.; Rinehart, D.S. American Ind. Hygiene Asso. J. (1981), 42, 586.
5.4. Jurinski, N.B.; Podolak, G.E.; Hess, T.L. American Ind. Hygiene Asso. J. (1975), 497.
5.5. Lafleur, A.L.; Mills, K.M. Anal. Chem. (1981), 53, 1202.
5.6. Proctor, N.H.; Hughes, J.P. "Chemical Hazards of the Workplace"; J.B. Lippincott Company: Philadelphia, 1978.
5.7. Couch, D.P.; Allen, P.F.; Abernethy, D.J. Mutation Research (1981), 90, 373.
5.8. McCann, J.; Choi, E.; Yamasaki, E.; Ames, B.N. Proc. Nat. Acad. Sci. USA (1975), 72, 5235.
5.9. "Bioassay of 2,4-Dinitrotoluene for Possible Carcinogenicity" U.S. Department of Health, Education and Welfare, Public Health Service, National Institutes of Health, 1978, DHEW Publ. No. (NIH) 78-1360, NTIS Publ. No. PB-280990.
5.10. Hathaway, J.A. J. of Occupational Medicine (1977), 19, 341.
5.11. Spanggard, R.J.; Mortelmans, K.E.; Griffin, A.F.; Semmon, V.F. Environmental Mutagenesis (1982), 4, 163.
5.12. "Informational Profiles on Potential Occupational Hazards" U.S. Department of Commerce, NTIS, Springfield, VA., PB 276-678.
5.13. "The Condensed Chemical Dictionary" Eighth Edition, Van Nostrand Reinhold Company: New York, 1971.
5.14. Weast, R.C., Ed., "CRC Handbook of Chemistry and Physics", 60th ed.; CRC Press: Boca Raton, FL, 1979.
5.15. "Registry of Toxic Effects of Chemical Substances, 1980 ed." U.S. Department of Health and Human Services, Public Health Service, Centers for Disease Control, National Institute for Occupational Safety and Health, DHHS (NIOSH), Publ. No. 81-116.