and Nitroglycerin (NG)
| Method no.: | 43 | ||||||
| Matrix: | Air | ||||||
| OSHA PEL: (ceiling) |
| ||||||
| Procedure: | Samples are collected by drawing a known volume of
air through large (100/50-mg sorbent beds) sampling tubes containing
| ||||||
| Recommended air volume and sampling rate: |
15 L at 1 L/min | ||||||
| |||||||
| Reliable quantitation limits: |
| ||||||
| Standard error of estimate at the OSHA PEL: (Section 4.7.) |
| ||||||
| Special requirement: | The sampling pump must be certified by NIOSH and/or MSHA (formerly MESA) as intrinsically safe for use in coal mines. | ||||||
| Status of method: | A sampling and analytical method that has been subjected to the established evaluation procedures of the Organic Methods Evaluation Branch. | ||||||
| Date: February 1983 | Chemist: Warren Hendricks | ||||||
OSHA Analytical Laboratory
Salt Lake City, Utah
1. General discussion
- 1.1. Background
- 1.1.1. History
The purpose of this work was to evaluate air sampling and analytical procedures which permit the simultaneous determination of EGDN and NG. It is necessary to determine the analytes together because the OSHA standard regulates exposure to EGDN and/or NG.
Previously, air samples for EGDN and NG have been collected with
midget impingers containing ethanol (Ref. 5.1.), and with sampling
tubes containing silica gel (Ref. 5.1.), Chromosorb 102 porous
polymer beads (Ref. 5.2.), or
The volatile nature of EGDN has been reported in the literature
(Ref. 5.8.) and it was shown, by vapor spiking experiments (Section
4.11.), that the compound could be collected on
Glass fiber filters, midget bubblers containing ethanol, small
(20/10-mg sorbent beds)
1.1.2. Toxic effects (This section is for information only and should not be taken as the basis of OSHA policy).
The OSHA PEL for EGDN and/or NG is 0.2 ppm (1 mg/m3) and the PEL for NG is 0.2 ppm (2 mg/m3). Both of these standards are for ceiling concentrations. An EGDN footnote states that "An atmospheric concentration of not more than 0.02 ppm or personal protection may be necessary to avoid headache". (Ref. 5.9.)
The effects of exposure to EGDN and NG are reported to be similar. Both compounds are potent vasodilating agents. Both chemicals are easily absorbed by inhalation and through the skin. The greatest exposure to workers who directly handle these compounds is probably through skin absorption (Ref. 5.10.).
The effects of exposure to NG were first reported over 100 years ago. The most frequently reported symptoms of exposure to EGDN or NG include intense headaches, dizziness, nausea and decreases in systolic, diastolic and pulse blood pressure. These symptoms are a result of the rapid shift of blood volume from the central to the peripheral circulatory system, caused by the dilation of the blood vessels. After 2 to 4 days of occupational exposure to NG or EGDN, most workers no longer experience symptoms because they have become tolerant to the vasodilatory effects of the compounds (Ref. 5.10.).
Angina pectoris has been reported among workers who were exposed to EGDN and/or NG. In those affected, the angina usually occurred in periods away from work. Sudden deaths without any apparent cause have also been reported among these workers. The deaths, like the angina, occurred more frequently during periods away from work. In most cases, the workers who died suddenly had no symptoms other than angina during periods away from work. The deaths are thought to be related to compensatory vasoconstriction (tolerance) induced by repeated exposure to the substances. Vasoconstriction is thought to lead to spasms of the coronary arteries and then the related angina pectoris and sudden deaths (Ref. 5.10.).
Historically, it has been noted that wives of dynamite workers often experienced heavy menstrual bleeding and had fewer children than did other women. It was also reported that children of dynamite workers were born prematurely and were cyanotic or were not as strong as other children (Ref. 5.10.).
No evidence of teratogenic and embryotoxic effects were observed after the intraperitoneal administration of as much as 20 mg/kg NG to rats during gestation and lactation (Ref. 5.11.).
The potential carcinogenicity of NG has been studied in rats and mice. In the rat study, NG was administered in a 0.03% solution as the drinking water. The investigators concluded that NG was not carcinogenic under the experimental conditions. The mice were exposed to time-weighted average concentrations of 214 mg/L in their drinking water. Increased incidence of adenomas of the pituitary gland was found in the female mice. It was concluded that NG was not carcinogenic under the experimental conditions because the tumors were benign. Even though the tumors were benign, their development indicates that exposure to NG can affect the pituitary gland (Ref. 5.10.).
1.1.3. Potential workplace exposure
EGDN and NG are used with a mixture of sodium nitrate and an absorbent, often wood pulp, to produce dynamite. EGDN is added to lower the freezing point of the EGDN/NG mixture and is currently the major component. The EGDN/NG ratio is about 8/2 or 9/1. This is the only commercial use for EGDN. Because EGDN is more volatile than NG, there is usually more airborne EGDN than NG from the dynamite mixture. In 1976, about 250 million pounds of dynamite, containing 5 to 50% EGDN/NG, were produced by U.S. manufacturers (Ref. 5.10.).
NG is used to make smokeless gun powder and rocket propellants. Single-base powders contain only nitrocellulose, double-base powders contain nitrocellulose and NG, and triple-base powders contain nitrocellulose, NG, and other combustible materials (Ref. 5.10.).
NG is used for medical purposes, primarily to treat angina pectoris and other circulatory disorders (Ref. 5.10.).
Therefore, occupations with potential exposure to EGDN and NG include chemical and explosives workers, drug makers, dynamite makers, miners, missile technicians, munitions loaders, munitions workers, NG workers, rocket fuel makers, shell fillers and smokeless-powder makers. NIOSH estimates that about 8,000 persons in the United States may be exposed to EGDN/NG mixtures or to NG alone (Ref. 5.10.).
1.1.4. Physical properties (Ref. 5.10.).
| EGDN | NG | |
| CAS no.: | 55-63-0 | 628-96-6 |
| molecular weight: | 152.06 | 227.09 |
| specific gravity (20°C): | 1.49 | 1.59 |
| freezing point (°C): | -22.3 | 13.3 |
| vapor pressure (mm Hg at 20°C): | 0.038 to 0.05 | 0.00012 to 0.011 |
| explosion point (°C): | 114 | 256 |
| physical appearance: | yellowish liquid |
pale yellow viscous liquid |
EGDN is insoluble in water, but miscible with most organic solvents. NG is slightly soluble in water, soluble in alcohol and ether.
| Structure: | EGDN |
NG |
A labile, rotational isomer of NG exists; however, it is converted to the stable form after 1 - 2 weeks of storage (Ref. 5.12.).
Synonyms for EGDN, NG and EGDN/NG Mixtures (This data taken directly from Ref. 5.10.)
Ethylene Glycol Dinitrate
1,2-Ethanediol dinitrate*;
EGDN; Ethylene dinitrate; Ethylene nitrate; Glycol dinitrate;
Nitroglycol.
Nitroglycerin
1,2,3-Propanetriol trinitrate*; Angibid;
Anginine; Angiolingual; Angorin; Blasting gelatin; Blasting oil;
Cardamist; Glondin; Glycerin trinitrate; Glycerol trinitrate; GTN;
Lenitral; NG; Niglycon; Nitric acid triester of glycerol;
Nitrine-TDC; Nitro-glycerin; Nitroglycerin, liquid undesensitized**;
Nitroglycerine; Nitroglycerol; Nitroglyn; Nitrol; Nitrolan;
Nitro-lent; Nitrolingual; Nitrolowe; Nitromel; Nitrong; Nitrorectal;
Nitroretard; Nitro-Span; Nitrostat; Nitrozell retard; NTG;
Nysconitrine; Perglottal; Propanetriol trinitrate;
1,2,3-Propanetriyl nitrate; S.N.G.; Soup; Trinalgon; Trinitrin;
Trinitroglycerin; Trinitroglycerol; Vasoglyn.
EGDN/NG Mixtures
Nitroglycerine; Nitroglycerol;
Nitroglycol; Nitroglyn; Nitrogranulogen;
*International Union of Pure and Applied Chemistry (IUPAC) common
name
**Department of Transportation (DOT)
1.2. Limit defining parameters (by TEA detector) (The analyte air concentrations listed throughout this method are based on an air volume of 15 L and a desorption volume of 2.0 mL).
- 1.2.1. Detection limits of the analytical procedure
The detection limits of the analytical procedure for EGDN and NG are 0.93 and 1.4 ng per injection respectively. These are the amounts of analytes which will give peaks whose heights are about 5 times the height of the baseline noise (Section 4.1.).
1.2.2. Detection limits of the overall procedure
The detection limits of the overall procedure for EGDN and NG are 186 ng (2.0 ppb or 12 µg/m3) and 280 ng (2.0 ppb or 19 µg/m3) per sample respectively. These are the amounts of EGDN and NG spiked on the sampling device which allow recoveries of the analytes approximately equivalent to the detection limits of the analytical procedure (Section 4.2.).
1.2.3. Reliable quantitation limits
The reliable quantitation limits for EGDN and NG are 186 ng (2.0 ppb or 12 µg/m3) and 280 ng (2.0 ppb or 19 µg/m3) per sample respectively. These are the smallest amounts of the analytes which can be quantitated within the requirements of a recovery of at least 75% and a precision (1.96 SD) of ±25% or better (Section 4.2.).
The reliable quantitation limit and detection limits reported in the method are based upon optimization of the instrument for the smallest possible amount of analyte. When the target concentration of an analyte is exceptionally higher than these limits, they may not be attainable at the routine operating parameters.
- 1.2.4. Sensitivity
The sensitivities of the analytical procedure over concentration ranges representing 0.5 to 2 times the OSHA PEL, based on the recommended air volume, are 16890 area units per µg/mL for EGDN and 14120 area units per µg/mL for NG. These are determined by the slope of the calibration curves (Section 4.4.). The sensitivity will vary with the particular instrument used in the analysis.
1.2.5. Recovery
The recoveries of the analytes from samples used in a 17-day storage test remained above 93.1% for EGDN and 95.1% for NG when the samples were stored at ambient temperature (Section 4.7.). The recovery of each analyte from the collection medium after storage must be 75% or greater.
1.2.6. Precision (analytical method only)
The pooled coefficients of variation obtained from replicate determinations of analytical standards at 0.5, 1, and 2 times the OSHA PEL were 0.068 for EGDN and 0.053 for NG (Section 4.3.).
1.2.7. Precision (overall procedure)
The precisions at the 95% confidence level for samples used in the 17-day storage test were ±13.5% for EGDN and ±15.8% for NG (Section 4.7.). These values each include an additional ±5% for sampling error. The overall procedure must provide results at the OSHA PEL that are ±25% or better at the 95% confidence level.
1.2.8. Reproducibility
Six vapor spiked (Section 4.11.) samples and a draft copy of this procedure were given to a chemist unassociated with this evaluation. The samples were analyzed after 5 days of storage at ambient temperature. The average recoveries (corrected for desorption efficiency) were 103% for EGDN and 94.6% for NG. The standard deviations were 4.7% for EGDN and 6.1% for NG (Section 4.9.).
1.3. Advantages
- 1.3.1. The sampling and analytical procedures are precise,
reliable and convenient.
1.3.2. The air sampling device is commercially available.
1.4. Disadvantages
- 1.4.1. This method has not been field tested.
1.4.2. The TEA detector is quite expensive.
2. Sampling Procedure
- 2.1. Apparatus
- 2.1.1. Samples are collected by use of a personal sampling pump
that can be calibrated to within ±5% of the recommended flow rate
with the sampling device in line. The sampling pump must be
certified by NIOSH and/or MSHA (formerly MESA) as intrinsically safe
for use in coal mines.
2.1.2. Samples are collected on sampling tubes containing 35/60
mesh
2.2. Reagents
None required
2.3. Technique
- 2.3.1. Break open both ends of the flame-sealed
2.3.2. Place the sampling tube vertically in the employee's breathing zone.
2.3.3. After sampling, seal the tubes immediately with plastic caps and wrap lengthwise with OSHA Form 21.
2.3.4. Submit at least one blank for each sample set. The blank should be handled in the same manner as samples, except no air is drawn through it.
2.3.5. Record sample volume (in liters of air) for each sample, along with any potential interferences.
2.3.6. Ship any bulk sample(s) in a separate container(s) from the air samples.
2.4. Retention efficiency
Retention efficiency studies were performed by first vapor spiking (Section 4.11.) 74 µg of EGDN and 112 µg of NG on the recommended sampling device. An appropriate volume of humid air was pulled through the sampling tube and the device was analyzed. Retention efficiency was defined as the percent of an analyte remaining on the sampling section of the tube after air had been pulled through the device.
The retention efficiency for EGDN was found to be greater than 95% after 426 L of air at about 80% relative humidity and 22°C had been pulled through the vapor spiked tube. The retention efficiency for NG was determined to be 100% on the same sample (Section 4.5.).
Because retention efficiencies for EGDN and NG remained high at
large air volumes, the smaller size (20/10-mg sorbent beds)
Two breakthrough studies were performed using the smaller tubes and in both experiments, EGDN was observed in the second tube before 10 L of air had been sampled. The average 5% breakthrough air volume for EGDN was about 33 L. No breakthrough was observed for NG after 55 L had been sampled (Section 4.5.).
About 19% of the EGDN spiked on small size
The 5% breakthrough air volume for EGDN using the small tubes was
shown to be sufficiently high to permit sampling the recommended air
volume; however, the rapid appearance of EGDN in the reference portion
of the sampling tube indicated that the device may be subject to
channeling. The migration and channeling problems were such that the
small
2.5. Desorption efficiency
The average desorption efficiencies for EGDN and NG from samples spiked at 0.5, 1 and 2 times the OSHA PEL, were 98.1% and 99.4% respectively (Section 4.6.).
2.6. Recommended air volume and sampling rate
- 2.6.1. The recommended air volume is 15 L.
2.6.2. The recommended sampling rate is 1 L/min.
2.7. Interferences (sampling)
- 2.7.1. There are no known interferences to the sampling method.
2.7.2. Suspected interferences should be reported to the laboratory with submitted samples.
2.8. Safety precautions (sampling)
- 2.8.1. The air sampling pump must be certified by NIOSH and/or
MSHA (formerly MESA) as intrinsically safe for use in coal mines.
2.8.2. Exercise due caution when breaking open the sampling tubes. Take measures to prevent cuts from the sharp ends of the broken glass tubes.
2.8.3. Attach the sampling equipment to the worker in such a manner that it will not interfere with work performance or safety.
2.8.4. Follow all safety practices that apply to the work area being sampled.
3. Analytical Procedure
- 3.1. Apparatus
- 3.1.1. An HPLC apparatus equipped with a TEA and/or UV detector.
For this evaluation, a Waters Extended Wavelength Module/Waters
Model 440 Absorbance Detector (214 nm) and a Thermo Electron
Corporation Model 502 TEA (EAP) were used in series with a Waters
M-6000A pump.
3.1.2. An HPLC column capable of resolving the analytes from each other and potential interferences. The column used in this work was a DuPont Zorbax CN, 4.6 mm × 25 cm.
3.1.3. An electronic integrator or other suitable means to measure peak area and record chromatograms. A Hewlett-Packard 3354 B/C Data System was used in this evaluation.
3.1.4. Vials, 4-mL, with Teflon-lined caps. Waters WISP vials were used in this evaluation.
3.1.5. Volumetric flasks, pipets and syringes for preparing standards, making dilutions and making injections.
3.1.6. Dewar flasks, for liquid nitrogen.
3.2. Reagents
- 3.2.1. HPLC grade methanol, isopropanol and isooctane.
3.2.2. Technical grade n-propanol or ethanol for cold traps.
3.2.3. Liquid nitrogen.
3.2.4. GC grade helium.
3.2.5. Medical grade oxygen.
3.2.6. Standard EGDN. A solution containing 1 g EGDN in 100 mL of ethanol was obtained from Atlas Powder Co., Tamqua, PA, for use in this evaluation.
3.2.7. Standard NG. A solution containing 1 g NG in 100 mL of dichloromethane was obtained from Hercules, Inc., Magna, UT, for use in this evaluation.
3.3. Standard preparation
- 3.3.1. Prepare stock standards by diluting known amounts of EGDN
and NG with methanol.
3.3.2. Prepare an intermediate standard mixture using known volumes of the stock standard and diluting the mixture with methanol. The intermediate standard should contain 0.93 mg/mL EGDN and 1.4 mg/mL NG.
3.3.3. Prepare fresh working range standards daily by diluting the intermediate standard mixture with methanol. Standards representing the OSHA PEL were obtained by diluting the intermediate standard mixture 1 to 50 with methanol.
3.3.4. Prepare standards at concentrations other than the OSHA PEL in order to generate the calibration curve.
3.3.5. Store the standards in a freezer using well-sealed, dark containers.
3.4. Sample preparation
- 3.4.1. Transfer each section of the sample to separate vials.
Place the front glass wool plug in the vial with the front section
of the
3.4.2. Add 2.0 mL of methanol to each vial.
3.4.3. Seal the vials with Teflon-lined caps and allow them to desorb for 1 h. Gently shake the vials several times during the desorption time.
3.5. Analysis
- 3.5.1.
| column: | DuPont Zorbax CN (4.6 mm × 25 cm) |
| solvent: | isooctane/isopropanol/methanol (90:6:4) (v/v) |
| flow rate: | 1 mL/min |
| injection volume: | 10 µL |
| retention time: | EGDN - 8.4 min NG - 11.5 min |
3.5.2. UV detector
| wavelength: | 214 nm |
3.5.3. TEA detector
| HPLC pyrolyzer temp: | 550°C |
| HPLC interface temp: | 100°C |
| oxygen flow rate: | 5 mL/min |
| helium flow rate: | 30 mL/min (carrier gas) |
| cold trap temp: | -80°C (ethanol/water or n-propanol/water, with liquid nitrogen) |
3.5.4. Chromatograms: Section 4.8.
3.5.5. Detector response is measured with an electronic integrator or other suitable means.
3.5.6. Use an external standard method to prepare the calibration curve with at least three standard solutions of different concentrations. Prepare the calibration curve daily. program the integrator to report results in µg/mL.
3.5.7. Bracket sample concentrations with standards.
3.6. Interferences (analytical)
- 3.6.1. Any compound with the same general retention time as EGDN
or NG and which also gives a detector response is a potential
interference. Possible interferences should be reported to the
laboratory with submitted samples by the industrial hygienist.
3.6.2. HPLC parameters (solvent composition, column, detector, etc.) may be changed to possibly circumvent interferences.
3.6.3. The only unequivocal means of structure designation is by GC/MS. It is recommended this procedure be used to confirm samples whenever possible.
3.7. Calculations
- 3.7.1. Results are obtained by use of a calibration curve. The
detector response, for each standard, is plotted against its
concentration in µg/mL and the best straight line through the data
points is determined by linear regression.
3.7.2. The concentration, in µg/mL, for a particular sample is determined by comparing its detector response to the calibration curve. If any EGDN or NG is found on the backup section, it is added to the amount found on the front section. This total amount is then corrected by subtracting any interference found in the blank.
3.7.3. The EGDN and/or NG air concentration can be expressed using the following equations:
| where | A | = | µg/mL from Section 3.7.2. |
| B | = | desorption volume (mL) | |
| C | = | sample air volume (L) | |
| D | = | desorption efficiency |
or ppm = (mg/m3)(24.46)/molecular weight
| where | molecular weights | = | EGDN, 152.06; NG, 227.09 |
| 24.46 | = | molar volume of an ideal gas at 760 mm Hg and 25°C |
3.8. Safety precautions (analytical)
- 3.8.1. Avoid skin contact and inhalation of all chemicals used.
3.8.2. Restrict the use of all chemicals to a fume hood whenever possible.
3.8.3. The handling of EGDN and NG, especially in more concentrated forms, may be hazardous because of the instability of the compounds.
3.8.4. Check to be sure that the TEA exhaust is connected to a fume hood.
3.8.5. Wear safety glasses and a lab coat in all laboratory areas.
4. Backup Data
- 4.1. Detection limit of the analytical procedure
The detection limit of the analytical procedure was 0.93 ng for EGDN and 1.4 ng for NG. These amounts produce peaks whose heights were about 5 times the height of the baseline noise (Figure 4.1.).
4.2. Detection limit of the overall procedure and reliable quantitation limit
The detection limit of the overall procedure was 186 ng/sample for EGDN and 280 ng/sample for NG. The equivalent air concentrations were 12 µg/m3 (2.0 ppb) for EGDN and 19 µg/m3 (2.0 ppb) for NG. The 10-µL injection size recommended in the analytical procedure was used in the determination of the detection limit of the overall procedure.
The reliable quantitation limits were determined by liquid spiking
6 large
Reliable Quantitation Limit Data
|
| ||
| % recovery | ||
| sample no. | EGDN | NG |
|
| ||
| 1 2 3 4 5 6 SD 1.96 SD |
85.7 100 84.9 93.7 98.0 80.3 90.4 7.9 16 |
96.3 98.4 100 100 88.6 91.0 95.7 4.8 9.5 |
|
| ||
Since the recoveries were near 100% and also the precisions were better than ±25%, the detection limits of the overall procedure and the reliable quantitation limits were the same.
4.3. Precision (analytical method only)
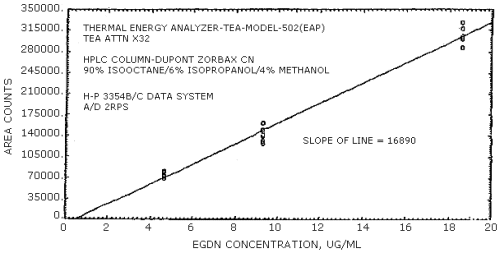
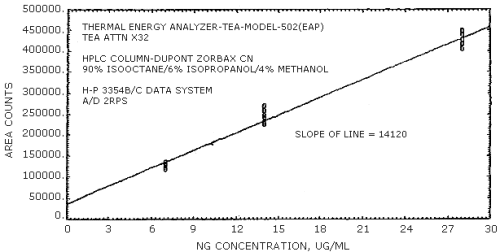
The following data were obtained from multiple injections of analytical standards. The data are also presented graphically in Figures 4.3.1. and 4.3.2.
Sensitivity and Precision Data for EGDN
|
| |||
| × target conc. µg/mL |
0.5× 4.65 |
1× 9.3 |
2× 18.6 |
|
| |||
| area
counts SD CV |
68505 68152 73602 78557 75178 81354 74224.7 5300.7 0.0714 |
161111 148645 142462 139825 132371 127943 142059.5 11871.2 0.0836 |
328323 305681 318531 303060 301729 288860 307697.3 13847.9 0.0450 |
|
| |||
Sensitivity and Precision Data for NG
|
| |||
| × target conc. µg/mL |
0.5× 7.0 |
1× 14.0 |
2× 28.0 |
|
| |||
| area
counts SD CV |
135816 126207 128996 122751 125092 117101 125993.8 6260.1 0.0497 |
226043 230653 242265 244586 258245 270668 245410.0 16769.8 0.0683 |
405955 417600 419134 439648 428030 450057 426737.3 16033.5 0.0376 |
|
| |||
4.4. Sensitivity
The sensitivity for EGDN was 16890 area counts per µg/mL and that for NG was 14120 area counts per µg/mL. These values were determined from Figures 4.3.1. and 4.3.2.
4.5. Retention efficiency data
Retention efficiency studies were performed by vapor spiking
(Section 4.11.) 74 µg of EGDN and 112 µg of NG on each of several
large
Retention Efficiency
|
| ||||
| air volume L |
EGDN recovery front sec.,% |
EGDN recovery back sec.,% |
NG recovery front sec.,% |
NG recovery back sec.,% |
|
| ||||
| 171.3 248.1 305.0 333.0 370.0 383.0 397.0 426.0 |
100 100 100 99.6 98.6 98.5 98.1 97.0 |
ND Trace Trace 0.4 1.4 1.5 1.9 3.0 |
100 100 100 100 100 100 100 100 |
Trace ND ND ND ND ND ND ND |
|
| ||||
Two breakthrough experiments were performed with small
Breakthrough Studies
|
| |||
| study one | study two | ||
|
|
| ||
| air volume, L |
cumulative EGDN breakthrough, % |
air volume, L |
cumulative EGDN breakthrough, % |
|
| |||
| 4.5 13.6 22.7 31.8 40.9 50.0 |
0.7 1.7 3.1 4.3 5.1 7.8 |
9.2 18.4 27.6 36.8 46.0 55.2 |
1.4 3.2 5.3 6.3 6.9 9.2 |
|
| |||
All of the vapor spiked NG was recovered from the first tube in both studies. The EGDN recovery for the first tube in Study One was 92.2% and that for the first tube in Study Two was 90.8%.
A migration study was performed with small
Migration Study
|
| ||||
| sampling section | back section | |||
|
|
| |||
| recovery, % | recovery, % | |||
| day | EGDN | NG | EGDN | NG |
|
| ||||
| 0 7 14 |
100 68.2 57.6 |
96.3 99.2 93.6 |
-- 19.2 19.2 |
-- -- -- |
|
| ||||
4.6. Desorption efficiency
The following data represent the analysis of large
Desorption Efficiency
|
| ||||||
| × PEL | 0.5× | 1× | 2× | |||
|
|
|
| ||||
| analyte | EGDN | NG | EGDN | NG | EGDN | NG |
| µg/sample | 9.3 | 14.0 | 18.6 | 28.0 | 37.2 | 56.0 |
|
| ||||||
| desorption efficiencies, % |
102 105 102 96.9 95.4 98.5 100 |
102 104 102 98.9 97.7 98.3 100 |
99.5 97.1 96.3 97.7 96.3 105 98.6 |
103 98.9 94.2 93.7 93.8 100 97.3 |
92.8 97.9 97.1 98.4 95.9 93.1 95.9 |
101 103 101 101 99.2 98.9 101 |
|
| ||||||
The average desorption efficiency for EGDN was 98.1% and that for NG was 99.4%.
4.7. Storage data
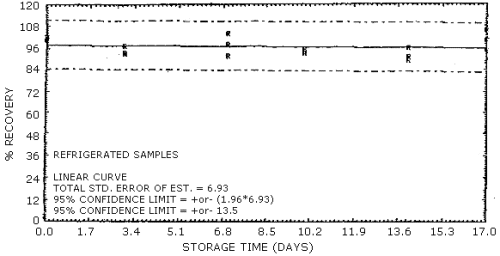
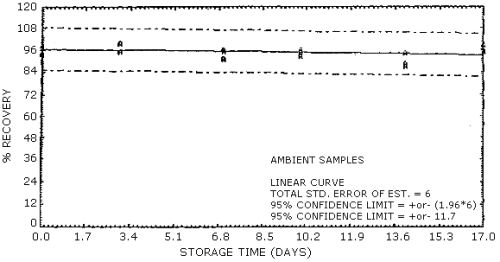
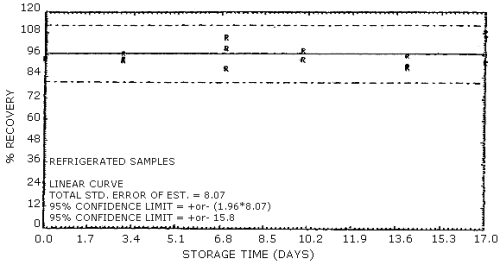
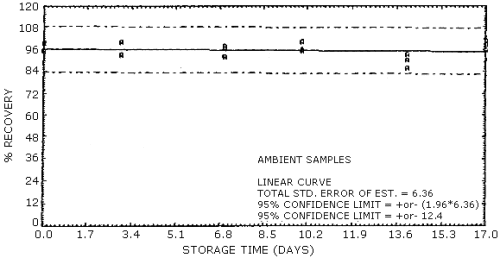
The data in Table 4.7.1. represent the effects of storage at
ambient (21 to 26°C) and reduced
Storage Tests for EGDN
|
| |||||||
| storage time | % recovery | ||||||
| (days) | (refrigerated) | (ambient) | |||||
|
| |||||||
| 0 3 7 10 14 17 |
101 97.4 91.9 94.4 91.1 106 |
101 93.9 104 93.3 89.2 95.6 |
102 92.9 98.0 95.9 96.2 101 |
98.0 100 96.3 96.3 87.1 98.5 |
97.3 95.4 91.0 94.8 88.4 95.8 |
94.1 99.8 95.5 92.5 94.1 95.0 | |
|
| |||||||
Storage Tests for NG
|
| |||||||
| storage time | % recovery | ||||||
| (days) | (refrigerated) | (ambient) | |||||
|
| |||||||
| 0 3 7 10 14 17 |
103 97.1 89.0 93.9 90.1 109 |
94.0 93.1 106 93.6 89.3 92.1 |
103 93.7 100 99.0 95.7 106 |
99.7 99.9 96.5 100 85.9 101 |
95.9 93.0 92.2 95.3 90.0 95.5 |
95.2 93.3 97.7 96.1 93.4 98.6 | |
|
| |||||||
The back sections of the samples used in the ambient temperature storage study were analyzed on days 10, 14, and 17 to determine if migration from the sampling sections had occurred. No EGDN or NG was found in the back sections.
4.8. Chromatograms
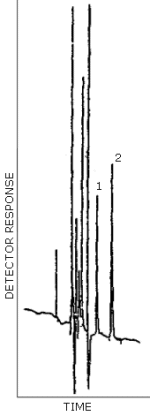
- 4.8.1. HPLC/UV Chromatogram
Figure 4.8.1. is a chromatogram obtained by the injection of 10 µL of a standard mixture containing the analytes. The HPLC column was 4.6 mm × 25 cm DuPont Zorbax CN. The mobile phase was 90% isooctane, 6% isopropanol, and 4% methanol. The flow rate was 1 mL/min. The UV detector wavelength was 214 nm.
4.8.2. HPLC/TEA Chromatogram
Figure 4.8.2. is a chromatogram obtained by the injection of 10 µL of a standard mixture containing the analytes. In this case, the TEA was connected in series with a UV detector. The HPLC column and mobile phase was the same as used in Figure 4.8.1.
4.9. Reproducibility study
Six vapor spiked large
Reproducibility Study
|
| ||
| amount vapor spiked, µg |
EGDN 18.6 |
NG 28.0 |
|
| ||
| recovery, % SD, % |
103 103 100 103 98.3 112 103 4.7 |
97.5 93.9 85.4 100 89.6 101 94.6 6.1 |
|
| ||
4.10. Aerosol data
NG aerosols were generated by means of a Model 3050 Berland-Liu
Vibrating Orifice Monodisperse Aerosol Generator. The frequency of the
orifice was set at 7.5 KHz. An isopropanol solution containing 0.25
mg/mL of NG was metered into the system at 0.20 mL/min with a syringe
pump. The resulting stream was diluted with air (0.05
m3/min) to produce a 2.4-µm diameter
monodisperse aerosol containing 1 mg/m3 of
NG. The aerosol was sampled by means of ports connected to a sampling
chamber. Several experimental runs were performed to compare the
collection efficiencies of glass fiber filters, midget bubblers
containing ethanol, small
NG aerosol samples were collected using small
In another experiment, 3 glass fiber filters and 3 small
The bubbler results were taken as the generation efficiency of the
aerosol apparatus because no NG was detected in backup bubblers or
backup
The data in Table 4.10. are the results of 15 aerosol runs. Each
data point represents the average of at least two separate air samples
taken using identical sampling devices. The bubblers each contained 15
mL of ethanol as the trapping solution. Corrections for bubbler volume
and desorption efficiency were made in the reported results. The
results for the
Summary of NG Aerosol Results
|
| |||
run no. |
bubbler, mg/m3 |
(ratio) large Tenax, mg/m3 bubbler, mg/m3 |
(ratio) small Tenax, mg/m3 bubbler, mg/m3 |
|
| |||
| 1 2 3 4 5 6 7 8 9 10 11 12 13 14 15 SD CV |
0.77 0.77 0.78 0.78 0.81 0.78 0.79 0.76 0.80 0.78 0.74 0.68 0.81 0.56 0.69 0.75 0.066 0.087 |
---- ---- ---- ---- 0.79 ---- 0.99 0.95 0.82 0.90 0.99 0.97 0.93 0.95 0.92 0.92 0.068 0.074 |
0.91 1.1 0.96 0.73 ---- 1.0 1.0 0.95 0.92 0.97 1.1 1.2 1.1 0.99 1.0 1.0 0.11 0.11 |
|
| |||
The data in Table 4.10. indicate that the small
4.11. Vapor spiking technique
The
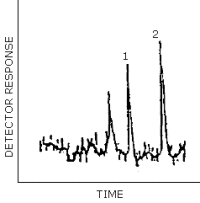
Peak identification was as follows:
1, EGDN; 2, NG.
Peak identification was as follows:
1, EGDN; 2, NG.
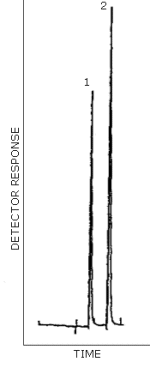
Peak identification was as follows:
1, EGDN; 2, NG.
5. References
- 5.1. Hogstedt, C.; Davidsson, B. American Ind. Hygiene Assoc.
J. (1980), 41, 373.
5.2. Chrostowski, J.E.; Holmes, R.N.; Rehn, B.W. J. of Forensic Sciences (1975), 611.
5.3. "NIOSH Manual of Analytical Methods", 2nd ed.; Department of Health, Education and Welfare, National Institute for Occupational Safety and Health; Cincinnati, OH. 1977; Vol. 3, Method No. S216; DHEW (NIOSH) Publ. (U.S.), No. 77-1576.
5.4. "Profiling Common Explosives by LCEC" LCEC Applications Note No. 32; Bioanalytical Systems Inc.; West Lafayette, IN.
5.5. McLinley, W.A. J. of Analytical Toxicology, (1981), 5, 209.
5.6. Krull, I.S.; Davis, E.A.; Santasania, C.; Krous, S.; Basch, A.; Bemberger, Y. Analytical Letters (1981), 14, 1363.
5.7. Lafleur, A.L; Morriseau, B.D. Anal. Chem. (1980), 52, 1313.
5.8. "Documentation of the Threshold Limit Values", 4th ed.; American Conference of Governmental Industrial Hygienists, Cincinnati, OH, (1981), 184.
5.9. "General Industry" OSHA Safety and Health Standards (29 CFR 1910), U.S. Department of Labor, Occupational Safety and Health Administration, OSHA 2206, Revised June, 1981.
5.10. "Criteria for a Recommended Standard....Occupational Exposure to Nitroglycerin and Ethylene Glycol Dinitrate"; Department of Health, Education and Welfare; National Institute for Occupational Safety and Health; Cincinnati, OH. (1978); DHEW (NIOSH) Publ. (U.S.) No. 78-167.
5.11. Oketani, Y.; Mitsozono, T.; Ichikawa, K.; Itono, Y.; Gojo, T.; Gofuku, M.; Konoha, N. Oyo Yakuri (1981), 22, 737.
5.12. Urbanski, T. "Chemistry and Technology of Explosives", Vol II, Pergamon Press: Oxford, 1965, p. 36.