| Method no.: | 29 |
| Matrix: | Air |
| Target concentration: | Halothane - 1 ppm (8.1
mg/m3) Enflurane - 1 ppm (7.6 mg/m3) |
| Procedure: | Two standard size charcoal tubes are connected in series for each sample. Samples are desorbed with carbon disulfide (CS2) and analyzed by gas chromatography (GC) using a flame ionization detector (FID). |
| Recommended air volume and sampling rate: |
10 L at 0.1 L/min |
| Reliable quantitation limit: | Halothane - 0.023 ppm (0.19
mg/m3) Enflurane - 0.040 ppm (0.30 mg/m3) |
| Standard error of estimate at the target concentration: |
|
| (Figure 4.7.4.) (Figure 4.7.2.) |
Halothane - 6.43% Enflurane - 8.01% |
| Status of method: | A sampling and analytical method which has been subjected to the established evaluation procedures of the Organic Methods Evaluation Branch. |
| Date: May 1981 | Chemist: Mike Shulsky |
OSHA Analytical Laboratory
Salt Lake City, Utah
1. General Discussion
- 1.1. Background
- 1.1.1. History
Halothane has been collected in glass sampling bulbs with subsequent GC analysis using an electron capture detector. (Ref. 5.1.) Charcoal passive dosimeters have been used for collection of both enflurane and halothane with GC/FID analysis (Ref. 5.2.).
Charcoal tubes were used in this evaluation because of their widespread use for other organics and their efficiency for collecting both analytes. Also, with charcoal high desorptions were obtained for both analytes. The analytical method is sensitive and analytical parameters can be adjusted to eliminate interferences.
NIOSH recommends a 1 h ceiling value of 2 ppm for both halothane
and enflurane (Ref. 5.4.). Since ceiling values in the Federal
Register are usually twice the
1.1.2. Toxic effects (This section is for information only and should not be taken as the basis of OSHA policy).
There are conflicting reports in the literature dealing with the
effects of exposure of humans to low levels of anesthetics. One
study indicates that chronic low-level exposure of female operating
room personnel to anesthetics in general can cause spontaneous
abortion (Ref. 5.3.). Animal studies have shown that chronic
halothane exposures of
1.1.3. Workplace exposure
Enflurane and halothane are two of the three most commonly used anesthetics. Occupational exposure may occur wherever anesthetics are used such as operating rooms, veterinarian hospitals, and dental offices. The number of people potentially exposed is estimated to be 215,000 (Ref. 5.4.).
1.1.4. Physical properties (Ref. 5.4. unless otherwise stated)
| halothane | |
| molecular weight: | 197.4 |
| boiling point: | 50°C |
| specific gravity: | 1.871 (Ref. 5.6.) |
| vapor pressure: | 243 mm Hg (20°C) |
| synonyms: | |
| formula: | CHClBrCF3 |
| enflurane | |
| molecular weight: | 184.5 |
| boiling point: | 56°C |
| specific gravity: | 1.52 |
| vapor pressure: | 175 mm Hg (20°C) |
| synonyms: | |
| formula: | CHFClCF2OCHF2 |
1.2. Limit defining parameters
- 1.2.1. Detection limit of the analytical procedure
The detection limit of the analytical procedure is 6.08 ng/injection for enflurane and 3.74 ng/injection for halothane. These are the amounts which give peaks about 5 times the baseline noise. (Section 4.1.1.)
1.2.2. Detection limit of the overall procedure
The detection limit for the overall procedure is 3.04 µg/sample (0.04 ppm or 0.3 mg/m3) for enflurane and 1.87 µg/sample (0.023 ppm or 0.19 mg/m3) for halothane. This is the amount of analyte spiked on a charcoal tube which allows recovery of an amount equal to the detection limit of the analytical procedure. (Section 4.1.2.)
1.2.3. Reliable quantitation limit
The reliable quantitation limit is 3.04 µg/sample (0.04 ppm or 0.3 mg/m3) for enflurane and 1.87 µg/sample (0.023 ppm or 0.19 mg/m3) for halothane. This is the smallest amount of analyte which can be quantitated within the requirements of a recovery of at least 75% and a precision of ±25% or better. (Section 4.2.)
The reliable quantitation limit and detection limits reported in this method are based on optimization of the instrument for the smallest possible amount of analyte. When the target concentration is exceptionally higher than these limits, they may not be attainable at the routine operating parameters.
- 1.2.4. Sensitivity
The sensitivity of the analytical procedure over the concentration range representing 0.5 to 2 times the target concentration is 496 area counts/(µg/mL) for enflurane and 534 area counts/(µg/mL) for halothane. The sensitivity is determined by the slope of the calibration curves. (Section 4.4.) Sensitivity will vary somewhat with the particular instrument used for analysis and method of integration.
1.2.5. Recovery
The recovery of the analyte from the collection medium must be 75% or greater. The average recovery from spiked charcoal tubes over the range of 0.5 to 2 times the target concentration was essentially 100% for both enflurane and halothane. (Section 4.6.)
1.2.6. Precision (analytical method)
The pooled coefficients of variation obtained from replicate determinations of analytical standards at 0.5, 1, and 2 times the target concentration are 0.059 for enflurane and 0.029 for halothane. (Section 4.3.1.)
1.2.7. Precision (overall procedure)
The precision at the 95% confidence level for the 15-day storage test is ±15.6% and ±12.6% for enflurane and halothane, respectively. (Section 4.3.2.) These values include an additional ±5% for sampling error. The overall procedure must provide results at the target concentration that are ±25% or less at the 95% confidence level.
1.3. Advantages
- 1.3.1. The sampling apparatus is portable and easy to use.
1.3.2. No loss of analytes is observed after 2 weeks of storage.
1.3.3. The samples can be reanalyzed several times.
1.3.4. The analytical method is easy and convenient.
1.4. Disadvantages
- 1.4.1. The method has not been field tested.
1.4.2. The solvent used for desorption is toxic and flammable so it must be handled with care.
2. Sampling Procedure
- 2.1. Apparatus
- 2.1.1. A personal sampling pump which can be calibrated within
±5% of the 0.1 L/min flow rate.
2.1.2. Coconut shell charcoal tubes (glass tubes 7-cm length,
2.2. Reagents
None required
2.3. Technique
- 2.3.1. Immediately before sampling, break open the ends of the
charcoal tubes and connect two charcoal tubes in series per sample.
The small, red, plastic SKC cap with the closed end removed is
convenient for this. Position the
2.3.2. Properly label each pair of tubes to distinguish the front and backup tubes.
2.3.3. The tubes are connected to the sampling pump with a piece of flexible tubing. The tube nearest the pump should be labeled as the backup portion of the sample.
2.3.4. The tubes should be placed vertically to avoid channeling through the charcoal.
2.3.5. The exposed, broken end of the first charcoal tube should be enclosed in a tube holder to avoid injury to the worker.
2.3.6. Air being sampled should not pass through any tubing before entering the first charcoal tube.
2.3.7. After sampling, separate the pairs of tubes and seal each tube with plastic caps.
2.3.8. With each set of samples, submit at least one blank tube. The blank should be treated in the same manner as the samples (break ends, seal, transport) except no air is drawn through it.
2.3.9. Transport the samples and paperwork to the lab for analysis.
2.3.10. If bulk samples are to be submitted, they must be sent in a mailing package separate from any air samples being submitted. This is to avoid contamination of the air samples if the bulk should leak or get broken in transit.
2.4. Breakthrough
Studies to determine the 5% breakthrough values were done for enflurane and halothane simultaneously at twice the target concentration using an entire charcoal tube ("A" and "B" portion) with a flow of 0.1 L/min. The average breakthrough air volumes were 18.6 L for enflurane and 16.4 L for halothane. Average capacities of the tubes were 0.255 mg of enflurane and 0.252 mg for halothane. (Section 4.5.)
2.5. Desorption efficiency
The desorption efficiency was determined at several loadings of enflurane and halothane by liquid injection of CS2 solutions of these analytes. The amount of analytes added corresponded to the detection limit of the analytical procedure, 0.5, 1, and 2 times the target concentration. The "A" and "B" portions of each tube were placed in one vial and desorbed with 1 mL of CS2/internal standard solution. The desorption efficiencies for all loadings and both analytes were essentially 100%. (Section 4.6.) Desorption efficiencies may vary from one lot of charcoal to another.
2.6. Recommended air volume and sampling rate
The recommended air volume is 10 L at a flow rate of 0.1 L/min or lower.
2.7. Interferences
- 2.7.1. Charcoal will adsorb many organic vapors so organics
being used in significant quantities near the sampling area should
be listed as possible interferences.
2.7.2. High relative humidity and temperature will decrease the
capacity of the charcoal for halothane and enflurane. If these
conditions are encountered, it may be advisable to decrease the
total volume of air sampled. The recommended
2.8. Safety precautions
- 2.8.1. Wear eye protection when breaking the ends of the
charcoal tubes.
2.8.2. Place the sampling apparatus on the employee so as not to interfere with the work being done.
2.8.3. Adequate precautions should be taken at all times to prevent injury from the broken ends of the charcoal tubes.
3. Analytical Method
- 3.1. Apparatus
- 3.1.1. Gas chromatograph (GC) equipped with a flame ionization
detector.
3.1.2. A GC column is needed which is capable of separating
carbon disulfide, enflurane, halothane, and if used, an internal
standard compound. For this evaluation, a 20 ft stainless steel
column packed with 10% Tergitol
3.1.3. A suitable method for peak area integration.
3.1.4. Small vials with
3.1.5. Microliter syringes;
3.1.6. Pipettes of various sizes for desorption and dilution are needed. A solvent dispenser is convenient for sample desorption.
3.1.7. Volumetric flasks;
3.2. Reagents
- 3.2.1. Carbon disulfide; reagent grade
3.2.2. Halothane; USP grade
3.2.3. Enflurane; USP grade
3.2.4. For this evaluation, benzene was used as an internal standard (1 µL/mL in CS2). Since it may not be feasible to use benzene in other laboratories, several other compounds were tried but found to be unsatisfactory either because of interferences or considerable lengthening of analysis time. The compounds tried were hexane, cyclohexane, methyl cyclohexane, heptane, isooctane, octane, nonane, bromomethane, chloroform, methyl chloroform, Freon 113, trichloroethylene, and tetrachloroethylene. An external standard method may be used instead of an internal standard method.
3.2.5. GC grade nitrogen or helium, hydrogen and air
3.3. Standard preparation
Standards should be prepared at concentrations corresponding to
80.7 µg/mL for halothane and 75.5 µg/mL for enflurane. This is
representative of samples taken at the target concentration assuming a
3.4. Sample preparation
- 3.4.1. Both sections of charcoal in the first tube are placed in
one vial while both sections of the second tube (backup tube) are
placed in a separate vial. One milliliter of desorbing solvent is
added to each vial.
3.4.2. The vials are immediately capped and shaken intermittently
over a
3.5. Analysis
- 3.5.1. Conditions for this evaluation
| GC temperatures | |
| oven: | 70°C |
| injector: | 150°C |
| detector: | 150°C |
| gas flow rates | |
| carrier (He): | 25 mL/min. |
| hydrogen: | 23 mL/min. |
| air: | 250 mL/min. |
| retention times | |
| enflurane: | 12.61 min |
| halothane: | 13.83 min. |
| benzene: | 19.84 min |
| injection size: | 2 µL |
| detector: | flame ionization |
| chromatogram: | Figure 4.8. |
3.5.2. Peak areas are measured by a suitable technique.
3.5.3. A calibration method for our data system was prepared by
setting the peak areas from the analytical standards equal to the
corresponding air concentration in ppm assuming a
Example:
| Halothane standard: | 86 µg/mL |
| Assume |
1-mL desorption volume: 99% desorption efficiency; 24.46 is molar volume of an ideal gas at 25°C and 760 mm Hg; 197.39 MW of Halothane
ppm = (86 µg/mL)(1 mL)(24.46)/(10 L)(197.39)(0.99)
ppm (Halothane) = 1.08
By calibrating the area of the analyte to its corresponding air
concentration, the areas obtained from actual samples can be
expressed in ppm assuming a
3.5.4. Any samples above the target concentration must be confirmed by GC/MS or another suitable method. Retention time on one column is not considered proof of identity.
3.6. Interferences
- 3.6.1. Any compound which has the same retention time as
halothane or enflurane will be an interference.
3.6.2. The solvent, CS2, generally will contain impurities which may be significant at the analytical levels.
3.7. Calculations
- 3.7.1. The values obtained from the calibration method described
in Section 3.5.3. will be in ppm based on a
| Example: | 1 ppm from calibration method |
| 12-L air volume |
| 12 L
10 L |
= 1.2 | 1 ppm
1.2 |
= 0.8 ppm |
Reported result = 0.8 ppm
3.7.2. If there is analyte present in the backup tube then the same air volume correction must be made. This corrected ppm value is added to that value from the front tube and the total is reported. If the corrected ppm value from the backup tube is 25% or more of the corrected value from the front tube, then a note should be placed on the analysis report sheets indicating that the particular sample should be considered saturated.
3.8. Safety precautions
- 3.8.1. Work in a hood when using solvents.
3.8.2. Keep volumetrics and vials containing solvents away from sources of high temperature such as GC injectors and detectors.
3.8.3. Avoid skin contact with all solvents.
3.8.4. Wear safety glasses at all times.
4. Backup Data
- 4.1. Detection limits
- 4.1.1. Analytical procedure
The detection limits were determined by injecting 2 µL of an analytical standard containing 3.04 µg/mL enflurane and 1.87 µg/mL halothane. The chromatographic peaks obtained for the analytes were approximately 5 times the baseline noise. Therefore, the detection limit of the analytical procedure is 6.08 ng/injection for enflurane and 3.74 ng/injection for halothane (Figure 4.1.1.).
4.1.2. Overall procedure
The detection limit of the overall procedure is 3.04 µg/sample (0.040 ppm or 0.30 mg/m3) for enflurane and 1.87 µg/sample (0.023 ppm or 0.10 mg/m3) for halothane. These are the amounts of respective analyte spiked on a charcoal tube which allow recovery of amounts equal to the respective detection limits of the analytical procedure (Table 4.6.1. and 4.6.2., Figure 4.6.1. and 4.6.2.). These limits assume the injection size (2 µL) of the analytical method.
4.2. Reliable quantitation limit
The reliable quantitation limit is 3.04 µg/sample (0.040 ppm or 0.3 mg/m3) for enflurane and 1.87 µg/sample (0.023 ppm or 0.19 mg/m3) for halothane. This is the smallest amount which can be spiked on a charcoal tube, which will give at least 75% recovery and a precision within ±25% at the 95% confidence level. The precision (1.96 SD) of the data listed in Tables 4.6.1 and 4.6.2. for the above concentrations is ±3% for halothane and ±2% for enflurane. This limit was determined assuming the injection size (2 µL) of the analytical method.
4.3. Precision data
- 4.3.1. Analytical method
Precision was determined by replicate injections of analytical standards prepared at concentrations equivalent to 0.5, 1, and 2 times the target concentration. The pooled coefficient of variation is 0.059 for enflurane and 0.029 for halothane.
Analytical Precision for Halothane
|
| |||
| × target conc. | 0.5× | 1× | 2× |
|
| |||
| area counts | 12002 | 24316 | 45953 |
| 11851 | 24070 | 47323 | |
| 11921 | 24047 | 45316 | |
| 11322 | 25971 | 46503 | |
| 12423 | 24196 | 45369 | |
| 12073 | 23356 | 45685 | |
| 11932 | 24326 | 46025 | |
| SD | 359 | 873 | 770 |
| CV | 0.030 | 0.036 | 0.017 |
|
| |||
Analytical Precision of Enflurane
|
| |||
| × target conc. | 0.5× | 1× | 2× |
|
| |||
| area counts | 7318 | 16791 | 33271 |
| 7377 | 19266 | 33832 | |
| 7188 | 15538 | 32004 | |
| 7024 | 15989 | 33310 | |
| 7732 | 15776 | 33256 | |
| 7464 | 15096 | 31904 | |
| 7351 | 16409 | 32929 | |
| SD | 242 | 1508 | 786 |
| CV | 0.033 | 0.092 | 0.030 |
|
| |||
4.3.2. Overall procedure
The precision for the overall procedure includes ±5% for sampling and any storage effects. This precision was found by plotting the storage data from Table 4.7.1., Figures 4.7.1. - 4.7.4. The precision for enflurane is ±16.9% (Figure 4.7.2.) and ±13.5% for halothane (Figure 4.7.4.).
4.4. Sensitivity
The sensitivity is taken as the slope of the calibration curves obtained by plotting data Tables 4.3.1.1. and 4.3.1.2. The sensitivity for enflurane is 496 area counts/(µg/mL) (Figure 4.4.1.) and 534 area counts/(µg/mL) for halothane (Figure 4.4.2.).
4.5. Sampler Capacity
Breakthrough is defined as the point during sampling when the analyte concentration in the air downstream from the charcoal tube is 5% of the concentration ahead of the tube. To determine the breakthrough point, a vapor generation system was used.
The atmosphere in the system was 2 ppm of halothane and enflurane, each, with approximately 80% relative humidity at 21°C. Sampling this atmosphere was performed using a charcoal tube containing both sections of charcoal.
Monitoring the downstream concentration of analytes was done by using a gas sampling valve (GSV) connected to a GC. The sample in the GSV was injected, at specified time intervals, into the GC column in order to separate the two analytes. An FID was used for detection.
Before a charcoal tube was put in line, a
Four separate breakthrough determinations were performed by sampling the above mentioned atmosphere (2 ppm enflurane and halothane, 80% R.H.) at a flow rate of 0.1 L/min through the charcoal tubes. The average breakthrough air volumes are 18.5 L for enflurane and 15.9 L for halothane. The average capacities of the tubes were 0.255 mg of enflurane and 0.252 mg of halothane. The data collected for one test is plotted in Figure 4.5.1. with the (%) of halothane and enflurane in the downstream air vs. the total time of the test.
Sampler Capacity and Air Volume Sampled at 5% Breakthrough
|
| ||||
| test | enflurane | halothane | enflurane | halothane |
| mg | mg | L | L | |
|
| ||||
| 1 | 0.270 | 0.286 | 19.8 | 17.6 |
| 2 | 0.241 | 0.248 | 17.5 | 15.8 |
| 3 | 0.226 | 0.231 | 15.4 | 15.9 |
| 4 | 0.282 | 0.241 | 21.1 | 14.4 |
|
| ||||
4.6. Desorption efficiency
Desorption efficiencies were determined by injecting amounts of enflurane and halothane in solution onto charcoal tubes. The amounts were equivalent to 0.5, 1, and 2 times the target concentration. Also, one set of tubes was prepared at the detection limit of the analytical procedure. The desorption efficiencies for both analytes over the concentration range evaluated was virtually 100% (Tables 4.6.1. and 4.6.2., Figures 4.6.1. and 4.6.2.)
Desorption Efficiencies for Halothane
|
| ||||
| x target conc. | 0.02× | 0.5× | 1× | 2× |
| µg/sample | 1.87 | 42.1 | 84.2 | 168 |
|
| ||||
| desorption | 101 | 100 | 102 | 102 |
| efficiency, % | 101 | 90 | 99 | 101 |
| 100 | 94 | 99 | 104 | |
| 104 | 97 | 102 | 102 | |
| 101 | 95 | 104 | 102 | |
| 104 | 96 | 104 | 102 | |
| 102 | 95 | 102 | 102 | |
|
| ||||
Desorption Efficiencies for Enflurane
|
| ||||
| x target conc. | 0.025× | 0.5× | 1× | 2× |
| µg/sample | 3.04 | 37.9 | 75 | 152 |
|
| ||||
| desorption | 104 | 108 | 110 | 103 |
| efficiency, % | 104 | 100 | 108 | 112 |
| 102 | 104 | 108 | 106 | |
| 103 | 104 | 102 | 108 | |
| 101 | 110 | 110 | 103 | |
| 103 | 110 | 106 | 106 | |
| 103 | 107 | 107 | 106 | |
|
| ||||
4.7. Storage data
Thirty-six samples were collected from a dynamically generated atmosphere of approximately 1 ppm of both halothane and enflurane. Relative humidity in the system was maintained at approximately 80%. Ten liters of this atmosphere were collected at 0.1 L/min.
Six of the samples were desorbed and analyzed the same day as
collected. Of the 30 remaining tubes 15 were stored at ambient
temperatures and 15 were refrigerated at approximately (5°C). Every
third day, 3 samples from the ambient set and 3 from the refrigerated
set were desorbed and analyzed. The results as % recovered are
presented below and plotted in Figures
Storage Tests for Halothane
|
| ||||||
| storage time | % recovery | |||||
| (days) | (refrigerated) | (ambient) | ||||
|
| ||||||
| 0 | 82 | 88 | 84 | 90 | 84 | 90 |
| 3 | 95 | 93 | 101 | 93 | 94 | 97 |
| 6 | 96 | 91 | 99 | 89 | 94 | 100 |
| 10 | 98 | 99 | 102 | 94 | 99 | 100 |
| 12 | 98 | 98 | 99 | 96 | 98 | 95 |
| 15 | 100 | 99 | 98 | 94 | 97 | 99 |
|
| ||||||
Storage Tests for Enflurane
|
| ||||||
| storage time | % recovery | |||||
| (days) | (refrigerated) | (ambient) | ||||
|
| ||||||
| 0 | 105 | 107 | 103 | 105 | 101 | 103 |
| 3 | 91 | 92 | 107 | 96 | 93 | 97 |
| 6 | 99 | 94 | 110 | 94 | 108 | 104 |
| 10 | 106 | 105 | 107 | 100 | 106 | 112 |
| 12 | 98 | 99 | 101 | 97 | 101 | 96 |
| 15 | 110 | 113 | 109 | lost | 96 | 107 |
|
| ||||||
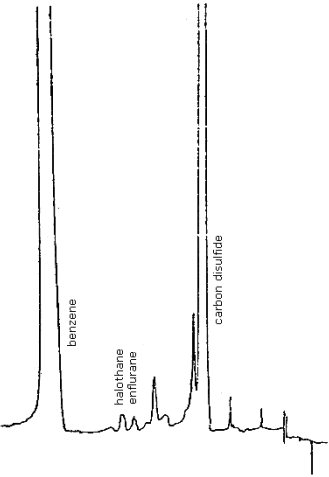
Figure 4.1.1. Detection limits of the analytical procedure.
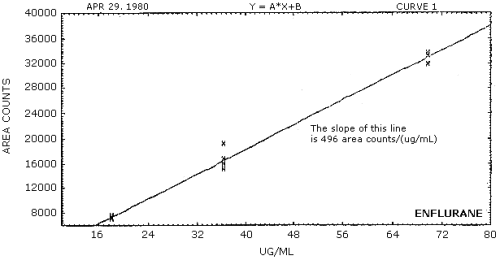
Figure 4.4.1. Calibration curve for enflurane.
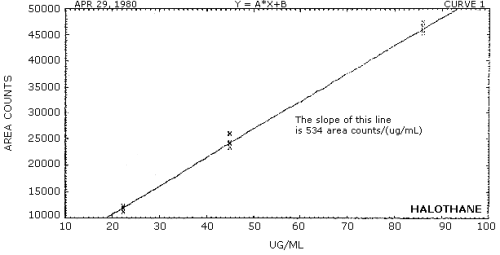
Figure 4.4.2. Calibration curve for halothane.

Figure 4.5.1. Breakthrough curves.
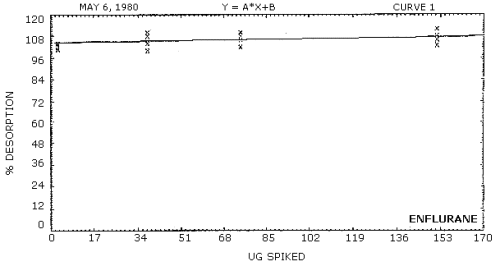
Figure 4.6.1. Desorption efficiency for enflurane.
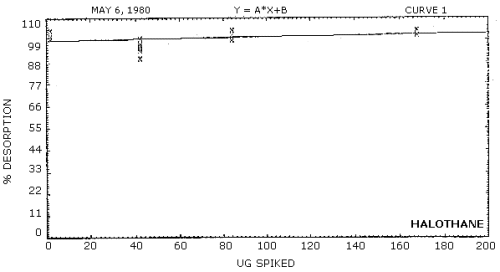
Figure 4.6.2. Desorption efficiency for halothane.

Figure 4.7.1. Ambient storage test for enflurane.
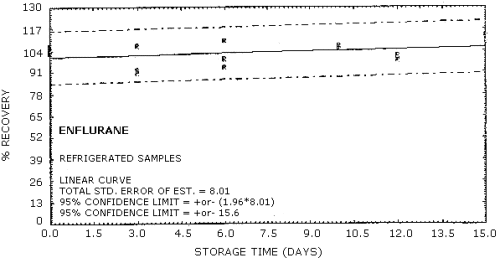
Figure 4.7.2. Refrigerated storage test for enflurane.

Figure 4.7.3. Ambient storage test for halothane.

Figure 4.7.4. Refrigerated storage test for halothane.

Figure 4.8. Chromatogram of halothane and enflurane at their respective target concentrations.
5. References
- 5.1. Nicholson, John A.; Sada, Tsuneo; Aldrete, J. Antonio,
Anesthesia and Analgesia. 1975, 54(4),
5.2. Mazur, J.F.; Podolak, G.E.; Esposito, G.G.; Rinehart, D.S.;
Glenn, R.E. Am. Ind. Hyg. Assoc. J. 1980, 41(5),
5.3.
5.4. "Criteria for a Recommended Standard...Occupational Exposure
to Waste Anesthetic Gases and Vapors". NIOSH. (U.S.) 1977, Publ. No.
5.5. Stevens, Wendell C.; Eger, Edmond I.; White, Anne; Biava,
Claude G.; Gibbons, Robert D.; Shargel, Richard. Canadian
Anesthesiology Society Journal. 1977, 24(4),
5.6. Stecher, Paul G. (Editor) "The Merck Index". 8th edition. Rahway: Merck and Company, Inc.