| Method no.: | 17 |
| Matrix: | Air |
| Target concentration: | 1.2 ppb (5.5 µg/m3) |
| Procedure: | Samples are collected by drawing a known volume of air through two sampling tubes connected in series. The first tube contains Polar Partition and the second tube contains Florisil; both adsorbents are coated with ascorbic acid. Samples are desorbed with 75/25 (v/v) methylene chloride/methanol. Analysis is by gas chromatography using a chemiluminescence detector. |
| Recommended air volume and sampling rate: |
40 L at 0.2 L/min |
| Detection limit of the overall procedure: |
84 parts per trillion (ppt) (0.4 µg/m3) |
| Reliable quantitation limit: | 116 ppt (0.6 µg/m3) |
| Standard error of estimate at the target concentration: (Section 4.6.) |
6.0% |
| Special requirements: | The treated adsorbent tubes must be protected from light during and after sampling. The samples should be stored in a freezer. |
| Status of method: | A sampling and analytical method which has been subjected to the established evaluation procedures of the Organic Methods Evaluation Branch. |
| Date: January 1980 | Chemist: Warren Hendricks |
OSHA Analytical Laboratory
Salt Lake City, Utah
1. General Discussion
- 1.1. Background
- 1.1.1. History of analysis
Sample collection:
Analytical: Analytical procedures for NMOR are similar to those used for dimethylnitrosamine (DMN) and diethylnitrosamine (DENA). The separation is usually by gas chromatography and detection is by one or more of the following: mass spectrometry, Coulson Electrolytic Conductivity Detector, Hall Electrolytic Conductivity Detector, nitrogen selective alkali flame ionization detector and Thermal Energy Analyzer (TEA). (Refs. 5.3. and 5.4.) Liquid chromatographic procedures that utilize both ultraviolet and TEA detection systems have been reported. (Ref. 5.1.)
1.1.2. Discussion concerning the sampling and analytical method
This method recommends the use of two treated adsorbent tubes in series as an air sampling device for NMOR. The analytical separations are performed by gas chromatography and detection is accomplished using the TEA. The TEA detector was selected because it is both sensitive and selective for nitrosamines.
An important requirement of any air sampling technique for nitrosamines is that the artifactual formation of the analyte on the sampling device from its precursors must be prevented. The sampler recommended for DENA (Florisil coated with Vitamin E) was found to be inadequate for the collection of NMOR because of artifact problems. Artifact formation experiments showed that Vitamin E did not prevent nitrosation from occurring in the presence of nitrogen oxides and the NMOR precursor amine morpholine. Not only did Florisil effectively collect (and thus concentrate) morpholine, Florisil coated with Vitamin E was an even more effective collector of morpholine than Florisil alone. Therefore, morpholine was available to react with nitrogen oxides to form NMOR. This reaction occurred before the nitrogen oxides could be removed by the Vitamin E. These artifact formation experiments involved drawing air containing nitrogen oxides through the sampler after it had received a loading of morpholine.
Further experiments showed that Vitamin C coated Polar Partition (OV-275 on Chromosorb A) when placed ahead of Vitamin C coated Florisil prevented the artifactual formation of NMOR. When a coated Polar Partition tube was placed in series ahead of a coated Florisil tube, NMOR passed through the first tube and was collected on the second tube. Morpholine was not effectively collected on the first tube, and experiments showed that the artifactual formation of NMOR on the first tube did not occur. Also, experiments with the two tubes in series showed that even if morpholine did reach the second tube, artifactual formation of NMOR did not occur there since the nitrosating agent was removed by the first tube. Therefore, the sampler which was evaluated for this method consisted of two adsorbent tubes connected in series. The first contained Polar Partition and the second contained Florisil. The contents of each tube were coated with 10 mg of Vitamin C.
The recommended NMOR air sampler is probably not suitable to sample DMN or DENA vapors because the device does not have the quantity of Florisil adsorbent that is necessary to collect and retain the more volatile nitrosamines. An air sampler with sufficient capacity for all three analytes could be assembled, however, it is unlikely that this device would be a universal air sampler for all nitrosamines because each analyte has unique properties that must be considered. It may be possible, when we have evaluated several samplers and nitrosamines, to develop a more general sampling device.
1.1.3. Toxic effects (This section is for information only and should not be taken as the basis for OSHA policy)
Acute: The LD50 for NMOR, administered by intraperitoneal injection to the rat, was 282 mg/kg. (Ref. 5.6.) The LD50, following administration of NMOR with an esophageal probe to rats, was 320 mg/kg. (Ref. 5.7.) The agent was much more toxic when administered by intravenous injection - the LD50 was 98 mg/kg for rats (Ref. 5.7.). The most important result of acute exposure to NMOR is extreme destruction of centrilobulor liver tissue. (Ref. 5.8.) The acute toxic effects normally develop within one or two days and a lethal dose usually kills the animal within a week. (Ref. 5.8.)
Chronic: NMOR has been reported to be carcinogenic to the European hamster (Ref. 5.9.), the mouse (Ref. 5.10.), the Syrian golden hamster (Ref. 5.11.), aquarium fish (Ref. 5.12.), to the guinea pig (Ref. 5.13.), and to the rat (Ref. 5.14.). The agent induced tumors in the lungs, liver, nasal cavity, trachea, and upper digestive tract following different modes of administration which included subcutaneous injection, oral ingestion, inhalation, skin painting, and intravenous injection. In all cases, animal survival decreased with increasing NMOR dosage and tumor yields of up to 100% were obtained.
NMOR was reported to be the most rapidly acting liver carcinogen of the 65 different nitrosamines administered to rats by Druckey, et al. When 16 rats were given 8 µg/kg (1/40 of the LD50) NMOR daily in the drinking water, 14 animals died exclusively of liver cancer after an average tumor induction period (t50) of 165 days. The average total dose which was applied up to the appearance of cancers in 50% of the animals (D50) was 1.3 g/kg. In contrast to the oral administration, when 5 rats were given 10 mg/kg (1/10 of the LD50) once per week by intravenous injection, 2 animals died of cancer of the nasal region and 1 of liver cancer. The D50 was 0.5 g/kg and the t50 was 440 days. Perhaps the reason for the apparent weaker carcinogenic effect following intravenous administration was that much lower doses were given in consideration of the higher toxicity (lower LD50) of intravenous as compared to oral administration. (Ref. 5.7.)
Data regarding the toxicity of NMOR to humans are unavailable, however, the wide range of species that are subject to carcinogenesis by the agent indicates that humans may also be susceptible. While there is no direct evidence that exposure to nitrosamines leads to cancer in humans, indirect evidence obtained from studies that measured the relative metabolic rates of DMN by rat and human liver slices, indicate that man is probably about as sensitive to the carcinogenic action of DMN (and perhaps other nitrosamines) as is the rat. (Ref. 5.15.)
1.1.4. Operations where exposure occurs
NMOR is extensively used in cancer research facilities. Human exposure can occur when unchanged NMOR is excreted by the laboratory animals.
Many amines have been shown to be contaminated with the
corresponding
It has been shown that secondary and tertiary amines can react with oxides of nitrogen in the vapor phase to produce the corresponding nitrosamines. (Ref. 5.17.) Studies conducted in our laboratory confirm that morpholine is very easily nitrosated by nitrogen oxides and that ambient winter Salt Lake City air is sufficient to nitrosate the amine.
Potential exposure to NMOR exists whenever morpholine vapors are present because of the ease with which the agent can be nitrosated. Further, any tertiary amine which contains the morpholine moiety can be nitrosated to give NMOR. Industrial uses for morpholine include: as a rubber accelerator; a solvent; a reactant for organic synthesis; an additive to boiler water; in waxes and polishes; an optical brightener for detergents; a corrosion inhibitor and for preservation of book paper. (Ref. 5.18.)
The fairly common practice of the addition of steam to ambient winter air in order to increase the relative humidity of the air for its subsequent use in heated areas is an example of potential exposure to NMOR. Morpholine is a corrosion inhibitor that is often added to boiler water and steam generated from such boiler water contains morpholine which can be nitrosated by the nitrogen oxides found in ambient air. (Ref. 5.19.)
NMOR has been reported to be present in the tire and rubber industry. The agent was found as an air pollutant in a tire chemical plant and an aircraft tire factory. NMOR, found in the chemical plant, was present in waste water (0.003 µg/g), a dirt scraping from a stairway (730 µg/g), a soil sample taken outside the plant (4.4 µg/g). Air samples taken in the chemical plant varied from 0.07 µg/m3 in the lunchroom to 5.1 µg/m3 near a diphenylnitrosamine reactor. The agent was found to be present in every site sampled at the tire factory. The lowest air concentration was 0.6 µg/m3 in the finishing and inspection area and the highest, 27 µg/m3 adjacent to a tire tread extruder. The source of the compound is unknown, however, morpholine levels of 230 and 42 µg/m3 were found at the tire factory and chemical plant, respectively. (Ref. 5.1.)
NMOR has been determined to be present in morpholine-nitrite salts used as vapor-phase corrosion inhibitors (Ref. 5.20.) and in certain hydraulic fluids. (Ref. 5.21.)
A non-occupational source of exposure to NMOR is the endogenous formation of the agent in the gastrointestinal tract. Morpholine has been shown to react with nitrite to form NMOR in the stomachs of Syrian hamsters. (Ref. 5.22.) The amine has been reported to react with human saliva to form NMOR. (Ref. 5.23.) Morpholine is used as a food additive, it is permitted in food intended for human consumption. (Ref. 5.24) Sources of dietary nitrite include the reduction of nitrate by microorganisms and nitrite cured food products. (Ref. 5.23.)
1.1.5. Number of workers that are exposed - unknown
1.1.6. Physical properties (Refs. 5.6. and 5.7.)
| synonyms: | Morpholine, N-nitroso; 4-nitrosomorpholine; n-nitrosomorpholin (German) | ||
| CAS no.: | 59-89-2 | ||
| molecular formula: | C4H8N2O2 (MOR-NO) | ||
| molecular structure: | Figure 1.1.6. | ||
| molecular weight: | 116.14 | ||
| boiling point: | 96°C (6 mm Hg) | ||
| melting point: | 29°C | ||
| absorp. spec.: |
| ||
| (in water) |
| ||
| solubility in water: | unlimited | ||
| distribution coefficient (concentration in hexane to concentration in pH 7.4 phosphate buffer): | 0.039 |
1.2. Limit defining parameters
- 1.2.1. Detection limit of the analytical procedure
The detection limit of the analytical procedure is 80 pg (0.016 µg/mL × 5 µL injection volume) per injection. This is the amount of analyte which will give a peak whose height is about five times the amplitude of the baseline noise. (Section 4.1.)
1.2.2. Detection limit of the overall procedure
The detection limit of the overall procedure is 0.016 µg/ sample (84 ppt or 0.4 µg/m3). This is the amount of NMOR spiked on the treated adsorbent tubes which allows recovery of an amount of the analyte equivalent to the detection limit of the analytical procedure. (Section 4.2.)
1.2.3. Reliable quantitation limit
The reliable quantitation limit for the analytical method was 0.022 µg/sample (116 ppt or 0.6 µg/m3). This is the smallest amount of analyte which can be quantified within the requirements of 75% recovery and 95% confidence limits of ±25%. The reliable quantitation limit was determined by spiking the sampling device with the analyte. The average recovery from treated Florisil tubes was 96.8% and the 95% confidence interval limits were ±17.2%. The average recovery from treated Polar Partition tubes was 98.7% and the 95% confidence interval was ±18.5%. (Section 4.3.)
The reliable quantitation limit and detection limits reported in the method are based upon optimization of the instrument for the smallest possible amount of analyte. When the target concentration of an analyte is exceptionally higher than these limits, they may not be attainable at the routine operating parameters.
- 1.2.4. Sensitivity
The sensitivity of the analytical procedure over a concentration range representing 0.5 to 2 times the target concentration based on the recommended air volume is 44085 area units (HP-5840A) µg/mL. The sensitivity is determined by the slope of the calibration curve. (Figure 4.4.1.) The sensitivity will vary somewhat with the particular instrument used in the analysis. A representative chromatogram is shown in Figure 4.4.2.
1.2.5. Recovery
The average recovery over the range of 0.5 to 2 times the target concentration was 96.3% for treated Florisil tubes and 96.7% for treated Polar Partition tubes. (Section 4.5.) The recovery remained above 81% during the 19-day ambient temperature storage period. (Section 4.6.) The recovery of analyte from the collection medium must be 75% or greater.
1.2.6. Precision of the analytical method
The pooled coefficient of variation obtained from replicate determinations of analytical standards at 0.5, 1, and 2 times the target concentration was 0.028. (Section 4.7.)
1.2.7. Precision of the overall procedure
The overall procedure must provide results at the target concentration that are ±25% or better at the 95% confidence level. The 95% confidence limits for the 19 day ambient temperature storage test are ±12.6%. (Section 4.6.). This includes an additional ±5% for sampling error.
1.2.8. Reproducibility
The analytical method was shown to be reproducible by the analysis of liquid-spiked samples by a second chemist who was not associated with this evaluation. The average recovery from treated Polar Partition tubes spiked with 0.22 µg of NMOR was 97.9%. The average recovery from treated Florisil tubes spiked with 0.11 µg of NMOR was 100.3%. (Section 4.8.)
1.3. Advantages
- 1.3.1. The sampling procedure is convenient.
1.3.2. The significance of artifactual formation of NMOR upon the sampling device has been eliminated through pretreatment of the air sampler.
1.3.3. The analytical procedure is quick, sensitive, and reproducible.
1.3.4. Reanalysis of the samples is possible.
1.3.5. It may be possible to determine other nitrosamines simultaneously.
1.3.6. The effects of potential interferences are reduced through the use of a selective detector (the TEA) and can be further reduced by proper selection of GC parameters.
1.3.7. The air sampler is composed of commercially available materials.
1.4. Disadvantages
- 1.4.1. At this time the sampling method has not been field
tested.
1.4.2. The cost of the TEA may be prohibitive to small laboratories.
2. Sampling Procedure
- 2.1. Apparatus
- 2.1.1. An approved and calibrated personal sampling pump whose
flow can be determined to ±5% at the recommended flow rate.
2.1.2. Florisil and Polar Partition adsorbent tubes: Glass tubes,
6-mm o.d., 4-mm i.d.,
2.2. Reagents
None required.
2.3. Sampling technique
- 2.3.1. The air sampler is composed of a treated Polar Partition
tube followed by a treated Florisil tube in series. The tubes are
easily connected with an end cap that has been modified by cutting
off the closed portion.
2.3.2. Connect the air sampler to the sampling pump with flexible tubing. The 50-mg section of each tube should be positioned toward the sampling pump. Cover each tube of the air sampler with masking tape or other suitable material to prevent light from reaching the adsorbent.
2.3.3. The air sampler should be placed in a vertical position during sampling to minimize channeling.
2.3.4. Sampled air should not pass through any hose or tubing before entering the sampling device.
2.3.5. Immediately after sampling, separate the air sampler into its component tubes, identify each tube as front or backup and seal each tube with plastic end caps. Also, wrap each sample end to end with official OSHA seals.
2.3.6. With each batch of samples, submit at least one blank tube of each adsorbent material from the same lot used for samples. These tubes should be subjected to exactly the same handling as the samples (seal, transport) except that no air is drawn through them.
2.3.7. Transport the samples (and corresponding paperwork) to the lab for analysis.
2.3.8. If bulk samples are submitted for analysis, they should be transported in glass containers with Teflon-lined caps. The samples must be kept from light. These samples must not be put in the same container used for the treated adsorbent tubes.
2.4. Sampler capacity
Breakthrough, from the Polar Partition tube to the front section of the Florisil tube, was 75% after about 40 L of air containing target level concentrations of NMOR at 80% relative humidity and 29°C were sampled at 0.2 L/min.
Breakthrough from the front to the rear section of the Florisil tube was 5% after about 85 L of air containing twice the target level of NMOR at 80% relative humidity and 21°C were sampled at 0.2 L/min.
The breakthrough volume remained constant when the flow rate was increased from 0.2 to 0.5 L /min. The pressure drop across the air sampler was less than 1 in. of mercury at 0.5 L/min. If larger air volumes or shorter sampling times are desired, the flow rate can be increased to 0.5 L/min. The air volume should be no greater than 85 L. The possibility of interferences will increase as the air volume sampled is increased.
2.5. Desorption efficiency
- 2.5.1. The average desorption from
2.5.2. The average desorption from
2.5.3. The spiked tubes represent an air concentration range of 2.8 to 11.3 µg/m3 (0.6 to 2.4 ppb) based on the recommended air volume.
2.5.4. The desorption efficiency for NMOR may vary somewhat from
one laboratory to another and also from one lot of
2.6. Recommended air volume and sampling rate
- 2.6.1. The recommended air volume is 40 L.
2.6.2. The recommended sampling rate is 0.2 L/min.
2.7. Interferences
- 2.7.1. Since it is possible that the precursors of NMOR, which
are morpholine, and various nitrosating agents (oxides of nitrogen,
nitrites, etc.), are present in the environment, it is conceivable
that NMOR may be formed upon the sampling device and not be present
in the sampled air. Laboratory experiments indicate that it is
possible to form NMOR from its precursors on an untreated air
sampler. Further experiments show that when the tubes are treated
with 10 mg of
2.7.2. At the present time, it is unknown if any compound would severely interfere with the collection or retention of NMOR on treated Polar Partition and Florisil tubes. In general, the presence of other compounds will reduce the breakthrough volume for a particular compound.
2.7.3. Any compound which is suspected of interfering with the collection or analysis should be listed on the sampling data sheet.
2.7.4. Light will decompose NMOR (Ref. 5.7.). The air sampler must be protected from light during and after sampling.
2.8. Safety precautions
- 2.8.1. Observe due care when working with the sharp ends of the
air sampler.
2.8.2. Attach the sampling equipment to the worker in such a manner that it will not interfere with work performance.
2.8.3. Follow all safety practices that apply to the work area being sampled.
3. Analytical Procedure
- 3.1. Apparatus
- 3.1.1. A gas chromatograph interfaced to a Thermal Energy
Analyzer.
3.1.2. A GC column capable of resolving NMOR from the desorption solvent and potential interferences. The column used in this work was a 10-ft × 1/8-in. stainless steel column containing 10% Carbowax 20M with TPA on 80/100 mesh Chromosorb W AW.
3.1.3. An electronic integrator or other suitable method to measure peak area.
3.1.4. An analytical balance capable of accurately weighing to 5 decimal places.
3.1.5. Vials, 2-mL vials with Teflon-lined caps.
3.1.6. Microliter syringes, 5-µL syringe for sample injections and other convenient sizes.
3.1.7. Pipets, convenient sizes for diluting standards. A 1-mL dispenser pipet for the desorbing solvent.
3.1.8. Volumetric flasks, convenient sizes for diluting standards.
3.1.9. Dewar flasks, convenient sizes for liquid nitrogen.
3.1.10. Heating tape, high temperature, heavily insulated.
3.1.11. Variable voltage transformer.
3.2. Reagents
- 3.2.1. NMOR, authentic primary standard, 98% minimum.
3.2.2. Methyl alcohol, chromatographic grade.
3.2.3. Methylene chloride, chromatographic grade.
3.2.4. Isopropyl alcohol, chromatographic grade.
3.2.5. Ethyl alcohol, U.S.P., 95%.
3.2.6. Gases, purified GC grade helium and medical grade oxygen.
3.2.7. Nitrogen, liquid.
3.3. Sample preparation
- 3.3.1. The status of the OSHA seal on each sample is noted and
recorded as intact, broken, or none.
3.3.2. The field and laboratory identification numbers on each sample are checked against those on the sample identification sheets.
3.3.3. Suitable precautions must be undertaken to prevent the exposure of the samples to light. NMOR will photodecompose easily.
3.3.4. The contents of the treated Polar Partition (front) tube
(solid sorbent, glass wool and urethane plugs) are added to a 2-mL
vial. The front glass wool plug and the
3.3.5. Analysis of the third vial will indicate if breakthrough has occurred. If 20% or more of the total NMOR found on the air sampler is present in the third vial, then breakthrough has occurred and an appropriate comment is made on the analysis sheet.
3.3.6. Each vial is desorbed with 1.0 mL of desorbing solution. The desorbing solution is composed of 75 parts methylene chloride and 25 parts methyl alcohol by volume.
3.3.7. The vials are sealed immediately with Teflon-lined caps and allowed to desorb for 30 min with intermittent shaking.
3.4. Standard preparation
- 3.4.1. Stock standards are prepared by diluting a weighed amount
of NMOR with isopropyl alcohol. The stock standard is diluted to the
working range with isopropyl alcohol (See Section 3.8. Safety
Precautions).
3.4.2. A solution composed of 0.22 µg/mL NMOR in isopropyl alcohol equals an air concentration of 5.5 µg/m3 for a 40-L air sample desorbed with 1.0 mL of desorbing solution. This amount is not corrected for desorption efficiency.
3.4.3. Standards are stored in dark bottles under refrigeration.
3.5. Analysis
- 3.5.1. GC conditions
| helium (carrier gas) flow rate: | 30 mL/min |
| injector temperature: | 205°C |
| column temperature: | 205°C |
| TEA transfer line temperature: | 210°C |
| elution time: | 2.5 min |
3.5.2. TEA conditions
| oxygen pressure: | 9 psi |
| GC pyrolyzer furnace temperature: | 475°C |
| coarse zero: | high |
| calibrate: | 0.0 |
| attenuator: | 4 |
| cold trap temperature: | -130°C (ethyl alcohol and liquid nitrogen) |
Complete instructions for the TEA are found in its manual.
3.5.3. The transfer line between the GC and TEA must be maintained at about 210°C with a heating tape. The temperature is controlled with a variable voltage transformer.
3.5.4. Chromatogram (Section 4.4.)
3.5.5. Peak areas are measured by an electronic integrator or other suitable means.
3.5.6. An external standard procedure is used to prepare a calibration curve from the analysis of at least three different standard solutions. The calibration curve is prepared daily. The integrator is calibrated to report results in micrograms per milliliter.
3.5.7. Bracket the samples with analytical standards.
3.6. Interferences
- 3.6.1. The TEA is a highly selective detector for
The nitrosyl radicals in the carrier gas are then reacted with ozone, under vacuum, to form electronically excited nitrogen dioxide (NO2*). The excited nitrogen dioxide quickly decays to its ground state emitting light at a characteristic wavelength, which is measured by a photomultiplier tube.
Any compound which will form the nitrosyl radical will elicit a response from the TEA. In addition to N-nitroso compounds, the TEA will respond to organic and inorganic nitrites, some nitrates, certain C-nitroso compounds and certain C-nitro compounds.
Any compound that has the same GC column retention time as NMOR and has a TEA response is an interference.
3.6.2. GC parameters may be changed to circumvent most interferences.
3.6.3. Retention time on a single GC column is not proof of chemical identity. Samples should be confirmed by GC/MS or other suitable means when required.
3.7. Calculations
- 3.7.1. The integrator value in µg/mL is used for reference only.
More reliable results are obtained by use of the calibration curve.
The peak area, for each standard, is compared to its concentration
in µg/mL and the equation for the best straight line through the
data points is determined by linear regression.
3.7.2. The concentration in µg/mL for a sample is determined by comparing the area of a particular sample to the calibration curve.
3.7.3. The result obtained from the analysis of each vial is corrected by the appropriate desorption efficiency and then the corrected results from the two tubes that compose a particular air sample are added together.
3.7.4. The air concentration for a sample result is calculated by the following equation:
- NMOR, µg/m3 = (1000)(A)(B)/C
| where | A | = | µg/mL from Section 3.7.3. |
| B | = | desorption volume | |
| C | = | air volume in liters |
3.7.5. To convert the results from Section 3.7.4. in µg/m3 to parts per billion the following relationship is used:
- NMOR, ppb = (µg/m3)(24.46)/116.1
| where | µg/m3 | = | result from Section 3.7.4. |
| 24.46 | = | molar volume at 25°C and 760 mm Hg | |
| 116.1 | = | molecular weight of NMOR |
3.8. Safety precautions
- 3.8.1. NMOR is an extremely potent animal carcinogen and utmost
care must be exercised when working with this compound.
3.8.2. Avoid skin contact with liquid nitrogen and the solvents.
3.8.3. Confine the use of solvents to a fume hood.
3.8.4. Wear safety glasses in all laboratory areas.
3.8.5. Be certain that the TEA exhaust is connected to a fume hood.
4. Backup Data
- 4.1. Detection limit of the analytical procedure
Figures 4.1.1., 4.1.2., and 4.1.3. were used to determine the detection limit of the analytical procedure.
4.2. Detection limit of the overall procedure
The data in Table 4.2. are graphically represented in Figures 4.2.1. and 4.2.2. in order to determine the detection limit of the overall procedure.
Detection Limit Data
|
| ||
| µg NMOR spiked on treated adsorbent tubes | avg. µg NMOR recovered from treated Florisil tubes | avg. µg NMOR recovered from treated Polar Partition tubes |
|
| ||
| 0.110 0.0450 0.0220 0.0160 |
0.104 0.0446 0.0213 0.0159 |
0.108 0.0437 0.0217 0.0170 |
|
| ||
4.3. Reliable quantitation limit
Treated adsorbent tubes were each spiked with 0.022 µg of NMOR and the recoveries were as follows:
Reliable Quantitation Limit Data
|
| ||
trial |
% recovery from treated Florisil tubes | % recovery from treated Polar Partition tubes |
|
| ||
| 1 2 3 4 5 SD 1.96(SD) |
102.3 102.3 88.6 98.9 92.1 96.8 6.2 12.2 |
100.0 96.2 106.7 88.9 101.8 98.7 6.7 13.1 |
|
| ||
4.4. Sensitivity
A typical calibration curve is shown in Figure 4.4.1. The slope of the curve indicates the sensitivity of the method.
A representative chromatogram is shown in Figure 4.4.2.
4.5. Desorption efficiency
The following data represent the recovery of NMOR spiked on treated Polar Partition and on treated Florisil adsorption tubes. The desorption study for the Florisil tubes was conducted with the reference (B) portion removed.
Desorption Efficiencies from Two Adsorbents
|
| |||||||
| Polar Partition | Florisil | ||||||
| × target conc. ng/sample |
0.5× 112 |
1× 224 |
2× 448 |
0.5× 112 |
1× 224 |
2× 448 | |
|
| |||||||
| desorption efficiency, % |
96.6 98.3 96.5 101.0 99.0 99.2 98.4 |
91.8 100.0 93.9 98.0 98.0 95.2 96.2 |
99.1 93.3 100.0 88.7 96.4 96.2 95.6 |
91.2 100.4 91.7 93.9 93.7 98.5 94.9 |
97.2 100.5 95.5 99.9 94.5 99.2 97.8 |
95.6 101.1 98.8 87.7 93.5 99.7 96.1 | |
| Polar Partition = 96.7 | Florisil = 96.3 | ||||||
|
| |||||||
4.6. Storage
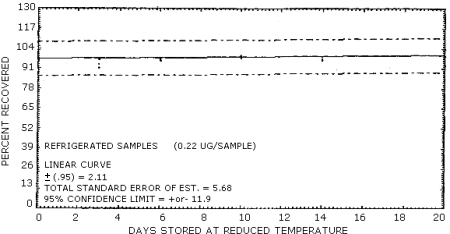
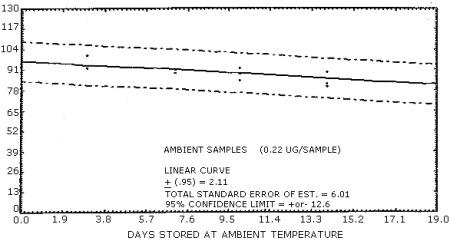
Samples were generated by the liquid injection of NMOR on untreated polar partition tubes containing only 50 mg of adsorbent. The tubes were allowed to equilibrate overnight and then were placed in front of the treated air sampler. Forty liters of air at 80% relative humidity and 20°C were drawn through the sampling train. The NMOR on the Polar Partition tube was desorbed by the humid air and was deposited on the air sampler. Studies conducted at ambient relative humidity and temperature indicated that desorption was essentially complete after 25 L of air had passed through the Polar Partition tube (Figure 4.6.1.). In these studies, the spiked polar partition tube was connected directly to the TEA. The data in Table 4.6. represent the effects of storage at ambient (21-26°C) and reduced (-20°C) temperatures on NMOR collected using treated adsorption tubes. The recoveries are not corrected for desorption efficiency. A graphical representation of the data may be found in Figures 4.6.2. and 4.6.3.
Storage Tests
|
| |||||||
| storage time | % recovery | ||||||
| (days) | (refrigerated) | (ambient) | |||||
|
| |||||||
| 0 3 6 7 10 14 19 20 |
97.3 92.5 97.7 100.5 98.0 94.1 |
98.0 97.5 97.3 99.8 97.7 104.5 |
101.4 95.0 98.6 98.9 100.0 100.4 |
97.3 101.4 92.0 85.4 90.7 80.2 |
91.8 93.6 92.3 93.0 81.8 82.5 |
99.1 93.6 90.0 89.5 83.4 81.4 | |
|
| |||||||
4.7. Precision of the analytical method
These data represent multiple injections of standard solutions. The injection volume was 5 µL and the concentrations of the standards were 0.11, 0.22, and 0.45 µg/mL. Peaks were integrated by a Hewlett-Packard 5840A Gas Chromatograph.
Precision of the Analytical Method
|
| |||
| × target conc. pg/injection |
0.5× 550 |
1× 1100 |
2× 2250 |
|
| |||
| area
counts SD CV |
5117 5017 5017 4842 5072 4918 4742 4788 5371 4987.11 193.26 0.0388 |
9900 10210 10170 10070 10070 9680 9582 9582 9494 9853.78 290.60 0.0295 |
19830 20530 20490 19490 19210 20280 19530 20008 20450 19979.78 491.46 0.0245 |
|
| |||
4.8. Reproducibility
Three treated Polar Partition and three treated Florisil tubes were spiked (liquid injection) with 0.22 and 0.11 µg NMOR. These samples were analyzed by a chemist unassociated with the development of this procedure. The results are shown below.
Reproducibility
|
| ||
µg/sample |
Polar Partition 0.22 |
Florisil 0.11 |
|
| ||
| % NMOR recovered |
96.4 105.5 91.8 97.9 |
95.0 112.5 93.3 100.3 |
|
| ||
4.9. Sampling tube preparation
- 4.9.1. Reagents
Methyl alcohol, chromatographic grade.
L-(+)-Ascorbic acid (Vitamin C), USP Grade, 98% min. Prepare a solution containing 40 mg/mL in methyl alcohol. Store under refrigeration in a dark bottle.
4.9.2. Technique
Each adsorbent tube is treated with 10 mg of

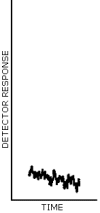

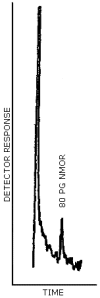
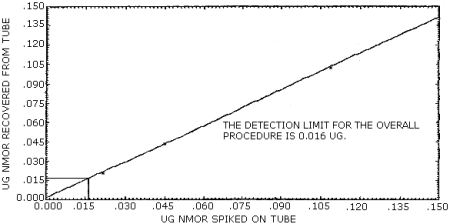
Figure 4.2.1. Detection limit of the overall procedure for
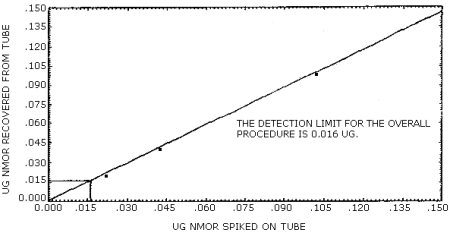
Figure 4.2.2. Detection limit of the overall procedure for
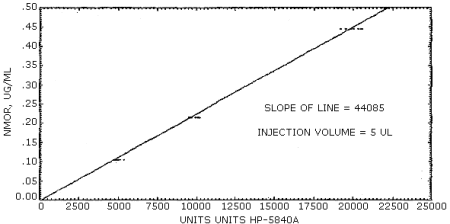
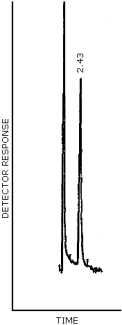
Figure 4.4.2. A representative
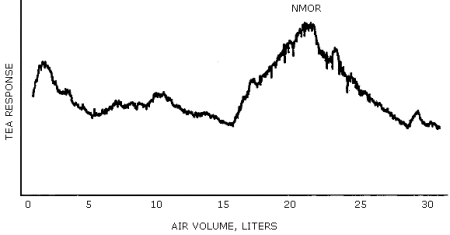
Figure 4.6.1. The rate at which
5. References
- 5.1. J.M. Fajen, G.A. Carson, D.P. Roundbehler, T.Y. Fan, R. Vita,
V.E. Goff, M.H. Wolf, G.S. Edwards, D.H. Fine, V. Reinhold, and K.
Biemann,
5.2. J.M. Fajen, G.A. Carson, S. Fan, D.P. Roundbehler, J. Morrison, I. Krull, G. Edwards, A. Lafleur, W. Herbst, V. Godd, R. Vita, K. Mills, D.H. Fine and V. Reinhold, N-Nitroso Compounds as Air Pollutants, presented to the Air Pollution Control Association, Annual Meeting, Houston, June 26, 1978.
5.3. W. Hendricks, Dimethylnitrosamine (Method 06, Organic Methods Evaluation Branch, OSHA Analytical Laboratory, Salt Lake City, Utah), Unpublished, (1979).
5.4. W. Hendricks, Diethylnitrosamine, (Method 13, Organic Methods Evaluation Branch, OSHA Analytical Laboratory, Salt Lake City, Utah), Unpublished, (1979).
5.5. M.C. Archer, S.R. Tannenbaum, T.Y. Fan, and M. Weisman, Reaction of Nitrite with Ascorbate and its Relations to Nitrosamine Formation, J. Nat. Cancer Inst., 54(5), 1203-1205 (1975).
5.6. Registry of Toxic Effects of Chemical Substances, 1976 edition. (H.E. Christensen, E.J. Fairchild, Eds., B.S. Carroll, R.J. Lewis, Project Coordinators) U.S. Department of Health, Education and Welfare, Public Health Service, Center for Disease Control, National Institute for Occupational Safety and Health, U.S. Institute for Occupational Safety and Health, U.S. Government Printing Office, Washington, D.C. (1976).
5.7. H. Druckey, R. Preussmann, S. Ivankovic and D. Schmahl, Organotrope Carcinogene Wirkungen bei 65 Verschiedenen N-Nitroso-verbindungen an Bd-Ratten, Z. Krebsforsch, 69(103), 103-201 (1967).
5.8. D.F. Heath and P.N. Magee, Toxic Properties of Dialkylnitrosamines and Some Related Compounds, Brit. J. Industr. Med., 19, 276-282 (1962).
5.9. U. Mohr, G. Reznikand, H. Reznik-Schuller, Carcinogenic
Effects of
5.10. S.S. Mervish, A. Cardesa, L. Wallcave, and P. Shubik, Induction of Mouse Lung Adenomas by Amines or Ureas Plus Nitrite and by N-Nitroso Compounds: Effect of Gallic Acid, Thiocyanate and Caffeine, J. Natl. Cancer Inst., 55(3), 633-636 (1975).
5.11. H. Haas, U. Mohr and F.W. Kruger, Comparative Studies With
Different Doses of
5.12. G.B. Pliss and V.V. Khudoley, Tumor Induction by Carcinogenic Agents in Aquarium Fish, J. Natl. Cancer Institute, 55(1), 129-132 (1975).
5.13. F.J. Akin and A.E. Wasserman, Effect on Guinea Pigs of
Feeding
5.14. S.S. Mirvish, A.F. Pelfrene, H. Garcia and P. Shubik, Effect of Sodium Ascorbate on Tumor Induction in Rats Treated With Morpholine and Sodium Nitrite, and With Nitrosomorpholine, Cancer Letters, 2, 101-108 (1976).
5.15. P.N. Magee, Toxicity of Nitrosoamines: Their Possible Human Health Hazards, Fd. Cosmet. Toxicol., Great Britain, 9, 207-218 (1971).
5.16. B. Spiegelhalder, G. Eisenbrand and R. Preussman,
Contamination of Amines With
5.17. J.N. Pitts, P. Grosjean, K.V. Cauwenberghe, J.P. Schmid, and D.R. Fitz, Photooxidation of Aliphatic Amines Under Simulated Atmospheric Conditions: Formation of Nitrosamines, Nitramines, Amides and Photochemical Oxidant, Environmental Science and Technology, 12(8) 946-953 (1978).
5.18. G.G. Hawley (9th ed.), "The Condensed Chemical Dictionary", Van Nostrand Reinhold Company: New York, 591 (1977).
5.19. Personal Communication between W. Hendricks and D.P. Roundbehler (January, 1980).
5.20. M.C. Archer and J.S. Wishnok, Nitrosamine Formation in Corrosion Inhibiting Compositions Containing Nitrite Salts of Secondary Amines, J. Environ. Sci. Health All(10 & 11), 583-590 (1976).
5.21. J.J. Behen, Determination of
5.22. N. Invi, Y. Nishi, M. Taketomi, and T. Yamada, A Short Term Simple Method for Detection of N-Nitroso Compounds Produced From Sodium Nitrite and Morpholine in Stomach, Biochemical and Biophysical Research Communication 81(2) 310-31 (1978).
5.23. J.S. Wishnok and S.R. Tannenbaum, An Unknown Salivary Morpholine Metabolite, Anal. Chem., 49(8) 715-178 (1977).
5.24. N.I. Sax, Dangerous Properties of Industrial Materials, Van Nostrand Reinhold Company: New York, 946 (1975).
5.25. I.S. Krull, T.Y. Fan and D.H. Fine, Problem of Artifacts in the Analysis of N-Nitroso Compounds, Anal. Chem., 50(6), 698-700 (1978).