| Method no.: | 12 | ||||
| Matrix: | Air and bulk material samples | ||||
| Target concentration: |
| ||||
| Procedure: | Air samples are collected on activated charcoal, desorbed with carbon disulfide, and analyzed by gas chromatography. Bulk samples are analyzed by liquid chromatography. | ||||
| Detection limits: | Air Samples - 0.04 ppm Bulk Samples - 0.01% by volume | ||||
| Recommended air volume and sampling rate: |
10 L at 0.2 L/min | ||||
| Standard error of estimate at the target concentration: (Section 4.7.) |
5.4% | ||||
| Coefficient of variation for bulk samples: (Section 4.4.) |
1.7% | ||||
| Status: | Evaluated method. This method has been subjected to the established evaluation procedures of the Organic Methods Evaluation Branch. | ||||
| Date: September
1979 August 1980, Revised |
Chemist: Carl J. Elskamp | ||||
OSHA Analytical Laboratory
Salt Lake City, Utah
1. General Discussion
- 1.1. Background
- 1.1.1. History of procedure
Air samples have been analyzed at the OSHA laboratory according to the procedure validated by NIOSH. (Ref. 5.1.) The method involves collection of benzene vapor on charcoal, desorption with carbon disulfide (CS2), and analysis by gas chromatography (GC). Since this method was validated over the range of 13 to 51.8 ppm and the emergency temporary standard is 1 ppm, it was necessary to evaluate the method at this lower level.
The OSHA lab has normally determined the benzene content of bulks by GC analysis. Frequently interferences from aliphatics were a major problem in the analysis, thus the detection limit was on the order of 0.5% by volume. This problem of interferences is eliminated by high performance liquid chromatographic (HPLC) analysis using a UV detector as described in this method. The benzene is analyzed at a wavelength (i.e., 254 nm) where aliphatics will not interfere since most have a UV cut-off less than 200 nm. Thus, the detection limit in bulk samples is lowered to 0.01% by volume.
1.1.2. Toxic effects (Quoted from Ref. 5.2.) (This section is for information only and should not be taken as the basis of OSHA Policy.)
"Acute benzene exposure causes central nervous system depression; chronic exposure results in depression of the hematopoietic system and is said to be associated with an increased incidence of leukemia.
Human exposure to very high concentrations, approximately 20,000 ppm, was fatal in 5 to 10 min. (Ref. 5.4.) Brief exposure to concentrations in excess of 3000 ppm is irritating to the eyes and respiratory tract; continued exposure may cause euphoria, nausea, a staggering gait, and coma. (Ref. 5.5.) Inhalation of lower concentrations (250 to 500 ppm) produces vertigo, drowsiness, headache, and nausea. (Ref. 5.6.)
The most significant toxic effect of benzene exposure is an insidious and often irreversible injury to the bone marrow. Long-term exposures to low concentrations have been observed to have an initial stimulant effect on the bone marrow, followed by aplasia and fatty degeneration. (Ref. 5.6.) Clinically, an initial increase followed by a decrease in the erythrocytes, leucocytes, or platelets is observed with progression to aplastic anemia, leukopenia, pancytopenia, and thrombocytopenia. (Ref. 5.6.) Typical symptoms may be light-headedness, headache, nausea, loss of appetite, and abdominal discomfort; with more severe intoxication, there may be weakness, blurring of vision, and dyspnea on exertion. (Ref. 5.7.) The mucous membranes and skin may appear pale; a hemorrhagic tendency may result in petechiae, easy bruising, epistaxis, bleeding from the gums, or menorrhagia. (Ref. 5.7.)
Clinical and epidemiologic data suggest a leukemogenic action of benzene in humans, the leukemia tending to be acute and myeloblastic in type, sometimes following aplastic changes in the bone marrow; benzene may also induce chronic types of leukemia. (Ref. 5.8.) It is important to emphasize, however, that human exposure to benzene often involves concomitant exposure to other solvents and that animal experiments have not supported the view that benzene is a leukemogen. (Ref. 5.7.)
One epidemiologic study has indicated a fivefold excess of all leukemias and a tenfold excess of myelomonocytic leukemia among benzene-exposed workers as compared with the total U.S. white male population. (Ref. 5.9.) Among shoemakers chronically exposed to benzene, the annual incidence of leukemia was 13.5/100,000 while the incidence in the general population was 6/100,000. (Ref. 5.10.) Four cases of acute leukemia were reported in shoemakers exposed to benzene concentrations of up to 210 ppm for 6 to 14 years; two of the four had aplastic anemia prior to leukemia; three of the four cases of leukemia were of the acute myeloblastic type; the fourth patient developed thrombocythemia in the second year after an episode of aplastic anemia, and acute monocytic leukemia developed later. (Ref. 5.11.) In other studies, latency periods of up to 15 years following cessation of benzene exposure have been observed in the development of acute leukemia. (Ref. 5.6.)
Among workers exposed to benzene, excessive chromosome aberrations (stable and unstable) in the nuclei of lymphocytes have been reported. (Ref. 5.12.)
Tests for phenol levels in urine have been used as an index of benzene exposure; urinary phenol concentrations of 200 mg/L are indicative of exposure to approximately 25 ppm of benzene in air. (Ref. 5.13.)
Direct contact with the liquid may cause erythema and vesiculation; prolonged or repeated contact has been associated with the development of a dry, scaly dermatitis or with secondary infections. (Ref. 5.6.)
The TLV has been chosen, not as a "safe" or "no effect" level, but on the basis that this is the lowest level that generally can be achieved at this time. (Ref. 5.15.) OSHA issued an emergency temporary standard in 1977 limiting employee exposure to benzene to 1 ppm; the standard did not apply to retail automotive service stations or to operations which use liquid mixtures containing 1 per cent or less of benzene. (Ref. 5.6.)"
1.1.3. Operations where exposure occurs (Ref. 5.14.)
The first major industrial use of benzene was as a solvent in the
rubber industry just preceding World War I. During World War I,
benzene production was stimulated greatly by the demand for toluene
in the manufacture of explosives. The large quantities of benzene
which were produced resulted in its more widespread use as a
starting point for the manufacture of various organic compounds.
This situation led to greatly increased uses of benzene as a solvent
in the artificial leather, rubber goods, and
Industries and processes using benzene include coke and gas, chemical, printing and lithography, paint, rubber, dry cleaning, adhesives, petroleum, and coatings. Benzene is also used extensively in chemical laboratories as a solvent and reactant in numerous chemical applications.
During 1967, nearly 800 million gallons of benzene were produced
in the U.S. and by 1969, this figure increased to 1,185 million
gallons with approximately 16% derived from coal. About 87% is used
chiefly as an intermediate in producing other chemicals such as
phenol, cyclohexane, and styrene. The remaining 13% is used
primarily in the manufacture of detergents and pesticides with small
amounts used in solvents and paint removal formulations. Benzene is
also found in gasoline. Gasolines in England were reported to be as
high as 6% in benzene content and an ad hoc report on European
gasolines showed that most of the gasolines tested during 1970 to
1972 were in the 5% range with some up to 16%. Benzene analysis
reported in 1972 of 37 unleaded and
Benzene may also be a component in commercial grades of toluene,
xylene, and
Although benzene is generally used in enclosed systems wherever possible, exposures can occur from liquid transfer operations, equipment leakage, carry-over losses, and maintenance operations. Exposures also occur from its use as a solvent component in small plant open systems.
1.1.4. Size of work population that face exposure
NIOSH estimates that 2 million persons in the work force have potential exposure to benzene. (Ref. 5.14.)
1.1.5. Physical properties (Ref. 5.2., 5.3., and 5.16.)
| molecular weight: | 78.11 |
| boiling point: | 80.1°C |
| vapor pressure: | 75.1 mm Hg at 20°C |
| color: | clear, colorless |
| odor: | aromatic |
| flash point: | -11.1°C (closed cup) |
| specific gravity: | 0.8794 (20/4°C) |
| explosive limits: | lower 1.4% (by volume in air) upper 8.0% |
| vapor density: | 2.70 (relative to air) |
| common names: | Benzol; cyclohexatriene; phene; phenyl hydride; pyrobenzol. Note: Benzin, petroleum benzin and benzine are not benzene. However, they may contain varying amounts of benzene. |
| CAS no.: | 000071432 |
| structural formula: |
1.2. Detection limit, precision, sensitivity, and working range
- 1.2.1. The detection limit for the analytical procedure for air
samples is 1.28 ng with a coefficient of variation of 0.023 at this
level. The detection limit was determined using 1.0-µL injections.
(Section 4.1.)
The detection limit for the analytical procedure for bulk samples is 0.88 µg with a coefficient of variation of 0.019 at this level. The detection limit was determined using 10-µL injections. (Section 4.2.)
1.2.2. The pooled coefficient of variation of the analytical procedure for air samples over the range of 16.04 to 64.16 µg per sample is 0.008. This represents an air concentration range of 0.5 to 2.0 ppm based on the recommended air sample of 10 L. (Section 4.3.)
The pooled coefficient of variation of the analytical procedure for bulk samples over the range of 0.01% to 2.0% by volume is 0.017. (Section 4.4.)
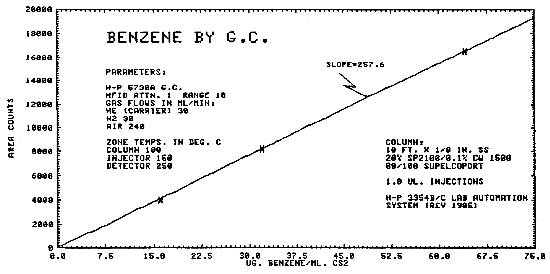
1.2.3. The sensitivity of the analytical procedure for air samples over a concentration range of 0.5 to 2 ppm based on the recommended air volume is 258 area units per µg/mL. The sensitivity is determined by the slope of the calibration curve. (Section 4.5.)
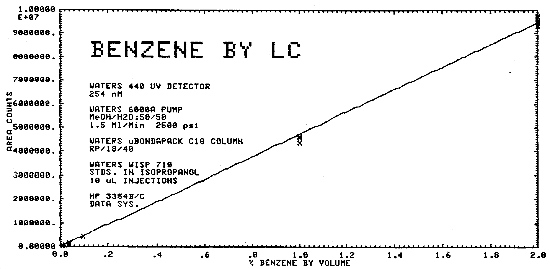
The sensitivity of the analytical procedure for bulk samples over a concentration range of 0.01 to 2.0% benzene by volume is 4.74 × 10⁶ area counts per % benzene by volume. This is determined by the slope of the calibration curve. (Section 4.6.)
The sensitivity will vary somewhat with the particular instrumentation used in the analysis.
1.2.4. The lower limit of the estimated working range for air samples, assuming adequate chromatographic separation and desorption efficiency is 0.04 ppm. The upper limit of the working range is dependent on the capacity of the activated charcoal.
The lower limit of the estimated working range for bulk samples, assuming adequate chromatographic separation is 0.01% benzene by volume.
1.3. Accuracy
- 1.3.1. The overall procedure must provide results that are ±25%
or better at the 95% confidence interval.
1.3.2. The recovery of analyte from the collection medium (activated charcoal) must be 75% or greater.
1.3.3. The overall procedure has met the above validation criteria. (Section 4.7.)
1.4. Advantages
- 1.4.1. Air samples
- 1.4.1.1. The sampling procedure is convenient.
1.4.1.2. The analytical procedure is quick, sensitive and reproducible.
1.4.1.3. Reanalysis of samples is possible.
1.4.1.4. Samples are stable, even at room temperature.
1.4.1.5. It may be possible to analyze other compounds simultaneously.
1.4.1.6. Interferences can be circumvented by proper selection of GC parameters.
1.4.2. Bulk samples
- 1.4.2.1. The analytical procedure is quick, sensitive, and
reproducible.
1.4.2.2. Reanalysis of samples is possible.
1.4.2.3. Interferences can be circumvented by proper selection of LC parameters.
1.5. Disadvantages
- 1.5.1. Air samples
- 1.5.1.1. The amount of sample that can be taken is limited by
the total milligrams the charcoal will adsorb before overloading.
1.5.1.2. The precision is limited by the reproducibility of the pressure drop across the tubes. The pumps are usually calibrated for one tube only.
1.5.2. Bulk samples
Samples must be free of any particulates, etc., that may clog the capillary tubing or column in the liquid chromatograph. This may require distilling the samples or clarifying them by filtration.
2. Sampling Procedure
- 2.1. Apparatus
- 2.1.1. A calibrated personal sampling pump whose flow can be
determined within ±5% at the recommended flow.
2.1.2. Activated charcoal tubes: Glass tube, with both ends heat
sealed, 70 mm ×
2.2. Reagents
None required.
2.3. Sampling technique
- 2.3.1. Immediately before sampling, break open the ends of the
charcoal tube. All tubes should be from the same lot.
2.3.2. Connect the charcoal tube to the sampling pump with flexible tubing. The short section of the charcoal tube is used as a backup and should be positioned nearer the sampling pump.
2.3.3. The tube should be placed in a vertical position during sampling to minimize channeling.
2.3.4. Air being sampled should not pass through any hose or tubing before entering the charcoal tube.
2.3.5. Seal the charcoal tube with plastic caps immediately after sampling. Wrap each tube lengthwise with official OSHA seals (Form 21).
2.3.6. With each batch of samples, submit at least one blank tube from the same lot used for samples. This tube should be subjected to exactly the same handling as the samples (break, seal, transport) except that no air is drawn through it.
2.3.7. Transport the samples (and corresponding paperwork) to the lab for analysis.
2.3.8. If bulk samples are submitted for analysis, they should be transported in glass containers with Teflon-lined caps. These samples must not be put in the same container used for the charcoal tubes.
2.4. Breakthrough
- 2.4.1. The average breakthrough (5% breakthrough) volume from a
2.0-ppm benzene test atmosphere at about 80% relative humidity and
22°C was 86 L when sampled at 0.21 L/min.
2.4.2. The breakthrough volume could be significantly lowered if other contaminants are present in the sample stream. This would be the case for petroleum distillate samples, such as naphtha, gasoline, etc.
2.5. Desorption efficiency
- 2.5.1. The desorption efficiency, from liquid injections onto
the front section of the tubes, averaged 99.4% from 0.5 to 2.0 ppm
for a 10-L air sample. (Section 4.8.)
2.5.2. The desorption efficiency of a particular compound may vary from one laboratory to another and also from one lot of charcoal to another. Thus, it is necessary to determine the desorption efficiency for a particular lot of charcoal.
2.6. Recommended air volume and sampling rate
- 2.6.1. The recommended air volume is 10 L.
2.6.2. The recommended sampling rate is 0.2 L/min.
2.7. Interferences
- 2.7.1. It is unknown if any other compound would severely
interfere with the collection of benzene on charcoal. In general,
the presence of other solvents will decrease the breakthrough volume
for a particular solvent.
2.7.2. Suspected interferences should be listed on the sample data sheets.
2.8. Safety precautions
- 2.8.1. Attach the sampling equipment on the employee so that it
does not interfere with work performance.
2.8.2. Wear safety glasses when breaking the ends of the sampling tubes.
2.8.3. Place the sampling tube in a holder so the sharp end is not exposed while sampling.
3. Analytical procedure
- 3.1. Apparatus
- 3.1.1. General
- 3.1.1.1. An electronic integrator or some other suitable
method of measuring peak areas.
3.1.1.2. Microliter syringes, 10-µL or other convenient sizes for preparing standards, 1-µL for GC sample injections and 10-µL for LC injections.
3.1.1.3. Volumetric flasks, 5-mL and other convenient sizes for preparing standards and making dilutions.
3.1.2. Air samples
- 3.1.2.1. Gas chromatograph equipped with a flame ionization
detector.
3.1.2.2. A GC column capable of separating CS2, benzene, an internal standard, and any interferences. The column used for validation studies was a 10 ft × 1/8 in. stainless steel, 20% SP2100, 0.1% CW1500 on 80/100 Supelcoport. Since benzene is frequently found in petroleum distillate type compounds, it is advisable to use a more polar column such as TCEP, SP1000, Penta, etc., that will allow the aliphatic compounds to elute quickly, usually before benzene. On some samples, it may be impossible to achieve proper separations using conventional packed columns. In these cases it is advisable to use a capillary column to achieve better separations.
3.1.2.3. Two-milliliter vials with Teflon-lined caps.
3.1.2.4. Pipets for dispensing CS2. The Glenco 1-mL dispenser is adequate and convenient.
3.1.3. Bulk samples
- 3.1.3.1. Liquid chromatograph equipped with a UV detector.
3.1.3.2. An LC column that will separate benzene from other components in the bulk sample being analyzed. The column used for validation studies was a Waters FBondapack C18, 30 cm × 3.9 mm.
3.1.3.3. A clarification kit to remove any particulates in the bulk if necessary.
3.1.3.4. A micro-distillation apparatus to distill any samples if necessary.
3.2. Reagents
- 3.2.1. General
Benzene, reagent grade.
3.2.2. Air samples
- 3.2.2.1. Chromatographic grade carbon disulfide
(CS2) which has been treated for the
removal of trace amounts of benzene. (Sections 4.9. and 4.10.)
3.2.2.2. An internal standard, such as p-cymene, reagent grade.
3.2.2.3. Desorbing reagent, 0.05 µL internal standard/mL CS2.
3.2.2.4. Purified GC grade helium, hydrogen, and air.
3.2.3. Bulk samples
LC grade water, methyl alcohol, and isopropyl alcohol.
3.3. Standard preparation
- 3.3.1. Air samples
The benzene is diluted with desorbing reagent to prepare standards in the working range. A solution of 36.5 nL of benzene per 1 mL of desorbing reagent is equivalent to 1.00 ppm benzene in air for a 10-L air sample desorbed with 1 mL of desorbing reagent.
3.3.2. Bulk samples
Benzene is diluted with isopropyl alcohol to prepare standards in the working range.
3.4. Sample preparation
- 3.4.1. Air samples
- 3.4.1.1. The front and back sections of each sample are
transferred to separate
3.4.1.2. Each section is desorbed with 1.0 mL of desorbing reagent.
3.4.1.3. The vials are sealed immediately and allowed to desorb for 30 min with intermittent shaking.
3.4.2. Bulk samples
- 3.4.2.1. If necessary, the samples are distilled or clarified.
3.4.2.2. Samples are analyzed undiluted. If the benzene concentration is out of the working range, suitable dilutions are made with isopropyl alcohol.
3.5. Analysis
- 3.5.1. Air samples
- 3.5.1.1. Air samples were analyzed using the following GC
conditions:
| flow rates (mL/min) | temperatures (°C) | |||
| helium | 30 | column | 100 | |
| hydrogen | 30 | injector | 150 | |
| air | 240 | detector | 250 | |
| injection size - 1 µL | ||||
| elution time - 2.5 min | ||||
| chromatogram (Section 4.11.) | ||||
3.5.1.2. Peak areas are measured by an integrator.
3.5.1.3. An internal standard procedure is used. The integrator is calibrated to report results in ppm for a 10-L air sample after correction for desorption efficiency.
3.5.2. Bulk samples
- 3.5.2.1. Bulk samples were analyzed using the following LC
conditions:
solvent - methyl alcohol/water, 50/50
analytical wavelength
- 254 nm
injection size - 10 µL (Since a high concentration of
non-polar aliphatic compound will distort the benzene peak on high
injection volumes, the volume of 10 µL is recommended as a maximum
size.
elution time - 8 min
chromatograms - (Section 4.11.)
3.5.2.2. Peak areas are measured by an integrator or other suitable means.
3.5.2.3. The integrator is calibrated to report results in % benzene by volume. If the samples have to be diluted with isopropyl alcohol, an appropriate factor must be applied.
3.5.2.4. If a series of bulk samples must be analyzed, in order to save time it is advantageous to switch to pure methyl alcohol as a solvent after the benzene has eluted to cause the later peaks to elute faster, as in coal tar naphtha.
3.6. Interferences
- 3.6.1. Any compound having the same general retention time of
benzene (or the internal standard in air sample analysis) is an
interference. Possible interferences are listed on the sample data
sheets. Parameters should be chosen to circumvent any interferences.
For air samples, if a bulk is submitted with the sample set, analyze
the bulk first so a suitable column and conditions can be chosen to
select a proper internal standard before the air samples are
desorbed. If interferences are a problem at 254 nm for bulk samples,
an alternate wavelength may be chosen to possibly circumvent the
problem.
3.6.2. Retention time data on a single column is not considered proof of chemical identity. Samples over the PEL should be confirmed by GC/MS or other suitable means, such as GC/IR, absorbance ratioing, etc.
3.7. Calculations
- 3.7.1. Air samples
Since the integrator is programmed to report results in ppm (at 25°C and 760 mm Hg) for a 10-L air sample (corrected for desorption efficiency), the following formula is used:
| ppm benzene = | A
(0.1) (B) |
| where | A = ppm on report B = air volume (L) |
3.7.2. Bulk samples
Since the integrator is programmed to report results in % benzene by volume in an undiluted sample, the following formula is used:
% benzene by volume = (A)(B)
| where | A | = | % by volume on report |
| B | = | Dilution Factor (B = 1 for undiluted sample) |
3.8. Safety precautions
- 3.8.1. All work done with the solvents (preparation of
standards, desorption of samples, etc.) should be done in a hood.
3.8.2. Avoid skin contact with all of the solvents.
3.8.3. Wear safety glasses at all times.
4. Backup Data
- 4.1. Detection limit - air samples
The detection limit data were obtained by making 1-µL injections of a 1.283 µg/mL standard. This standard would be equivalent to 0.040 ppm for a 10-L air sample.
Detection Limit - Air Samples
|
| ||||||
| injection | area counts | injection | area counts | |||
|
| ||||||
| 1 2 3 |
655.4 617.5 662.0 |
4 5 6 |
641.1 636.4 629.2 | |||
| ||||||
|
| ||||||
4.2. Detection limit - bulk samples
The detection limit data were obtained by making 10-µL injections of a 0.01% by volume standard.
Detection Limit - Bulk Samples
|
| ||||||
| injection | area counts | injection | area counts | |||
|
| ||||||
| 1 2 3 |
45386 44241 43822 |
4 5 6 |
44062 44006 42724 | |||
| ||||||
|
| ||||||
4.3. Pooled coefficient of variation - air samples
The pooled coefficient of variation for the analytical procedure
was determined by making
Pooled Coefficient of Variation - Air Samples
|
| |||
| ppm | 0.5 | 1.0 | 2.0 |
|
| |||
| area counts SD CV |
3996.5 4059.4 4052.0 4027.2 4046.8 4137.9 4053.3 47.2 0.0116 |
8130.2 8235.6 8307.9 8263.2 8291.1 8288.8 8254.0 62.5 0.0076 |
16481 16493 16535 16609 16552 16618 16548.3 57.1 0.0034 |
|
| |||
4.4. Pooled coefficient of variation - bulk samples
The pooled coefficient of variation for the analytical procedure
was determined by making
Pooled Coefficient of Variation - Bulk Samples
|
| ||||||
| 0.01% | 0.02% | 0.04% | 0.10% | 1.0% | 2.0% | |
|
| ||||||
| area counts SD CV |
45386 44241 43822 44062 44006 42724 44040.1 852.5 0.0194 |
84737 84300 83835 84381 83012 81957 83703.6 1042.2 0.0125 |
166097 170832 164160 164445 168398 173002 167822 3589.8 0.0213 |
448497 441299 443719 444842 442564 443975 444149 2459.1 0.0055 |
4395380 4590800 4593200 4642350 4646430 4646260 4585767 96839.3 0.0211 |
9339150 9484900 957580 9677060 9766240 ----- 9564986 166233 0.0174 |
|
| ||||||
4.5. Sensitivity data - air samples
The same analytical standards as in Section 4.3. were used to construct a calibration curve as shown in Figure 4.5.
4.6. Sensitivity data - bulk samples
The same analytical standards as in Section 4.4. were used to construct a calibration curve as shown in Figure 4.6.
4.7. Storage data - air samples
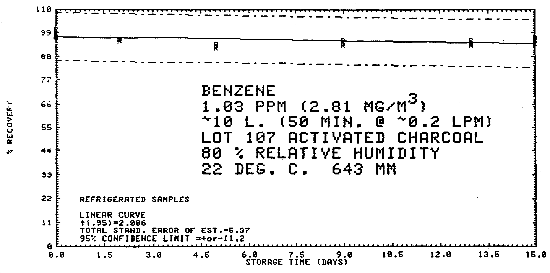
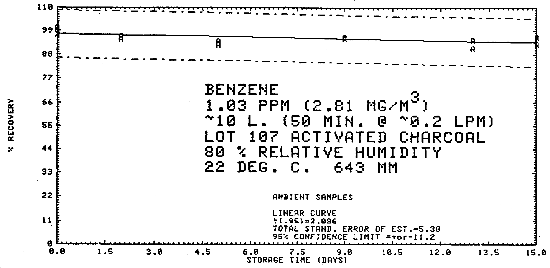
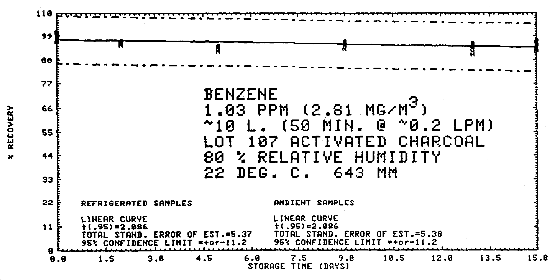
Samples were generated at 1.03 ppm benzene at 80% relative humidity, 22°C, and 643 mm Hg. All samples were taken for 50 min at 0.2 L/min. Six samples were analyzed immediately and fifteen samples each were stored at refrigerated (-25°C) and ambient temperatures (about 23°C). These samples were analyzed over a period of fifteen days. The results are tabulated below and shown graphically in Figures 4.7.1. through 4.7.3.
Storage Tests
|
| |||||||
| storage time | % recovery | ||||||
| (days) | (refrigerated) | (ambient) | |||||
|
| |||||||
| 0 0 2 5 9 13 15 |
97.4 97.1 95.8 93.9 93.6 94.3 96.8 |
98.7 100.6 96.4 93.7 95.5 95.3 95.8 |
98.9 100.9 95.4 92.4 94.6 93.7 94.2 |
97.4 97.1 95.4 92.4 95.2 91.0 92.9 |
98.7 100.6 96.6 94.3 95.6 95.0 96.3 |
98.9 100.9 96.9 94.1 96.6 94.6 95.9 | |
|
| |||||||
4.8. Desorption data
Samples were prepared by liquid injection onto the front section of charcoal tubes. Samples were prepared that would be equivalent to 0.5, 1.0, and 2.0 ppm for a 10-L air sample. Six samples were prepared at each concentration.
Desorption Efficiency
|
| |||
| ppm | 0.5 | 1.0 | 2.0 |
|
| |||
| desorption efficiency, % SD CV |
99.4 99.5 99.2 99.4 99.2 99.8 99.4 0.22 0.0022 |
98.8 98.7 98.6 99.1 99.0 99.1 98.9 0.21 0.0021 |
99.5 99.7 99.8 100.0 99.7 99.9 99.8 0.18 0.0018 |
|
| |||
4.9. Benzene contamination of carbon disulfide and various bulk materials
Various CS2 samples were analyzed by GC. The results are tabulated below. The treated sample was treated as explained in Section 4.10. As can be seen, it is important that the CS2 be treated before using it for a desorption solvent.
Benzene Contaminant Found in CS2
|
| ||
| sample | µg benzene/mL | ppm equivalent (for 10-L air sample) |
|
| ||
| ALDRICH Lot 83017 BAKER Lot 720364 BAKER Lot 822351 Malinkrodt Lot WEMP Malinkrodt Lot WDSJ Malinkrodt Lot WHGA Treated CS2 |
4.20 1.01 1.01 1.74 5.65 2.90 ND |
0.13 0.03 0.03 0.05 0.18 0.09 -- |
|
| ||
Various bulk materials were analyzed by LC to determine their benzene content. The results are shown in Table 4.9.2.
Benzene Found In Various Substances
|
| |
| sample | % benzene (v/v) |
|
| |
| Lantern Fuel Carburetor Cleaner Regular Gasoline Premium Gasoline Unleaded Gasoline Hexane (nanograde) Charcoal Lighter Paint Thinner Patco Lamp Fluid Stoddard Solvent VM & P Naphtha Naphtha Ligroine Petroleum Ether Naphtha* VM & P Naphtha* Paint Thinner* Cleaner* |
0.14 0.10 0.33 0.39 0.78 0.11 0.01 0.01 ND ND 0.01 ND 0.01 ND ND ND 0.01 ND |
|
| |
| * OSHA field sample | |
4.10. Removal of benzene from the CS2 desorption solvent.
The trace amounts of benzene found in CS2 must be removed before it can be used as the desorption solvent. The pretreatment of CS2 was adapted from a paper by Levadie and MacAskill. (Ref. 5.17.) To a round bottom flask containing approximately 500 mL of CS2, add 10 mL of concentrated sulfuric acid and 5 drops of concentrated nitric acid. Heat this under reflux for 2 to 3 h to totally convert the benzene to nitrobenzene. The CS2 layer is decanted off, dried with anhydrous sodium sulfate, and then distilled. The CS2 is now free of benzene.
Trace amounts of benzene can also be removed from carbon disulfide by passing it through a bed of 13× molecular sieve. This more convenient technique was not known during the evaluation of this method. Lab experiments indicate that 50 g of Molecular Sieve 13× contained in a column (about 1-in. i.d.) can purify about 1 L of benzene before it requires regeneration. It can be regenerated by heating for at least 4 h at 400°C in a tube furnace while purging with nitrogen.
4.11. Chromatograms
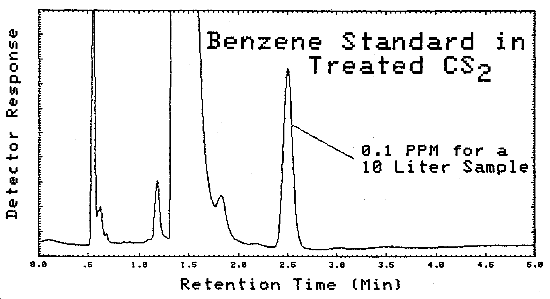
A typical chromatogram of a GC analysis of a standard is shown in Figure 4.11.1. The analytical conditions are given in Figure 4.5.
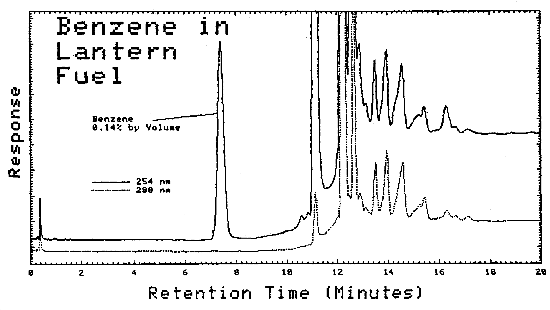
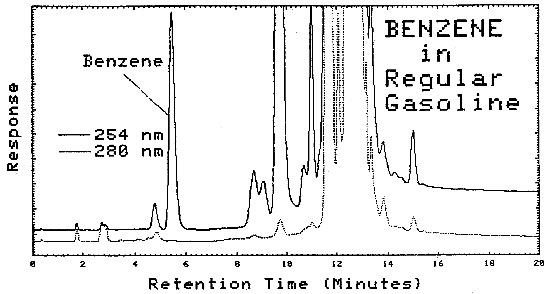
Typical chromatograms obtained from LC analysis of bulk samples are shown in Figures 4.11.2. and 4.11.3. The chromatograms were obtained using the same parameters as given in Figure 4.6., except that as soon as the benzene was eluted, the mobile phase was programmed to 100% methanol. This caused the heavier molecules to elute faster.
5. References
- 5.1. U.S. Department of Health, Education, and Welfare, Public
Health Service, Center for Disease Control, NIOSH, NIOSH Manual of
Analytical Methods, Second edition, Vol. 3,
5.2. Proctor, N.H.: Chemical Hazards of the Workplace, p. 118-120, J.B. Lipincott Company, 1978.
5.3. The Merck Index, Eighth Edition, Paul G. Stecher, Editor, 1968, page 128.
5.4. Flury, F.: Moderne gewerbliche vergiftungen in pharmakologischtoxikologische hinsicht. Arch. Exp. Pathol. Pharmakol., 138:65, 1928.
5.5. Gerarde, H. W.: Toxicology and Biochemistry of Aromatic Hydrocarbons. pp. 97-108. New York: Elsevier, 1960.
5.6. Department of Labor: Occupational exposure to benzene. Federal Register 42:22516, 1977.
5.7. Committee on Toxicology of the National Research Council:
Health Effects of
5.8. Vigliani, E.C.: Leukemia associated with benzene exposure. Ann. N.Y. Acad., Sci., 271:143, 1976.
5.9. Infante, P.F., Rinksy, R.A., Wagoner, J.K., and Young, R.J.: Leukemia among workers exposed to benzene. NIOSH, April 26, 1977.
5.10. Aksoy, M., Erdem, S., and Dincol, G.: Types of leukemia in chronic benzene poisoning: a study in thirty-four patients. Acta Hematol., 55:65,1976.
5.11. Aksoy, M., Dincol, K., Erdem, S., and Dincol, G.: Acute leukemia due to chronic exposure to benzene. Am. J. Med., 52:160, 1972.
5.12. Tough, I. M., and Brown, W. M.: Chromosome aberrations and exposure to ambient benzene. Lancet, 1:684, 1965.
5.13. Wakley, J. E., Pagnotto, L.D., and Elkins, H.B.: The measurement of phenol in urine as an index of benzene exposure. Am. Ind. Hyg. Assoc. J., 22:362, 1961.
5.14. National Institute for Occupational Safety and Health, U.S. Department of Health, Education and Welfare: Criteria for a Recommended Standard. Occupational Exposure to Benzene, (NIOSH) Washington, D.C.: U.S. Government Printing Office, 1974.
5.15. A.C.G.I.H.: Benzene. Documentation of the TLVs for Substances in Workroom Air. ed. 3, pp. 355-356. Cincinnati, 1976.
5.16. Manufacturing Chemists Assoc., Chemical Safety Data Sheets D-3, 1960, Third Edition.
5.17. Levadie, B. and MacAskill, S.M., "Analysis of Organic
Solvents Taken on Charcoal Tube Samplers by a Simplified Technique,"
Anal. Chem. Vol. 48, No. 1, Jan. 1976, pp