DIMETHYLNITROSAMINE
| Method no.: | 06 |
| Matrix: | Air |
| OSHA Standard: | OSHA regulated carcinogen. The standard applies to all solid or liquid mixtures that contain more than 1.0% dimethylnitrosamine by weight or volume. |
| Target concentration: | 6.4 µg/m3 (2.1 ppb) |
| Procedure: | Collection on treated Florisil adsorbent tubes. Two tubes are used in series, each of which has been pretreated with 10 mg DL-a-tocopherol. Samples are desorbed with a 50/50 (v/v) methylene chloride-methyl alcohol solution. Analysis is by gas chromatography with chemiluminescence detection. |
| Detection limit based on recommended air volume: |
0.4 µg/m3 (130 ppt) (For analytical method only) |
| Recommended air volume and sampling rate: |
25 L at 0.2 L/min |
| Standard error of estimate at the target concentration: (Section 4.3.) |
7.5% |
| Special requirements: | The treated Florisil tubes must be protected from light during and after sampling. |
| Status of method: | A sampling and analytical method which has been subjected to the established evaluation procedures of the Organic Methods Evaluation Branch. |
| Date: May 1979 | Chemist: Warren Hendricks |
Organic Methods Evaluation Branch
OSHA Analytical
Laboratory
Salt Lake City, Utah
1. General Discussion
1.1. Background
1.1.1. History
Sample Collection: Dimethylnitrosamine (DMN) vapors have been collected using cryogenic techniques that involve the use of successive cold traps (Ref. 5.1.), ambient temperature KOH bubblers (Ref. 5.2.), Tenax GC cartridges (Ref. 5.3.), and XAD-4 resin tubes (Ref. 5.4.). For various reasons, these air sampling procedures are not well suited for use by OSHA personnel. Therefore, the primary emphasis of this work has been to develop new air sampling techniques.
Analytical: The analytical procedures for airborne DMN usually include separation by gas chromatography and detection by one or more of the following techniques: mass spectrometer (Ref. 5.5.), Coulson Electrolytic Conductivity Detector (Ref. 5.6.), Hall Electrolytic Conductivity Detector (Ref. 5.7.), nitrogen selective alkali flame-ionization detector (Ref. 5.8.) and Thermal Energy Analysis (Ref. 5.9.). This method utilizes separation by gas chromatography and detection by the Thermal Energy Analyzer (TEA). The TEA detector was selected because it is both sensitive and selective for nitrosamines.
1.1.2. Toxic effects (This section is for information only and should not be taken as a basis for OSHA policy.)
Acute: The LD50, in the rat, for DMN is 26 mg/kg and the LC50 is 78 ppm over 4 h (Ref. 5.10.). A single dose of about 25 mg/kg DMN administered orally, to the rat, or by intravenous, intraperitoneal or subcutaneous injection produces serious destruction of liver tissue accompanied by hemorrhages into the liver and lungs. Often there occurs a serious accumulation of fluid in the abdominal area and blood in the lumen of the intestines. Death usually occurs in 2-4 days or the animal recovers completely. Rabbits, mice, guinea pigs, and dogs all develop similar liver damage (Ref. 5.11).
Chronic: When DMN was administered, to the rat, in continuous doses low enough for the animal to survive 30 weeks or longer, the result was cancer of the liver. If the agent was given at higher concentrations for shorter periods, or as a single dose, kidney tumors developed. It has been shown that liver and kidney tumors can infrequently develop simultaneously after exposure to DMN. However, in general, continuous low exposures cause cancer of the liver and higher concentrations for short periods (or as a single dose) result in kidney tumors (Ref. 5.11.).
Although, in the rat, cancers of the liver and the kidney are the most important result of exposure to DMN, the agent will also produce lung and nasal sinus tumors in the animal. DMN will cause tumors of the liver, kidney, and lung in the mouse, of the liver in the Syrian hamster and of the liver in the Rainbow trout (Ref. 5.11.).
The fact that a single exposure to DMN can result in cancer has tremendous implications with respect to man. While there is no direct evidence that exposure to DMN leads to cancer in humans, indirect evidence, obtained from laboratory experiments that measured the relative metabolic rates of DMN by rat and human liver slices, indicate that man is probably about as sensitive to the carcinogenic action of DMN as is the rat (Ref. 5.12.).
1.1.3. Workplace exposure
It is more difficult to determine point sources for DMN emissions than for other toxic agents because DMN is not extensively used by industry and most current occupational exposures will probably occur as a result of the chemical formation of the compound from its precursors rather than from the known utilization of the chemical.
The chemical reaction, in the condensed phase, between nitrous acid and dimethylamine (DMA) or trimethylamine (TMA) to form DMN is well known (Ref. 5.13.). Recently it has been shown that DMA and TMA can react with oxides of nitrogen in the vapor phase to give DMN as a reaction product (Ref. 5.14.). This means that even though DMN is not used at a particular location, it may be formed from its precursors and therefore be found in the occupational environment.
The fact that oxides of nitrogen can chemically react with amines to produce airborne nitrosamines is of special interest in light of the fact that there appears to be a statistical correlation between high concentrations of NO2 and high incidence of cancer in some urban areas (Ref. 5.15.). NO2, in itself, is probably not a carcinogen (Ref. 5.16.).
Exposure to DMN can occur during operations in which DMA or TMA is utilized or produced. The exposure results because both DMA and TMA are often contaminated with the nitrosamine. Further, if the amine is used as a chemical intermediate, DMN can possibly appear in the reaction product (Ref. 5.17.).
DMN is used extensively in cancer research facilities. Human exposure occurs when unchanged DMN is excreted by the laboratory animals (Ref.5.7.).
DMN has been used as an industrial solvent and as a chemical
intermediate in the production of
Non-occupational exposure to DMN can occur through the use of nitrite cured food products. DMA has been shown to react with nitrite to produce DMN in the stomachs of rats (Ref. 5.18.). DMN has been reported to be a component of tobacco and tobacco smoke and to be present in some alcoholic beverages (Ref. 5.19.).
1.1.4. Physical properties - (Ref. 5.18. and 5.20.)
| CAS no.: | 62-75-9 |
| mol wt: | 74.1 |
| appearance: | nonviscous yellow liquid |
| boiling point: | 149-150°C (755 mm Hg), 50-52°C (14 mm Hg) |
| density: | 1.0048 (20/4°C) |
| refract. index: | 1.4368 (25°C/D) |
| absorp. spec.: | 230 nm log e 3.86 |
| (in water) | 332 nm log e 1.98 |
| solubility: | miscible with water in all proportions, soluble in all common organic solvents, |
| volatility: | very volatile |
| molecular structure: | 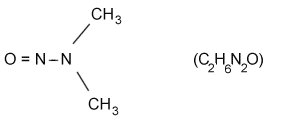 |
| synonyms: | Dimethylamine, |
1.2. Detection limit, precision, sensitivity and working range
1.2.1. The detection limit for the analytical procedure is 50 pg. The coefficient of variation was 0.15 at this concentration (Section 4.1.). The detection limit was determined using 5-µL injections from standard solutions.
1.2.2. The pooled coefficient of variation for the analytical procedure over the range of 80 to 320 ng per sample was 0.042 (Section 4.2.). This represents an air concentration range of from 3.2 to 12.8 µg/m3 based on the recommended sampling and analytical procedures.
1.2.3. The sensitivity of the analytical procedure over a concentration range of 80 to 320 ng (3.2 to 12.8 µg/m3 based upon the recommended air sampling volume of 25 L) is 227908 area units (HP-5840A) per µg/mL. The sensitivity is determined by the slope of the calibration curve (Section 4.2.). The sensitivity will vary somewhat with the particular instrumentation used in the analysis.
1.2.4. The lower limit of the estimated working range, assuming adequate desorption efficiency, is 0.4 µg/m3. The upper limit of the working range is dependent on the capacity of the treated Florisil tubes.
1.3. Accuracy
1.3.1. The overall procedure must provide results that are within ±25% of the true value at the 95% confidence interval.
1.3.2. The recovery of analyte from the collection medium during storage must be 75% or greater.
1.3.3. The overall procedure has met the above validation criteria (Section 4.3.).
1.4. Advantages
1.4.1. The sampling procedure is convenient.
1.4.2. The significance of artifactual formation of DMN upon the sampling device has been eliminated through pretreatment of the air sampler.
1.4.3. The analytical procedure is quick, sensitive, and reproducible.
1.4.4. Reanalysis of the samples is possible.
1.4.5. The samples are stable, even when stored at room temperature for 17 days.
1.4.6. It may be possible to determine other nitrosamines simultaneously.
1.4.7. The effects of potential interferences are reduced through the use of a selective detector (the TEA) and can be further reduced by proper selection of GC parameters.
1.5. Disadvantages
1.5.1. The relative humidity of the sampled air affects the ability of the adsorbent to retain the analyte.
1.5.2. The sampling method has not been field tested.
2. Sampling Procedure
2.1. Apparatus
2.1.1. An approved and calibrated personal sampling pump whose flow can be determined to ±5% at the recommended flow rate.
2.1.2. Florisil adsorbent tubes: Glass tubes, 6-mm o.d., 4-mm
i.d., 7-cm length, containing 100-mg front and 50-mg rear (separated
by a 2-mm portion of urethane foam or silylated glass wool) sections
of 20/40 mesh Florisil. SKC Inc. Catalog No. 226-39 or equivalent.
Each tube is pretreated with 10 mg of
2.2. Reagents
None required.
2.3. Sampling Technique
2.3.1. The air sampler is composed of two treated Florisil tubes in series. The tubes are easily connected with an end cap that has been modified by cutting off the closed portion.
2.3.2. Connect the air sampler to the sampling pump with flexible tubing. The 50-mg section of each tube should be positioned toward the sampling pump. Cover each tube of the air sampler with masking tape or other suitable material to prevent light from reaching the adsorbent.
2.3.3. The air sampler should be placed in a vertical position during sampling to minimize channeling.
2.3.4. Sampled air should not pass through any hose or tubing before entering the sampling device.
2.3.5. Immediately after sampling, separate the air sampler into its component tubes, identify each tube as front or backup and seal each tube with plastic end caps. Also, wrap each sample end to end with official OSHA seals.
2.3.6. With each batch of samples, submit at least one blank tube from the same lot used for samples. This tube should be subjected to exactly the same handling as the samples (seal, transport) except that no air is drawn through it.
2.3.7. Transport the samples (and corresponding paperwork) to the lab for analysis.
2.3.8. If bulk samples are submitted for analysis, they should be transported in glass containers with Teflon-lined caps. The samples must be protected from light. These samples must not be put in the same container used for the treated Florisil tubes.
2.4. Breakthrough
The relative humidity of the sampled air has a significant effect on the ability of the Florisil adsorbent to retain DMN. For example, after more than 1000 L of air at about 30% relative humidity were drawn through a treated Florisil tube containing 0.6 µg DMN (added via liquid injection), all the analyte remained on the front section of the single tube. In contrast, when 60 L of air at near 100% relative humidity were drawn through a tube containing a similar amount of DMN, no analyte was retained on either section of the tube.
The analyte was found to migrate from the front to the rear section of a treated Florisil tube. The migration was complete after three days storage at room temperature with the DMN evenly distributed throughout the adsorbent.
Because of the humidity effect upon DMN retention and also because of the ability of the analyte to migrate from the front to the rear section of the tube, it was decided to use two treated Florisil tubes in series.
Laboratory experiments indicate that 25 L of air at 80% relative humidity and 22°C may be sampled with no loss of analyte. When the air sampler was challenged with 0.32 µg DMN, as a vapor, breakthrough from the front to the rear tube, at this humidity was about 30%.
No quantitative breakthrough information can be obtained from the analysis of individual tubes from a particular air sampler, but, if the amount found on the rear tube is 45%, or greater, of the total, then it is possible that some of the analyte may have been lost.
2.5. Desorption efficiency
2.5.1. The average desorption from
2.5.2. The desorption efficiency for DMN may vary from one
laboratory to another and also from one lot of
2.6. Recommended air volume and sampling rate
2.6.1. The recommended air volume is 25 L.
2.6.2. The recommended sampling rate is 0.2 L/min.
2.7. Interferences
2.7.1. Since it is possible that the precursors of DMN, such as DMA, TMA, and various nitrosating agents (oxides of nitrogen, nitrites, etc.), are present in the environment, it is conceivable that DMN may be formed upon the sampling device and not be present in the sampled air.
Laboratory experiments indicate that it is possible to form DMN
from its precursors on untreated Florisil tubes. Further experiments
show that when the Florisil tube is treated with 10 mg of
2.7.2. At the present time, it is unknown if any compound would severely interfere with the collection of DMN on treated Florisil tubes. In general, the presence of other compounds will reduce the breakthrough volume for a particular compound.
2.7.3. Any compound which is suspected of interfering with the collection or analysis should be listed on the sampling data sheet.
2.7.4. Light will decompose DMN (Ref. 5.18.). The air sampler must be protected from light during and after sampling.
2.8. Safety precautions (sampling)
2.8.1. Observe due care when working with the sharp ends of the air sampler.
2.8.2. Attach the sampling equipment to the worker in such a manner that it will not interfere with work performance.
2.8.3. Follow all safety practices that apply to the work area being sampled.
3. Analytical Method
3.1. Apparatus
3.1.1. A gas chromatograph interfaced to a Thermal Energy Analyzer.
3.1.2. A GC column capable of resolving DMN from the desorption solvent and potential interferences. The column used in this work was a 12-ft × 1/8-in. stainless steel column containing 10% Carbowax 20M with TPA on 80/100 mesh Chromosorb W AW.
3.1.3. An electronic integrator or other suitable method to measure peak area.
3.1.4. An analytical balance capable of accurately weighing standards.
3.1.5. Vials. 2-mL vials with Teflon-lined caps.
3.1.6. Microliter syringes. 5-µL syringe for sample injections, and convenient sizes.
3.1.7. Pipets. Convenient sizes for diluting standards. A
3.1.8. Volumetric flasks. Convenient sizes for diluting standards.
3.1.9. Dewar flask. Convenient sizes for liquid nitrogen.
3.2. Reagents
3.2.1. DMN, authentic primary standard, 98% minimum.
3.2.2. Methyl alcohol, chromatographic grade.
3.2.3. Methylene chloride, chromatographic grade.
3.2.4. Isopropyl alcohol, chromatographic grade.
3.2.5. Ethyl alcohol, U.S.P., 95%.
3.2.6. Gases, purified GC grade, helium and medical grade oxygen.
3.2.7. Nitrogen, liquid.
3.3. Sample Preparation
3.3.1. The status of the OSHA seal on each sample is noted and recorded as intact, broken, or none.
3.3.2. The field and laboratory identification numbers on the sample are checked against those on the sample identification sheets.
3.3.3. Suitable precautions must be undertaken to prevent exposure of samples to light. DMN will photodecompose easily.
3.3.4. The front and rear tubes from each sampler are transferred to separate 2-mL vials.
3.3.5. Each tube is desorbed with 1.0 mL of desorbing solution. The desorbing solution is composed of equal parts by volume methyl alcohol and methylene chloride.
3.3.6. The vials are sealed immediately with Teflon-lined caps and are desorbed for 30 min with intermittent shaking.
3.4. Standard preparation
3.4.1. Stock standards are prepared by diluting a weighed amount of DMN with isopropyl alcohol. The stock standard is diluted to the working range with isopropyl alcohol (See Section 3.8. Safety Precautions).
3.4.2. A solution composed of 0.14 µg/mL DMN in isopropyl alcohol equals an air concentration of 6.4 µg/m3 for a 25-L air sample desorbed with 1.0 mL of desorbing solution. This amount is corrected for the desorption efficiency.
3.4.3. Standards are stored in dark bottles under refrigeration.
3.5. Analysis
3.5.1. GC conditions
| helium (carrier gas) flow rate: | 30 mL/min |
| injector temperature: | 200°C |
| column temperature: | 170°C |
| TEA transfer line temperature: | 205°C |
| injection volume: | 5 µL |
| elution time: | 2 min |
3.5.2. TEA conditions
| oxygen pressure: | 9 PSI |
| CC pyrolyzer furnace temperature: | 475°C |
| chamber vacuum: | 1.8 mm Hg |
| coarse zero: | high |
| calibrate: | 0.0 |
| at tenuator: | 1 |
| cold trap temperature: | -130°C (ethyl alcohol and liquid nitrogen) |
Complete instructions for the TEA are found in its manual.
3.5.3. Chromatogram (Section 4.6.)
3.5.4. Peak areas are measured by an electronic integrator or other suitable means.
3.5.5. An external standard procedure is used to prepare a calibration curve from the analysis of at least three different standard solutions. The calibration curve is prepared daily. The integrator is calibrated to report results in µg/mL after correction for desorption efficiency.
3.5.6. Bracket the samples with analytical standards.
3.6. Interferences
3.6.1. Any compound that has the same GC retention as DMN and will elicit a response from the TEA detector is an interference.
3.6.2. GC parameters may be changed to circumvent most interferences.
3.6.3. Retention time on a single GC column is not proof of chemical identity. Samples should be confirmed by GC/MS or other suitable means when required.
3.7. Calculations
3.7.1. The integrator value in µg/mL (corrected for desorption efficiency) is used for reference only. More reliable results are obtained by use of the calibration curve. The peak area for each standard is compared to its concentration in µg/mL (corrected for desorption efficiency) and the equation for the best straight line through the data points is determined by linear regression.
3.7.2. The concentration in µg/mL (corrected for desorption efficiency) for a sample, is determined by comparing the area of a particular sample to the calibration curve.
3.7.3. Analytical results from the two tubes that compose a particular air sampler are added together.
3.7.4. The air concentration for a sample is calculated by the following equation:
DMN, µg/m3 = (A)(B)(1000)/C
| where | A | = | µg/mL from 3.7.3. |
| B | = | desorption volume | |
| C | = | air volume in liters |
3.7.5. To convert µg/m3 to parts per billion (ppb) the following relationship is used:
DMN, ppb = (µg/m3)(24.46)/74.1
| where | µg/m3 | = | result from 3.7.4. |
| 24.46 | = | molar volume at 25°C and 760 mm Hg. | |
| 74.1 | = | molecular weight of DMN |
3.8. Safety precautions (analytical)
3.8.1. DMN is an extremely potent carcinogen and utmost care must be exercised when working with this compound.
3.8.2. Avoid skin contact with liquid nitrogen and the solvents.
3.8.3. Confine the use of solvents to a fume hood.
3.8.4. Wear safety glasses in all laboratory areas.
3.8.5. Check to be sure that the TEA exhaust is connected to a fume hood.
4. Backup Data
4.1. Detection limit
The following data were generated by replicate 5-µL injections of a standard solution whose concentration was 0.01 µg/mL.
The detection limit was determined to be 50 pg which is equivalent to 0.4 µg/m3 based on the recommended air volume.
Peak heights were used because integrated area data were unreliable at this level.
Table 4.1.
Detection Limit Data
|
| ||||
| injection | peak height, mm | statistics | ||
|
| ||||
| 1 | 98 | |||
| 2 | 89 | = | 85.17 | |
| 3 | 95 | SD | = | 12.58 |
| 4 | 70 | CV | = | 0.15 |
| 5 | 69 | |||
| 6 | 90 | |||
|
| ||||
4.2. Instrument response to DMN and Precision
The data in Table 4.2. represent multiple injections of standard solutions. The injection volume was 5 µL and the concentrations of the standards were 0.08 µg/mL, 0.16 µg/mL and 0.32 µg/mL. Peaks were integrated by a Hewlett-Packard 5840A Gas Chromatograph.
Table 4.2.
Instrument Response and Precision
|
| |||
| × target conc. | 0.5× | 1× | 2× |
| pg/injection | 400 | 800 | 1600 |
|
| |||
| area | 20550 | 41100 | 76440 |
| counts | 18370 | 38470 | 74160 |
| 19600 | 39830 | 79200 | |
| 20480 | 42950 | 73200 | |
| 19440 | 42310 | 74880 | |
| 20460 | 38400 | 72160 | |
| 19816.7 | 40510.0 | 75006.7 | |
| SD | 857.1 | 1929.6 | 2519.5 |
| CV | 0.0433 | 0.0476 | 0.0336 |
|
| |||
A typical calibration curve is shown in Figure 4.2. The curve indicates a linear relationship and has a slope of 227908 area counts per (µg/mL).
4.3 Storage
Samples were generated by the liquid injection of DMN on Tenax GC tubes containing about 45 mg Tenax GC. The tubes were allowed to equilibrate overnight and then were placed in front of the treated Florisil tubes. Twenty-five liters of humid air, at 80% relative humidity and 22°C, were drawn through the sampling train. The DMN on the Tenax GC tube was desorbed by the humid air and was deposited on the air sampler. Studies conducted at ambient relative humidity and temperature indicated that desorption was essentially complete after 5 L of air had passed through the Tenax GC tube (Figure 4.3.1.). In these studies the spiked Tenax GC tube was connected directly to the TEA.
The following data represents the effects of storage at ambient
Table 4.3.
Storage Test at Ambient Temperature
|
| |||
| storage time | % recovery | ||
| (days) | |||
|
| |||
| 0 | 87.5 | 84.4 | 82.5 |
| 3 | 87.5 | 80.0 | 80.0 |
| 6 | 85.0 | 88.8 | 97.5 |
| 10 | 78.8 | 85.6 | 87.5 |
| 13 | 80.6 | 78.1 | 78.1 |
| 17 | 81.9 | 94.4 | 83.8 |
|
| |||
4.4. Preparation of pretreated sampling tubes
4.4.1 Reagents
Methylene chloride, chromatographic grade.
4.4.2. Procedure
Each tube is pretreated with 10 mg of
4.5. Desorption
Samples representing 3.2, 6.4, and 12.8 µg/m3 based on 25-L air volumes were prepared by injecting liquid standards on treated Florisil tubes.
Table 4.5.
Desorption Efficiency
|
|
||||
| µg/m3 | 3.2 | 6.4 | 12.8 | |
|
| ||||
| desorption | 70.0 | 90.0 | 83.8 | |
| efficiency, | 77.5 | 86.9 | 83.8 | |
| % | 68.6 | 78.8 | 87.5 | |
| 130.0 | 74.4 | 82.2 | ||
| 127.5 | 91.9 | 86.6 | ||
| 75.0 | 100.6 | 85.6 | ||
| 91.4 | 87.1 | 84.9 | ||
| overall average = 87.8 | ||||
|
| ||||
4.6. Chromatogram
A typical chromatogram is shown in Figure 4.6.
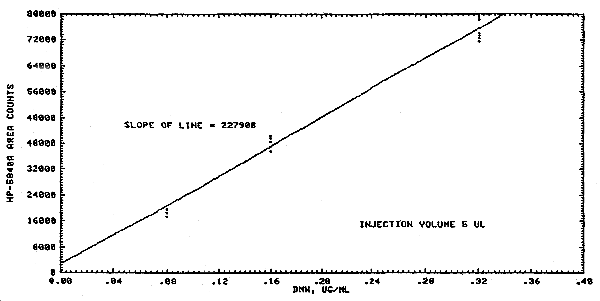
Figure 4.2. Dimethylnitrosamine calibration curve.
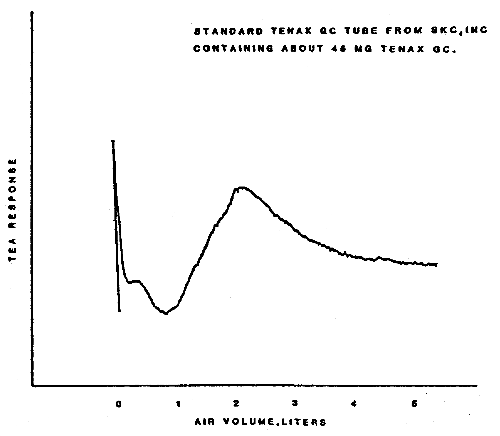
Figure 4.3.1. The rate at which dimethylnitrosamine is
desorbed from Tenax GC by air at ambient relative humidity and
temperature. 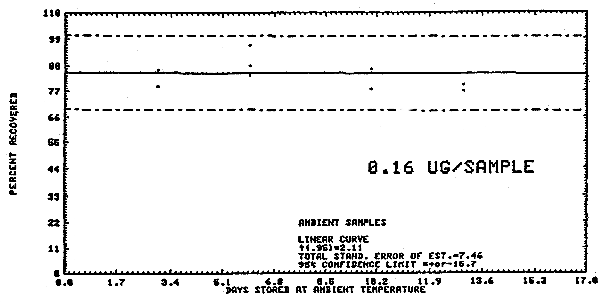
Figure 4.3.2. Ambient temperature dimethylnitrosamine
storage test. 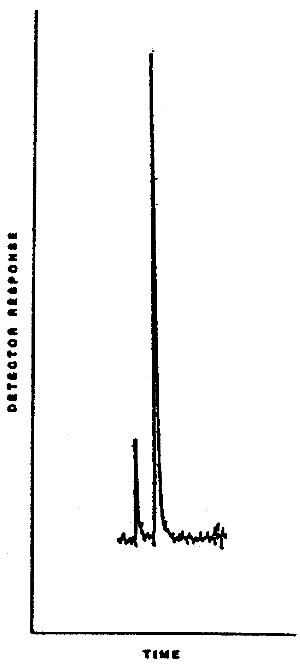
Figure 4.6. Typical chromatogram for
dimethylnitrosamine.
5. References
5.1. D.H. Fine, F.P. Roundbehler, E.D. Pellizzari, J.E. Bunch, R.W.
Berkley, J. McCrae, J.T. Bursey, E. Sawicki, K. Krost and G.A.
DeMarrais,
5.2. D.H. Fine, D.P. Roundbehler, E. Sawicki, and K. Krost,
Determination of Dimethylnitrosamine in Air by Thermal Energy
Analysis: Validation of Analytical Procedures, Environmental
Science and Technology, 11(6),
5.3. E.D. Pellizzari, J.E. Bunch, J.T. Bursey, and R.E. Berkley,
Estimation of N-Nitrosodimethylamine Levels in Ambient Air by
Capillary Gas-Liquid Chromatography/Mass Spectrometry, Analytical
Letters, 9(6),
5.4. D.H. Fine, Analysis of N-Nitroso Compounds Using the Thermal
Energy Analyzer, Submitted to: International Agency for Research on
Cancer (IARC), Manual of Methods for Environmental Carcinogens, Volume
on
5.5. R.W. Fisher, R.W. Reiser, and B.A. Lasoski, Determination of
5.6. D.H. Fine, D.P. Roundbehler, and N.P. Sen, A Comparison of
Some Chromatographic Detectors for the Analysis of Volatile
5.7. P. Issenberg and H. Sornson, A Monitoring Method for Volatile Nitrosamine Levels in Laboratory Atmospheres, Environmental N-Nitroso Compounds Analysis and Formation, E.A. Walker and P. Bogovski, Eds., Lyon, France; IARC scientific Publication No. 14, (1976).
5.8. W. Fiddler, R.C. Doerr, J.R. Ertel, and A.E. Wasserman,
5.9. D.H. Fine, P. Lieb, and F. Rufeh, Principle of Operation of
the Thermal Energy Analyzer for the Trace Analysis of Volatile and
Non-Volatile N-Nitroso Compounds, Journal of Chromatography,
107,
5.10. "Registry of Toxic Effects of Chemical Substances", 1976 Edition (H.E. Christensen, E.J. Fairchild, Eds., B.S. Carroll, R.J. Lewis, project Coordinators) U.S. Department of Health, Education, and Welfare Public Health Service, Center for Disease Control, National Institute for Occupational Safety and Health, U.S. Government Printing Office, Washington, D.C. (1976).
5.11. P.N. Magee, and J.M. Barnes, Carcinogenic Nitroso Compounds,
Advances in Cancer Research, 10,
5.12. P.N. Magee, Toxicity of Nitrosamines: Their Possible Human
Health Hazards, Fd. Cosmet. Toxicol., Great Britain, 9,
5.13. J. March, Advanced Organic Chemistry: Reactions, Mechanisms, and Structure, McGrawHill Book Company, New York, 486 (1968).
5.14. J.N. Pitts, P. Grosjean, K.V. Cauwenberght, J.P. Schmid, and
D.R. Fitz, Photooxidation of Aliphatic Amines under simulated
Atmospheric Conditions: Formation of Nitrosamines, Nitramines, Amides
and Photochemical Oxidant, Environmental Science and
Technology, 12(8),
5.15. D. Shapley, Nitrosamines: Scientists on the Trail of Prime Suspect in urban Cancer, Science, 191, 268 (1976).
5.16. Criteria Document: Recommendations for Occupational Exposure
standards for the Oxides on Nitrogen (Nitrogen Dioxide and Nitric
Oxide), U.S. Department of Health, Education, and Welfare, Public
Health Service, Center for Disease Control, National Institute for
Occupational Safety and Health, U.S. Government Printing Office,
Washington, D.C.,
5.17. B. Spiegelhalder, G. Eisenbrand, and R. Preussmann,
Contamination of Amines with
5.18. IARC Monographs on the Evaluation of Carcinogenic Risk of Chemicals to Man, Vol. 1, International Agency for Research on Cancer, Lyon, France, World Health Organization, 95106 (1971).
5.19. W. Lijinsky, S.S. Epstein, Nitrosamines As Environmental
Carcinogens, Nature, (London), 225,
5.20. Carcinogens-Regulation and Control, U.S. Department of Health, Education, and Welfare, Public Health Service, Center for Disease Control, National Institute for Occupational safety and Health, U.S. Government Printing Office, Washington, D.C., 46 (1977).