PICLORAM
| Method number: | PV2049 |
| Matrix: | Air |
| Target Concentration: | 10 mg/m3 total dust 5 mg/m3 respirable dust |
| Tested Concentration: | 5 mg/m3 with a sampling rate of 1.0 L/min |
| Procedure: | Samples are collected by drawing known volumes of air through glass fiber filters. The filters are extracted with methanol and analyzed by high performance liquid chromatography (HPLC) using an ultraviolet detector (UV). |
| Recommended air volume and sampling rate: |
60 L at 1.0 L/min |
| Detection limit of the overall procedure (based on the recommended air volume and the analytical detection limit): |
0.073 mg/m3 |
| Status of method: | Stopgap method. This method has been partially evaluated and is presented for information and trial use only. |
| Date: July 1990 (final draft) | Chemist: Duane Lee |
Carcinogen And Pesticide Branch
OSHA Analytical
Laboratory
Salt Lake City, Utah
1. General Discussion
- 1.1. Background
- 1.1.1. History of procedure
This evaluation was undertaken because OSHA recently adopted the picloram TLV as a PEL. Glass fiber filters were tested as an effective sampling device for picloram. The analytical procedure is similar to one used for the extraction of picloram from aqueous samples. (Ref. 5.1.)
1.1.2. Toxic effects (This section is for information only and should not be taken as the basis of OSHA policy.)
The oral LD50 is 3.75, 1.5 and 2.0 g/kg in rats, mice and rabbits respectively. Also it was concluded that picloram is not carcinogenic. (Ref. 5.2.)
1.1.3. Potential workplace exposure
Picloram is used as a herbicide and defoliant. No information was available on the number of workers that may be exposed to picloram.
1.1.4. Physical properties (Ref. 5.2. to 5.4.)
| CAS number: | 1918-02-1 |
| IMIS number: | 2017 (total dust) P158 (respirable fraction) |
| Molecular weight: | 241.48 |
| Molecular formula: | C6H3Cl3N2O2 |
| Melting point: | 215°C decomposes |
| Vapor pressure: | 8.21 × 10⁻⁵ Pa (6.16×10⁻⁷ mm Hg) at 35°C |
| Solubility: | Soluble in water, acetone, 2-propanol, dichloroethane, and kerosene |
| Chemical name: | |
| Synonyms: | Amdon; Amdon grazon;
|
| Description: | white powder |
| UV Scan: | Figure 1. |
| Structure: | 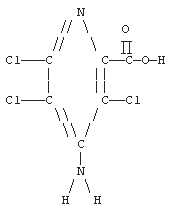 |
1.2. Limit defining parameters
The detection limit of the analytical procedure is 8.8 ng per injection. This is the amount of analyte which will give a peak whose height is approximately five times the baseline noise. (Figure 2.)
2. Sampling Procedure
- 2.1. Apparatus
- 2.1.1. A personal sampling pump that can be calibrated to within
±5% of the recommended flow rate with the sampling device in line.
2.1.2. Glass fiber filters, 37-mm diameter, Gelman Type A or equivalent.
2.1.3. Cassette filter holders for 37-mm filters, Millipore M000037A0 or equivalent.
2.2. Reagents
No sampling reagents are required.
2.3. Sampling technique
- 2.3.1. Immediately before sampling, remove the plastic plugs
from the cassette.
2.3.2. Attach the cassette to the sampling pump with flexible tubing.
2.3.3. Attach the cassette vertically in the employee's breathing zone in such a manner that it does not impede work performance.
2.3.4. After sampling for the appropriate time, remove the cassette and seal with plastic plugs.
2.3.5. Wrap each sample end-to-end with an OSHA seal (Form 21).
2.3.6. Record the air volume for each sample, and list any possible interferences.
2.3.7. Submit at least one blank for each set of samples. Handle the blank in the same manner as the samples, except no air is drawn through it.
2.3.8. Submit bulk samples for analysis in a separate container. Do not ship with air samples.
2.4. Extraction efficiency
Twenty-four glass fiber filters were each liquid spiked with 17 µL of a 18.592 mg/mL solution of picloram. These samples were allowed to dry at ambient temperature for an hour. Then six samples were each desorbed with 5.0 mL of methanol, shaken for 30 min and analyzed as in Section 3. The results are listed in Table 2.4.
Extraction Efficiency
| Amount | Amount | % | |
| Sample # | Spiked, µg | Found, µg | Recovered |
| Ex1 Ex2 Ex3 Ex4 Ex5 Ex6 |
316.1 316.1 316.1 316.1 316.1 316.1 |
328.3 319.0 317.9 318.8 316.6 316.8 |
103.9 100.9 100.6 100.9 100.2 100.2 |
| Average = 101.1 | |||
2.5. Retention efficiency
The remaining eighteen spiked glass fiber filters from section 2.4. were placed on a humid air generator and 60 L of humid air (~76% relative humidity) were drawn through each filter at 1 L/min. Six of the filters were each desorbed with 5.0 mL of methanol, shaken for 30 min and then analyzed as in Section 3. The results are listed in Table 2.5. The remaining samples were stored, 6 in a drawer at ambient temperature and 6 in a freezer, for use in a storage study below.
Retention Efficiency
| Amount | Amount | % | |
| Sample # | Spiked, µg | Found, µg | Recovered |
| R1 R2 R3 R4 R5 R6 |
316.1 316.1 316.1 316.1 316.1 316.1 |
318.4 319.0 319.6 316.2 318.6 319.8 |
100.7 100.9 101.1 100.0 100.8 101.2 |
| Average = 100.8 | |||
2.6. Sample storage
After 3 days of storage, 6 samples were each desorbed with 5.0 mL of methanol, shaken for 30 min and then analyzed as in Section 3. Three of the samples were from ambient storage and the other three were from the freezer storage samples. The remaining samples were analyzed after 9 days of storage. The results are given in Tables 2.6.1. and 2.6.2.
Ambient Storage
| Days | Amount | Amount | % |
| Stored | Spiked, µg | Found, µg | Recovered |
| 3 3 3 9 9 9 |
316.1 316.1 316.1 316.1 316.1 316.1 |
318.0 315.6 313.5 305.5 309.2 321.7 |
100.6 99.8 99.2 96.6 97.8 101.8 |
| Average of three days = 99.9 | |||
| Average of nine days = 98.7 | |||
Freezer Storage
| Days | Amount | Amount | % |
| Stored | Spiked, µg | Found, µg | Recovered |
| 3 3 3 9 9 9 |
316.1 316.1 316.1 316.1 316.1 316.1 |
317.5 328.1 319.7 311.5 318.4 306.6 |
100.4 103.8 101.1 98.5 100.7 97.0 |
| Average of three days = 101.8 | |||
| Average of nine days = 98.7 | |||
2.7. Recommended air volume and sampling rate
- 2.7.1. The recommended air volume is 60 L.
2.7.2. The recommended flow rate is 1.0 L/min.
2.8. Interferences (sampling)
It is not known if any compounds will interfere with the collection of picloram. Any suspected interferences should be reported to the laboratory.
2.9. Safety precautions (sampling)
- 2.9.1. Attach the sampling equipment in such a manner that it
will not interfere with work performance or employee safety.
2.9.2. Follow all safety practices that apply to the work area being sampled.
3. Analytical Procedure
- 3.1. Apparatus
- 3.1.1. A balance capable of weighing to the nearest tenth of a
milligram. A Mettler HL52 balance was used in this evaluation.
3.1.2. A mechanical shaker.
3.1.3. An HPLC equipped with a UV detector. A Hewlett Packard (HP) 1090M equipped with an autosampler and diode array detector was used in this evaluation.
3.1.4. An HPLC column capable of separating picloram from any interferences. A 25 cm × 4.6 mm i.d. ASI Chromoshpere ODS (5 µm) liquid chromatography column was used in this evaluation.
3.1.5. An electronic integrator, or some other suitable means for measuring detector response. The Hewlett-Packard 1090M Data System was used in this evaluation.
3.1.6. Volumetric flasks and pipets.
3.1.7. Vials, 2-mL and 20-mL.
3.2. Reagents
- 3.2.1. Methanol, HPLC grade. This was obtained from Burdick and
Jackson for this evaluation.
3.2.2. Picloram, reagent grade. A standard obtained from EPA (EPA # 5600, 99.6% purity) was used in this evaluation.
3.2.3. Water, HPLC grade, Milli-Q filtered water, Millipore Inc.
3.2.4. Acetonitrile, HPLC grade. This was obtained from Burdick and Jackson for this evaluation.
3.3. Standard preparation
Prepare picloram stock standards by weighing 10 to 15 mg of picloram. Transfer the picloram to separate 10-mL volumetric flasks, and add methanol to the mark. Make working range standards of 2.0 to 185 µg/mL by diluting the stock standards with methanol. Store stock and diluted standards in a freezer.
3.4. Sample preparation
- 3.4.1. Transfer the glass fiber filter to a 20-mL vial.
3.4.2. Add 5.0 mL of methanol to each vial and seal with a Teflon-lined cap.
3.4.3. Shake the vials for 30 minutes on a mechanical shaker.
3.4.4. If necessary, transfer the samples to 2-mL vials for use on an HP autosampler.
3.5. Analysis
- 3.5.1. Instrument conditions
| Column: | 25 cm × 4.6 mm ASI Chromosphere ODS (5 µm) |
| Mobile phase: | 20% acetonitrile 80% water |
| Flow rate: | 1.0 mL/min |
| Wavelength: | 224 nm |
| Retention time: | 5.6 min |
| Injection volume: | 10.0 µL |
3.5.2. Chromatogram (Figure 3.)
3.6. Interferences (analytical)
- 3.6.1. Any collected compound having a similar retention time to
that of the analyte is a potential interference.
3.6.2. HPLC conditions may generally be varied to circumvent interferences.
3.6.3. Retention time on a single column is not proof of chemical identity. Analysis on an alternate HPLC column and confirmation by mass spectrometry are additional means of identification.
3.7. Calculations
- 3.7.1. Construct a calibration curve (Figure 4.) by plotting
detector response versus concentration (µg/mL) of picloram.
3.7.2. Determine the µg/mL of picloram in each sample and blank from the calibration curve.
3.7.3. Blank correct each sample by subtracting the µg/mL found in the blank from the µg/mL found in the sample.
3.7.4. Determine the air concentration by using the following formula.
| mg/m3 = | (µg/mL, blank corrected) ×
(desorption volume, mL)
(air volume, L) × (desorption efficiency, decimal) |
3.8. Safety precautions (analytical)
- 3.8.1. Avoid skin contact and air exposure to picloram.
3.8.2. Avoid skin contact with all solvents.
3.8.3. Wear safety glasses at all times.
4. Recommendation for Further Study
This method should be fully validated.
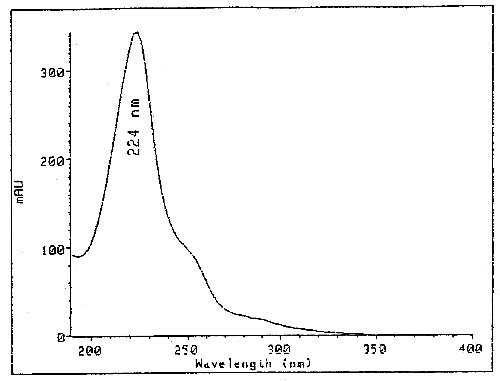
UV Scan of Picloram in Mobile Phase
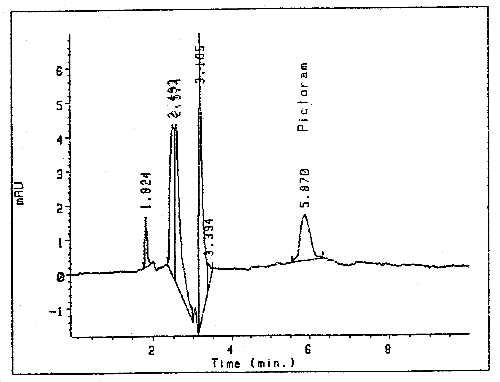
Detection Limit Chromatogram of Picloram
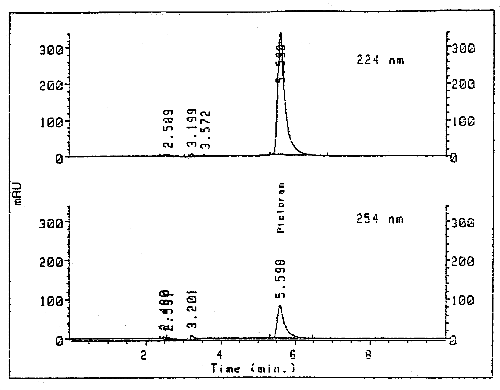
Chromatogram of Picloram
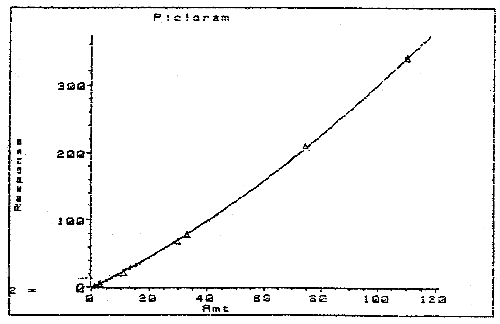
Calibration Curve
5. References
- 5.1. Wells, Martha J. M. and Michael, Jerry L.; Anal. Chem;
1987, 59,
5.2. Merck Index, 10th ed.; Windholz, Martha Ed.; Merck:
Rahway, NJ, 1983; pp
5.3. Documentation of Threshold Limit Values and Biological Exposure Indices; American Conference of Governmental Industrial Hygienists Inc., Fifth Edition, 1986, p 489.
5.4. Registry of Toxic Effects of Chemical Substances 1985-86 Edition; DHHS(NIOSH) Publication No. 87-114, U.S. Department of Health and Human Services: Cincinnati, OH, 1987; p 3475.
5.5. Farm Chemicals Handbook; Berg, Gordon L. Ed.; Meister: Willoughby, OH, 1989; pp C228-C229.