1. General Discussion
1.1 Background
1.1.1 History
With the
application of phosphine in the manufacturing of semiconductors, the
monitoring of workplace phosphine becomes more important than before.
Phosphine has been analyzed by directly injecting sampled air onto a
GC column. Both NPD1
and FPD2
have been used for detection. Wang et al. used gas sampling bags made
of aluminum and polyester.3
The
NIOSH method uses sampling tubes containing mercuric cyanide-coated
silica gel. Samples are oxidized with acidic permanganate and analyzed
by colorimetry.4
OSHA Method ID-180
for sampling workplace phosphine uses carbon bead coated with
potassium hydroxide.5
The analysis is based on the oxidation of the collected phosphine with
hydrogen peroxide, and the determination of the resulting phosphite
and phosphate by ion chromatography, but the method suffers from low
recoveries.
Greenfield et al. determined phosphine by passing
air through a solution of mercuric chloride. Hydrogen chloride is
liberated, causing a rise in conductance, proportional to the amount
of phosphine absorbed.6
They proposed the following reaction between phosphine and mercuric
chloride:7
PH3 +
3HgCl2  P(HgCl)
+ 3HCl P(HgCl)
+ 3HCl |
Matsumura and
co-workers coated silica gel with mercuric chloride and used it to
sample phosphine.8
Samples are oxidized with acidic permanganate and analyzed by
colorimetry. The sampling capacity was 3 L with 0.3 ppm phosphine
sampled at 0.3 L/min. The lower limit of quantitation was 0.054 ppm.
The sampling time of 10 minutes is not suitable for TWA sampling, and
the colorimetric determinations are cumbersome.
ICP-AES has
been applied in the analysis of phosphorus. Hamalova and
co-workers determined the phosphorus content of
fertilizers using ICP-AES9.
Ardis and Baker monitored the fertilizer plant effluents for
phosphorus using ICP-AES10.
Mortensen and co-workers collected phosphine in an impinger containing
acidic permanganate solution and analyzed by ICP-AES.11
In
the present method a mercuric chloride-treated polyester filter is
used to capture phosphine and ICP-AES is used to analyze
for the total phosphorus. A glass fiber filter is placed upstream to
remove any phosphorus-containing particulate and aerosol.
1.1.2
Toxic effects (This section is for information only and should not be
taken as the basis of OSHA policy.)
Phosphine is toxic by
inhalation, but its effects are not completely understood. The chief
effects are central nervous system depression and lung irritation.
There may be pulmonarym edema, dilation of the heart, and hyperemia of
the visceral organs. Inhalation can cause coma and convulsions leading
to death within 48 hours. However, most cases recover without
after-effects. Chronic poisoning, characterized by anemia, bronchitis,
gastrointestinal disturbances and visual, speech and motor
disturbances, may result from continued exposure to very low
concentrations.12
1.1.3
Workplace exposure
Two main uses for phosphine are in the
preparation of semiconductors and as a fumigant.13
Phosphine is commonly used in the electronics industry as an
n-type dopant for silicon semiconductors, and to a lesser
extent for the preparation of gallium-indium-phosphide
devices. Phosphine generated in situ by the
reaction of atmospheric moisture with pelletized calcium, aluminum, or
magnesium phosphide is used as a fumigant in, for example, grain
silos. Other uses of phosphine are as: polymerization initiator;
condensation catalyst; chemical intermediate for phosphonium halides.
Phosphine was not listed in either 1982 or 1972 NIOSH National
Occupational Exposure Survey.14
In the state of California for the period 1982-1992,
there were reported 205 cases associated with exposure to
phosphine/phosphides.15
1.1.4
Physical properties and descriptive information16
| CAS number: |
7803-51-2 |
| synonyms: |
hydrogen phosphide; phosphorus
trihydride |
| |
| molecular formula: |
PH3 |
| molecular weight: |
34.00 |
| boiling point: |
-87.7°C |
| melting point: |
-133.8°C |
| vapor pressure: |
3.14 × 10⁴ mmHg at 20°C |
| odor: |
of decaying fish; of garlic |
| auto-ignition temperature: |
38°C (pure). Ignites readily at room
temperature when other hydrides of phosphorus are present as
impurities. Combines violently with oxygen and the
halogens. |
| solubility: |
soluble in ethyl alcohol and ether; slightly
soluble in water (26mL in 100 mL at 17°C). |
| OSHA IMIS number: |
208017 |
This method was evaluated in part according to the
OSHA SLTC "EVALUATION GUIDELINES FOR AIR SAMPLING METHODS UTILIZING
CHROMATOGRAPHIC ANALYSIS"18
and in part according to the Inorganic Method Development Guidelines19.
The Guidelines define analytical parameters, specify required laboratory
tests, statistical calculations and acceptance criteria. The analyte air
concentrations throughout this method are based on the recommended
sampling and analytical parameters. Air concentrations listed in ppm are
referenced to 25°C and 101.3 kPa (760 mmHg).
1.2 Limit defining parameters
1.2.1 Detection limit of the
analytical procedure
The detection limit of the analytical
procedure is 0.088 µg/mL phosphorus. This is the concentration of
phosphorus that will give a detector response that is significantly
different from the response of a reagent blank. (Section
4.1)
1.2.2 Detection limit of the overall
procedure
The detection limit of the overall procedure is 2.9
µg phosphorus per sample (10 ppb phosphine or 13 µg/m3).
This is the amount of phosphorus spiked on the sampler that will give
detector response that is significantly different from the response of
a sampler blank. (Section
4.2)
1.2.3 Reliable quantitation limit
The reliable
quantitation limit is 9.8 µg phosphorus per sample (32 ppb phosphine
or 45 µg/m3). This is the amount of phosphorus spiked on
the sampler that will give detector response that is considered the
lower limit for precise quantitative measurements. (Section
4.2)
1.2.4 Instrument calibration
The standard error
of estimate is 0.041 µg/mL phosphorus over the range of 1.0 to 8.0
µg/mL. This range corresponds to 0.25 to 2 times the target
concentration. (Section
4.3)
1.2.5 Precision
The precision of the overall
procedure at the 95% confidence level for the ambient temperature
17-day storage test (at the target concentration) from
mercuric chloride-treated filters is ±10.8%. This
includes an additional 5% for sampling pump variability. (Section
4.4)
1.2.6 Recovery
The recovery of phosphine from
samples used in a 17-day storage test remained above 94.8% when the
samples were stored at ambient temperature. (Section
4.5)
1.2.7 Reproducibility
Six samples collected
from a controlled test atmosphere were submitted for analysis by the
OSHA Salt Lake Technical Center. The samples were analyzed according
to a draft copy of this procedure after 38 days of storage at ambient
temperature. No individual sample result deviated from its theoretical
value by more than the precision reported in Section 1.2.5. (Section
4.6) 2. Sampling
Procedure
All safety practices that apply to the work area being
sampled should be followed. The sampling equipment should be attached to
the worker in a manner that will not interfere with work performance or
safety.
2.1 Apparatus
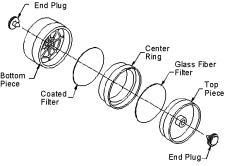 Samples are collected with 37-mm filter
cassettes containing a glass fiber filter and a mercuric
chloride-treated filter.20 Samples are collected with 37-mm filter
cassettes containing a glass fiber filter and a mercuric
chloride-treated filter.20
Samples
are collected using a personal sampling pump calibrated, with the
sampling device attached, to within ±5% of the recommended flow
rate.
2.2 Reagents
None required.
2.3
Technique
Remove the two end plugs from the
cassette.
Attach the cassette to the sampling pump. Position the
sampling pump, cassette and tubing so they do not impede work
performance or safety.
Draw the air to be sampled directly into
the inlet of the cassette. For personal sampling, the air being sampled
is not to be passed through any hose or tubing before entering the
sampling cassette.
After sampling for the appropriate time,
remove the cassette and replace the two end plugs. Seal each sample
end-to-end with an OSHA-21 form.
Submit
at least one blank sample with each set of samples. Handle the blank
sampler in the same manner as the other samples except draw no air
through it.
Record sample air volume (liters), sampling time
(minutes) and sampling rate (L/min) for each sample, along with any
potential interferences on the OSHA-91A form.
Submit
the samples to the laboratory for analysis as soon as possible after
sampling.
2.4 Sampler capacity (Section
4.7)
The sampling capacity was tested by sampling a
dynamically generated test atmosphere of phosphine at 3.8 times the
target concentration (46.8 nmol/L, 1.59 mg/m3 or 1.34 ppm) at
an absolute humidity of 16.3 milligrams of water per liter of air (74.9%
relative humidity at 24°C). The samples were collected at 1.0 L/min. The
5% breakthrough sampling time was determined to be 335 min. The 5%
breakthrough was not reached in 6 hours when tested at two times the
target concentration. When tested at 113.4 nmol/L (2.8 times the ACGIH
STEL) and at a flow rate of 2.0 L/min, the 5% breakthrough sampling time
was determined to be 40 min.
2.5 Recommended sampling time and
sampling rate
Sample for up to 240 min at 1.0 L/min (240 L) to
collect TWA (long-term) samples.
Sample for 15 min at 2.0 L/min
(30 L) to collect short-term samples.
When short-term samples are
collected, the air concentration equivalent to the reliable quantitation
limit becomes larger. For example, the reliable quantitation limit is
0.36 mg/m3 (10.5 nmol/L, 0.26 ppm) when 30 L are
collected.
2.6 Interferences, sampling (Section
4.8)
The collection efficiency was above 94.6% when mercuric
chloride-treated filters were used to sample a test atmosphere
containing the target concentration of phosphine and having an absolute
humidity of 4.6 milligrams of water per liter of air (22.2% relative
humidity at 23.3°C).
The collection efficiency was above 75.0%
when mercuric chloride-treated filters were used to sample a test
atmosphere containing 0.08 times the target concentration of phosphine
and having an absolute humidity of 15.6 milligrams of water per liter of
air (64.1% relative humidity at 26.0°C).
The collection
efficiency was above 99.6% when the samplers, whose front glass fiber
filter had been spiked with 2.4 mg of ammonium phosphate dibasic,21
were used to sample a test atmosphere containing one times the target
concentration of phosphine and having an absolute humidity of 15.5
milligrams of water per liter of air (70.9% relative humidity at
24.1°C). The average collection efficiency was 101.1% for the control
samples.
The collection efficiency was above 96.7% when the
samplers, whose front glass fiber filter had been spiked with 0.214 mg
of DDVP,21
were used to sample a test atmosphere containing one times the target
concentration of phosphine and having an absolute humidity of 15.5
milligrams of water per liter of air (70.9% relative humidity at
24.1°C). The average collection efficiency was 101.1% for the control
samples. 3. Analytical
Procedure
Adhere to the rules set down in your Chemical Hygiene
Plan22.
Avoid skin contact and inhalation of all chemicals. Review appropriate
MSDSs before beginning work.
3.1 Equipment
3.1.1 Inductively coupled
plasma-atomic emission spectrometer (ICP-AES). A Perkin-Elmer Optima
3000 DV, with its accessories including auto-sampler, peristaltic
pumps, and mass flow controller, was used in this evaluation. The
software controls the instrument and provides the analytical
results.
3.1.2 Borosilicate glass Phillips beakers,
125-mL.
3.1.3 Borosilicate glass volumetric flasks,
25-mL.
3.1.4 Hot plate. 3.2 Reagents
3.2.1 Sulfuric acid, reagent grade.
Sulfuric acid, 96.5%, purchased from JT Baker was used (Lot
15055).
3.2.2 Hydrogen peroxide, 30%. Hydrogen peroxide, 30%,
was purchased from Mallinckrodt.
3.2.3 deionized
water.
3.2.4 Phosphorus standard, 1000 µg/mL. Single element
phosphorus standard, 1000 µg/mL, was purchased from SPEX Industries
(Edison, NJ) and from CPI International (Santa Rosa,
CA).
3.2.5. Nitric acid. 3.3 Standard preparation
3.3.1 Working standard, 10 µg/mL
phosphorus (10 ppm P). Pipet 1.00 mL of 1000 µg/mL phosphorus stock
solution into a 100-mL volumetric flask. Add about 50 mL
of deionized water. Add 8 mL of concentrated sulfuric acid. Allow the
solution to cool. Add deionized water to the mark.
3.3.2
Prepare a reagent blank in a 100-mL volumetric flask by adding 8 mL of
sulfuric acid to about 50 mL of deionized water, allowing it to cool,
and adding deionized water to the mark. 3.4 Sample preparation
Caution: Mercuric chloride is a "violent poison" and
"slightly volatile at ordinary temperature"23.
It has a vapor pressure of 13 Pa (0.1 torr) at 100°C.24
Handle samples in a hood.
Clean the insides of the 125-mL
Phillips beakers by refluxing 1:1 nitric acid using a hot plate in a
ventilated hood. Carefully pour the used 1:1 nitric acid into an
appropriate labeled container. Allow the beakers to cool, then rinse
several times with deionized water. Using a forceps, place sample
filters in separate labeled and washed Phillips beakers. Discard the
glass fiber filter.
Add 2 mL of concentrated sulfuric acid to
each beaker.
Heat the beakers on a hot plate for approximately 10
minutes. The solutions should become dark and then light
brown.
Add a few drops of 30% hydrogen peroxide until each
solution becomes colorless. Remove the beakers from the hot plate and
allow to cool.
Quantitatively transfer the solutions into 25-mL
volumetric flasks using deionized water. Add deionized water to the
mark.
3.5 Analysis
| Follow the standard operating procedure for
ICP-AES. There are four available wavelengths for phosphorus
determination: 178.221, 177.433, 213.616, and 214.918 nm. The
wavelength of 178.221 nm was used in this evaluation. The results
from the other three wavelengths are useful for confirmation.
Calibrate with the 10 µg/mL phosphorus standard and the reagent
blank. The instrument software allows for taking a specified
number of readings and calculating the averages. |
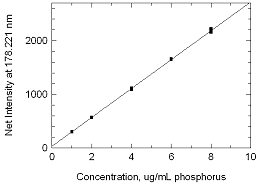
Figure 3.5
Calibration curve of phosphorus. (Y = 268.9X +
31.95) |
ICP operating
parameters:
| number of replicates: |
2 |
| integration times: |
minimum: 5.00 sec
maximum:
20.00 sec |
| plasma flow: |
15 L/min |
| auxiliary plasma flow: |
0.5 L/min |
| nebulizer gas flow: |
0.60 L/min |
| power: |
1450 watts |
| viewing height: |
15 mm |
| plasma view: |
radial | For the calibration curve presented in Figure 3.5, three
readings were taken and the individual data points were
plotted.
3.6 Interferences (analytical)
Copper and iron,
when present in large amounts, may interfere with phosphorus detection
at 213.616 and 214.914 nm. The ICP software allows for the correction of
spectral interferences. Consult the instrument manual for
inter-element corrections.
3.7
Calculations
The concentration of phosphorus for the sample is
obtained from the appropriate calibration curve in terms of micrograms
phosphorus per milliliter. This concentration is then corrected by
subtracting the concentration of the blank. The air concentration is
calculated using the following formulas.
| CM = |
(Cp)(Vd)(34.00)
(V)(30.97) | |
| where: |
CM |
is concentration by weight
(mg/m3) |
| Cp |
is micrograms phosphorus per
milliliter |
| V |
is liters of air sampled |
| Vd |
is the final volume (mL) to which the
sample is diluted |
| 34.00 |
is the molecular weight of phosphine
(g/mol) |
| 30.97 |
is the atomic weight of phosphorus
(g/mol) | |
| |
|
|
| where: |
CV |
is concentration by volume (ppm) |
| 24.46 |
is molar volume at 25°C (L/mol) |
| CM |
is concentration by weight
(mg/m3) |
| 34.00 |
is the molecular weight of phosphine
(g/mol) | | 4. Backup Data
General background information about
the determination of detection limits and precision of the overall
procedure is found in the "Evaluation Guidelines for Air Sampling Methods
Utilizing Chromatographic Analysis"25.
The Guidelines define analytical parameters, specific laboratory tests,
statistical calculations and acceptance criteria.
4.1 Detection limit of
the analytical procedure (DLAP)
A 10 µg/mL phosphorus standard
and a reagent blank were analyzed ten times and the data obtained were
used to determine the DLAP according to the following formula.26
At 178.221 nm, ] the 10 µg/mL standard gave an average intensity of
2717.8. The reagent blank gave an average intensity of 25.8 and a
standard deviation of 7.87. DLAP was calculated to be 0.088 µg/mL
phosphorus.
| where: |
DL |
is detection limit |
| k |
is a constant, equals 3 |
| Sdblk |
is the standard deviation of the reagent
blank |
| Cstd |
is the concentration of the standard |
| Istd |
is the intensity of the standard |
| Iblk |
is the intensity of the
blank |
| DL = |
k(Sdblk)(Cstd)
(Istd - Iblk) |
4.2 Detection limit of the overall
procedure (DLOP) and reliable quantitation limit (RQL)
The DLOP
is measured as mass per sample and expressed as equivalent air
concentrations, based on the recommended sampling parameters. Ten
samplers were spiked with equal descending increments of phosphorus,
such that the highest sampler loading was 20 µg/sample. This is the
amount spiked on a sampler that would produce a peak approximately 10
times the response of a sample blank. These spiked samplers and the
sample blank were analyzed with the recommended analytical parameters,
and the data obtained used to calculate the required parameters
(standard error of estimate and the slope) for the calculation of the
DLOP. Values of 10.55 and 10.34 were obtained for the slope and standard
error of estimate respectively. The DLOP was calculated to be 2.94 µg
phosphorus per sample (9.67 ppb phosphine, 13.4
µg/m3).
Table 4.2
Detection Limit of the
overall procedure
|
Mass per sample
µg phosphorus |
Intensity at
178.221 nm |
|
| 0 |
34.1 |
| 2 |
69.8 |
| 4 |
102.3 |
| 6 |
109.5 |
| 8 |
111.5 |
| 10 |
144.1 |
| 12 |
167.8 |
| 14 |
187.2 |
| 16 |
209.3 |
| 18 |
248.1 |
| 20 |
249.3 |
| |
|
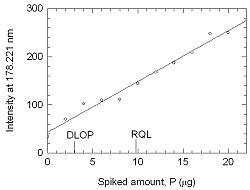
Figure 4.2 Plot of
data to determine the DLOP/rql.(Y = 10.55X +
42.91) |
The RQL
is considered the lower limit for precise quantitative measurements. It
is determined from the regression line parameters obtained for the
calculation of the DLOP, providing 75% to 125% of the analyte is
recovered. The RQL is 9.80 µg phosphorus per sample (1.32 nmol/L, 32.2
ppb phosphine, 44.8 µg/m3) Recovery at this concentration is
95.9%.
4.3 Instrument calibration
The standard error of
estimate was determined from the linear regression of data points from
standards over a range that covers 0.25 to 2 times the target
concentration. A calibration curve was constructed and shown in Section
3.5 from the three readings of five standards. A standard error of
estimate of 15.38 and a slope of 268.7 mL/µg were obtained for the
curve. The standard error of estimate of the calibration is calculated
to be 0.0572 µg/mL phosphorus.
Table 4.3.
Instrument Calibration
|
standard concn
(µg/mL P) |
net intensity
at 178.221 nm |
average |
|
| 1.00 |
303.5 |
305.4 |
298.4 |
302.4 |
| 2.00 |
570.6 |
567.9 |
568.7 |
569.0 |
| 4.00 |
1086.5 |
1104.3 |
1117.3 |
1102.7 |
| 6.00 |
1663.5 |
1646.6 |
1647.0 |
1652.4 |
| 8.00 |
2152.3 |
2173.6 |
2216.5 |
2180.8 |
|
4.4
Precision (overall procedure)
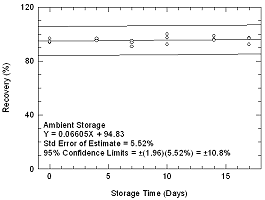
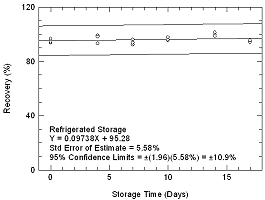
The precision at the 95% confidence
level is obtained by multiplying the standard error of estimate by 1.96
(the z-statistic from the standard normal distribution at
the 95% confidence level). In Section 4.5, 95% confidence intervals are
drawn about their respective regression lines in the storage graph
figures. The precision of the overall procedure of ±10.8% was obtained
from the standard error of estimate of 5.52% in Figure
4.5.1.
4.5 Storage test
Storage samples for phosphine
were prepared by collecting samples from a controlled test atmosphere
using the recommended sampling conditions. The concentration of
phosphine was at the target concentration with an absolute humidity of
14.8 milligrams of water per liter of air (86.3% at 19.9&176;C).27
Thirty-three storage samples were prepared. Three samples were analyzed
on the day of generation. Fifteen of the samples were stored at reduced
temperature (4°C) and the other fifteen were stored in a closed drawer
at ambient temperature (about 22°C). At 3-4 day intervals
three samples were selected from each of the two sets and
analyzed.
Table 4.5
Storage Test for
Phosphine
|
| time (days) |
ambient storage recovery (%) |
|
refrigerated storage recovery
(%) |
|
| 0 |
96.7 |
93.7 |
94.3 |
|
96.7 |
93.7 |
94.3 |
| 4 |
96.1 |
95.0 |
96.7 |
|
98.9 |
93.3 |
91.1 |
| 7 |
90.8 |
94.9 |
93.7 |
|
92.4 |
93.7 |
96.2 |
| 10 |
92.2 |
97.3 |
99.9 |
|
95.6 |
97.8 |
95.9 |
| 14 |
95.9 |
98.5 |
95.4 |
|
99.7 |
101.3 |
98.4 |
| 17 |
97.1 |
96.7 |
92.3 |
|
94.8 |
94.0 |
95.4 |
|
 |
 |
| |
Figure 4.5.1 Ambient storage tests for
phosphine |
|
Figure 4.5.2 Refrigerated storage
tests for phosphine |
4.6 Reproducibility
Six samples were collected from
a controlled test atmosphere similar to that which was used in the
collection of the storage samples. The samples were submitted to the
OSHA Salt Lake Technical Center for analysis. The samples were analyzed
after being stored for 38 days at ambient temperature. No sample result
for phosphine had a deviation greater than the precision of the overall
procedure determined in Section
4.4.
Table 4.6
Reproducibility Data for Phosphine
on Mercuric Chloride-Treated Filter
|
theoretical
concentration
(µg/L) |
recovered
amount
(µg/mL P) |
air volume
(L) |
concentration
(µg/L) |
recovery
(%) |
deviation
(%) |
|
| 0.4055 |
3.350 |
245.0 |
0.3753 |
92.6 |
-7.4 |
| 0.4055 |
3.339 |
242.9 |
0.3773 |
93.0 |
-7.0 |
| 0.4055 |
3.331 |
242.3 |
0.3773 |
93.0 |
-7.0 |
| 0.4055 |
3.247 |
241.7 |
0.3687 |
90.9 |
-9.1 |
| 0.4055 |
3.452 |
242.0 |
0.3915 |
96.5 |
-3.5 |
| 0.4055 |
3.403 |
245.0 |
0.3812 |
94.0 |
-6.0 |
|
4.7
Sampler capacity
The sampling capacity of the mercuric
chloride-treated filter was tested by sampling from a dynamically
generated test atmosphere of phosphine (46.8 nmol/L or 1.34 ppm at Salt
Lake City) with an absolute humidity of 16.3 milligrams of water per
liter of air (74.9% relative humidity at 24°C) using two samplers
connected in series. Three sets of samples were collected at 1.0 L/min.
At 30-minutes intervals the downstream sampler was replaced
with a fresh one. The 5% breakthrough was seen at 335 L of sampled air.
No breakthrough was seen in 6 hours when the test was conducted at 26.2
nmol/L (0.738 ppm at Salt Lake City). The recommended sampling time is 4
h.
When tested at 113.4 nmol/L (2.8 times the ACGIH STEL TLV) and
at a flow rate of 2.0 L/min, the 5% breakthrough time was found to be 40
min. The recommended short term sampling time and flow rate are 15 min
and 2.0 L/min.
Table 4.7.1
Breakthrough of Phosphine with
Mercuric Chloride-Treated Filter at 46.8 nmol/L and at 1
L/min
|
test
no. |
sampling time
(min) |
air vol
(L) |
downstream concn
(nmol/L) |
breakthrough
(%) |
|
| 1 |
0-130 |
65.6 |
0.80 |
1.7 |
| |
130-206 |
169.5 |
0.61 |
1.3 |
| |
206-240 |
225.0 |
0.05 |
0.1 |
| |
240-270 |
257.3 |
0.01 |
0.0 |
| |
270-302 |
288.6 |
0.15 |
0.3 |
| |
302-330 |
318.8 |
1.89 |
4.0 |
| |
330-360 |
348.1 |
4.27 |
9.1 |
| |
| 2 |
0-130 |
65.0 |
0.74 |
1.6 |
| |
130-206 |
168.0 |
Outlier |
- |
| |
206-240 |
223.0 |
1.39 |
3.0 |
| |
240-270 |
255.0 |
0.61 |
1.3 |
| |
270-302 |
286.0 |
1.62 |
3.4 |
| |
302-330 |
316.0 |
1.35 |
2.9 |
| |
330-360 |
345.0 |
2.97 |
6.3 |
| |
| 3 |
0-130 |
64.6 |
0.54 |
1.1 |
| |
130-206 |
166.9 |
0.50 |
1.1 |
| |
206-240 |
221.5 |
1.46 |
3.1 |
| |
240-270 |
253.3 |
0.62 |
1.3 |
| |
270-302 |
284.1 |
0.62 |
1.3 |
| |
302-330 |
313.9 |
1.50 |
3.2 |
| |
330-360 |
342.7 |
1.85 |
4.0 |
|
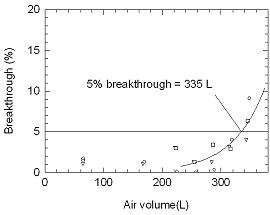
Figure 4.7.1 five percent breakthrough air volume for
phosphine at 46.8 nmol/L (3.8 times the target concentration) and
a flow rate of 1.0 L/min. |
Table 4.7.2
Breakthrough of Phosphine with
Mercuric Chloride-Treated Filters at 2 L/min and at 113.4
nmol/L (3.857 mg/m3)
|
test
no. |
sampling time
(min) |
air vol
(L) |
downstream concn
(nmol/L) |
breakthrough
(%) |
|
| 1 |
0 - 33 |
32.8 |
4.1 |
3.6 |
| |
33 - 69 |
101.3 |
14.3 |
12.6 |
| |
69 - 99 |
166.8 |
22.1 |
19.5 |
| |
99 -133 |
230.4 |
27.6 |
24.3 |
| |
| 2 |
0 - 33 |
33.0 |
0.3 |
0.2 |
| |
33 - 69 |
102.0 |
0.1 |
0.1 |
| |
69 - 99 |
168.0 |
12.8 |
11.3 |
| |
99 - 133 |
232.0 |
34.3 |
30.3 |
| |
| 3 |
0 - 33 |
33.1 |
1.4 |
1.3 |
|
33 - 69 |
102.2 |
3.3 |
2.9 |
| |
69 - 99 |
168.3 |
19.0 |
16.8 |
| |
99 -133 |
232.5 |
36.6 |
32.3 |
|
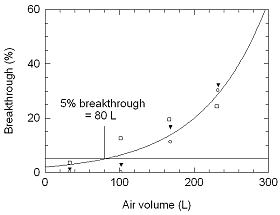
Figure 4.7.2 five
percent breakthrough air volume for phosphine at 113.4 nmol/L (2.8
times ACGIH STEL TLV) and a flow rate of 2.0
L/min. |
4.8 Interferences (sampling)
Low
humidity
The ability of the mercuric chloride-treated filter to
collect phosphine from a relatively dry atmosphere was tested by
sampling an atmosphere containing 12.2 nmol/L (one times the target
concentration) of phosphine at an absolute humidity of 4.6 milligrams of
water per liter of air (22.2% relative humidity at 23.3°C). Six samples
were collected from the test atmosphere at 1.0 L/min for 240 minutes.
All of the samples were immediately analyzed. The samples had collected
94.6%, 94.9%, 96.8%, 98.5%, 95.0%, and 103.3% of theoretical.
Low
concentration
The ability of the mercuric chloride-treated filter
to collect phosphine at low concentrations was tested by sampling an
atmosphere containing 1.31 nmol/L (0.11 1 times the target
concentration) of phosphine at an absolute humidity of 14.0 milligrams
of water per liter of air (63.8% relative humidity at 24.2°C). Six
samples were collected from the test atmosphere at 1.0 L/min for 240
min. The samples were immediately analyzed. The samples had collected
87.2%, 88.8%, 81.2%, 84.4%, 83.8%, and 82.4% of
theoretical.
Interference
The ability of a mercuric
chloride-treated filter coupled with the glass fiber filter to collect
phosphine was tested when other potential interferences are present.
Twelve samplers were used. The glass fiber filter of the three samplers
were spiked with 100 µL of 24 mg/mL ammonium phosphate dibasic. The
glass fiber filter of the next three samplers were spiked with 100 µL of
2.14 mg/mL DDVP in toluene. The remaining six samplers were used as
controls. They were used to sample an atmosphere containing 11.9 nmol/L
(0.97 times the target concentration) of phosphine at an absolute
humidity of 15.5 milligrams of water per liter of air (70.9% relative
humidity at 24.1°C) at 1.0 L/min for 240 minutes. All of the samples
were immediately analyzed. The samplers with ammonium phosphate on the
glass fiber filter had collected an average of 100.7% of theory. The
three samplers with DDVP on the glass fiber filter had collected an
average of 99.9% of theory. The six control samplers had collected an
average of 101.1% of theory.
Table 4.8.1
Interference Tests for
hosphine
|
interference, amount placed
on the front
filter |
recovery(%) |
average
recovery (%) |
|
ammonium phosphate,
dibasic, 2.4 mg |
101.2 |
99.6 |
101.4 |
100.7 |
| |
| DDV, 0.214 mg |
102.7 |
96.7 |
100.2 |
99.9 |
| |
| control |
93.3 |
105.7 |
103.1 |
101.1 |
| 102.1 |
100.4 |
102.1 |
|
Shelf life of the
coated filter
The shelf life of the mercuric chloride-treated
filter was tested by comparing the sampling recoveries of the
112-day-old filters with the 6-day-old ones.
Three samplers from each set were used to sample an atmosphere
containing 12.9 nmol/L (1.05 times the target concentration) of
phosphine at an absolute humidity of 15.1 mg of water per liter of air
(72.2% relative humidity at 23.3°C) at 1.0 L/min for 245 minutes. The
average recovery from the 112-day-old filters was 83.5%.
The average recovery from the 6-day-old filters was 93.4%.
The filter is good for three months.
Table 4.8.2
Comparison of Old and New
Filters
|
| age of filters |
recovery (%) |
average (%) |
|
| 112 days |
80.2 |
92.3 |
77.9 |
83.5 |
| 6 days |
94.3 |
94.5 |
91.3 |
93.4 |
|
1. Chughtai, M.; Pridham, P. N.;
Cooke, M. Determination of phosphine by packed column gas chromatography
with alkali flame ionization detection. Analytical
Communications, 1998, 35,
109-111.
2. Yang, G. and Dai, X. Huanjing Baohu (Beijin), 1994,
59(12), 21-22.
3. Wang, G.; Gao, Y.;
Jiang, X.; Xiah, Y. Determination of phosphine in air by
flame-photometric gas chromatography. Weisheng Yanjiu, 1994, 23(2),
65-67; Chem. Abstr., 121,
116336.
4. Phosphine, Method 6002, NIOSH Manual of
Analytical Methods, Fourth Edition. 1994.
5. Ku, J. Phosphine in
Workplace Atmospheres. OSHA Analytical Method,
ID-180, 1988, modified, 1991.
6. Greenfield, S.; Moule, H.
A.; Perry, R. The Conductimetric Determination of Microgram Amounts of
Phosphine in Air. Analyst, 1966, 9, 10-14.
7.
They proposed this reaction based on the amount of hydrogen chloride
generated. The precise nature of the phosphorus containing entity is not
certain.
8. Matsumura, Y.; Ono-Ogasawara, M.; Furuse,
M. Adsorption Sampling of Phosphine and Some Other Semiconductor Material
Gases. Appl. Occup. Environ. Hyg., 1993, 8(4), 288-292. Determination of
Phosphine by Adsorption Sampling with Modified Silica Gel and Colorimetry
of Phosphine. Industrial Health, 1990, 28, 175-184.
9.
Hamalova, M.; Hodslavska, J.; Janos, P. Determination of Phosphorus,
Potassium, and Magnesium in fertilizers by Inductively Coupled
Plasma-Atomic Emission Spectroscopy and Comparison with Other
Techniques. J. AOAC International, 1997, 80(6), 1151-1155.
10. Aardis., J. D.; Baker, A. M. Monitoring of Fertilizer
Plant Effluents for Phosphorus, Sulfur, and Metals Using Inductively
Coupled Plasma Emission Spectrometry. J. Assoc. Off.
Anal. Chem., 1989, 72(5),
857-859.
11. Mortensen, G.; Pedersen,
B.; Rietz, B. ICP-AES and colorimetry as analytical tools for the
determination of phosphorus containing compounds, including phosphine.
Analytical Letters, 1989, 22(7), 1791-1806.
12. Sax's Dangerous Properties of
Industrial Materials, 8th edition; Lewis, R. J., Ed.; Van Nostrand
Reinhold: New York, 1992. Vol. 3, p 2783.
13.
Rickelton, W. A. Phosphine and Its Derivatives, In Kirk
Othmer Encyclopedia of Chemical Technology, 4th edition;
Kroschwitz, J. I., Howe-Grant, M., Eds,; John Wiley & Sons: New York,
1996; Vol. 18, pp 656-668.
14. OSHA Regulated Hazardous Substances - Industrial Exposure and
Control Technologies, Government Institutes, Inc., Rockville, MD,
1990.
15. NIOSH Alert: Preventing
Phosphine Poisoning and Explosions during Fumigation; DHHS (NIOSH)
Publication No. 99-126; U.S. Department of Health and Human
Services, National Institute for Occupational Safety and Health;
Cincinnati, 1999, p 3.
16. Merck
Index, 10th Edition; Windholz, M. Ed.; Merck & Co.: Rahway, NJ,
1983.
17. OSHA Salt Lake Technical Center, Chemical
Sampling Information.
http://www.osha-slc.gov/dts/chemicalsampling/toc/toc_chemsamp.html
(accessed Dec 1999).
18. Burright, D.; Chan, Y.;
Eide, M.; Elskamp, C.; Hendricks, W.; Rose, M. C. EVALUATION GUIDELINES FOR AIR SAMPLING METHODS UTILIZING
CHROMATOGRAPHIC ANALYSIS; OSHA Salt Lake Technical Center, U.S.
Department of Labor: Salt Lake City, UT, 1999.
19.
OSHA Salt Lake Technical Center, Inorganic Methods Evaluation
Protocol.
http://www.osha-slc.gov/dts/sltc/methods/imeprotocol/index.html
(accessed Oct 1999).
20. The treated filter was
prepared by the following procedure. Thirty-seven-millimeter-diameter
round filters were cut from a piece of polyester non-woven fabric
(polyester non-woven, ultra firm, Style #9260, Handler Textile Co.,
Consumer Product Div., 24 Empire Blvd., Moonachie, NJ 07074). The filters
were washed (sonication) twice with methanol, three times with 10% nitric
acid, twice with deionized water, twice with methanol, and dried. A
solution of 4.0 g of mercuric chloride and a small amount of methyl orange
in 40.0 mL of 95:5 (v/v) methanol/glycerol was prepared. Caution: Mercuric chloride is a poison and slightly
volatile at ordinary temperature. Forty cleaned filters were placed on a
clean glass plate and, using an Eppendorf pipet with a plastic tip, 0.95
mL of the mercuric chloride solution was applied to each filter. The
filters were allowed to dry in a hood for 30 min. The treated filters were
stored in a sealed container in a refrigerator.
21.
Ammonium phosphate and DDVP (2,2-dichlorovinyl dimethyl phosphate) were
selected to represent residual fertilizers and semi-volatile
organo-phosphorus pesticides that may possibly interfere with the sampling
for phosphine during a grain fumigation operation. DDVP has a vapor
pressure of 0.012 torr (1.6 Pa) at 20°C. (Documentation
of the Threshold Limit Values and Biological Exposure Indices,
Sixth Edition; American Conference of Governmental Industrial Hygienists:
Cincinnati, OH, 1991; p.446.)
22. Occupational
Exposure to Hazardous Chemicals in Laboratories. Code
of Federal Regulations, Part 1910.1450, Title 29, 1998.
23. Merck Index, 10th Edition;
Windholz, M. Ed.; Merck & Co.: Rahway, NJ, 1983, p 839.
24. Nowak, M.; Singer, W. Mercury Compounds. In Kirk-Othmer Encyclopedia of Chemical Technology, 4th
edition Kroschwitz, J. I.; Howe-Grant, M., Eds; John Wiley
& Sons: New York, NY, 1995; Volume 16, p 232.
25. Burright, D.; Chan, Y.; Eide, M.; Elskamp, C.; Hendricks,
W.; Rose, M. C. EVALUATION GUIDELINES FOR AIR SAMPLING
METHODS UTILIZING CHROMATOGRAPHIC ANALYSIS; OSHA Salt Lake
Technical Center, U.S. Department of Labor: Salt Lake City, UT,
1999.
26. OSHA Salt Lake Technical Center, Inorganic
Methods Evaluation Protocol.
http://www.osha-slc.gov/dts/sltc/methods/imeprotocol/index.html
(accessed Oct 1999).
27. The test atmosphere was
generated by diluting a stream of certified 524.6 ppm phosphine in
nitrogen (at a flow rate of 25.5 mL/min) with an air stream (at 38.38
L/min) from a Miller-Nelson humid air generator. The
temperature was 19.9°C and the barometric pressure was 86.8 kPa (651.3
mmHg). The phosphine concentration was calculated to be 0.348 ppm or 12.4
nmol/L.
|

