XYLENES (o-, m-, p-isomers)
ETHYLBENZENE
| Method number: | 1002 | |||||||||||||||||||||||||||||||||||||||||||||||||
| Target concentration: | ||||||||||||||||||||||||||||||||||||||||||||||||||
| Xylenes: | 100 ppm (435 mg/m3) | |||||||||||||||||||||||||||||||||||||||||||||||||
| Ethylbenzene: | 17 ppm (73 mg/m3) | |||||||||||||||||||||||||||||||||||||||||||||||||
| OSHA PEL: | ||||||||||||||||||||||||||||||||||||||||||||||||||
| Xylenes: | 100 ppm (435 mg/m3) (TWA) | |||||||||||||||||||||||||||||||||||||||||||||||||
| Ethylbenzene: | 100 ppm (435 mg/m3) (TWA) | |||||||||||||||||||||||||||||||||||||||||||||||||
| ACGIH TLV: | ||||||||||||||||||||||||||||||||||||||||||||||||||
| Xylene: | 100 ppm (TWA) 150 ppm (STEL/C) | |||||||||||||||||||||||||||||||||||||||||||||||||
| Ethylbenzene: | 100 ppm (TWA) 125 ppm (STEL/C) | |||||||||||||||||||||||||||||||||||||||||||||||||
| Procedure: | Active samples are collected by drawing workplace
air through coconut shell charcoal sampling tubes with personal
sampling pumps. Diffusive samples are collected by exposing SKC
| |||||||||||||||||||||||||||||||||||||||||||||||||
| Recommended sampling time and sampling rate: | ||||||||||||||||||||||||||||||||||||||||||||||||||
| Charcoal tubes: | 240 min at 50 mL/min | |||||||||||||||||||||||||||||||||||||||||||||||||
| SKC |
240 min | |||||||||||||||||||||||||||||||||||||||||||||||||
Reliable quantitation limit (RQL) and Standard error of estimate (SEE): |
| |||||||||||||||||||||||||||||||||||||||||||||||||
| *For samples when sampling site pressure and temperature are known. See Section 4.4.2 for applicable SEEs when either or both of these values are unknown. | ||||||||||||||||||||||||||||||||||||||||||||||||||
| Special requirement: | Sampling site temperature and barometric pressure
(station pressure) must be reported when diffusive samplers (such as
SKC | |||||||||||||||||||||||||||||||||||||||||||||||||
| Status of method: | Evaluated method. This method has been subjected to the established evaluation procedures of the Methods Development Team. | |||||||||||||||||||||||||||||||||||||||||||||||||
| August 1999 | Warren Hendricks | |||||||||||||||||||||||||||||||||||||||||||||||||
Methods Development Team
Industrial Hygiene Chemistry
Division
OSHA Salt Lake Technical Center
Salt Lake City UT
84115-1802
1. General Discussion
1.1 Background
1.1.1 History
Xylenes is a collective term for a mixture of m-, o-,
and p- isomers of xylene. These isomers differ only in
placement of two methyl groups on a benzene ring. Technical and
commercial grades of xylenes often contain substantial amounts of
ethylbenzene
Most occupational exposure to xylenes also results in exposure to
ethylbenzene because technical and commercial grades of xylenes are
often used by industry. Therefore, test atmospheres used in this work
were prepared with a commercial source of xylenes to simulate
workplace environment. This source of xylenes contained 43%
Determination of xylenes is well documented in the literature3, 4, and one may question why this work was necessary. SLTC has begun to develop sampling and analytical methods which permit the use of diffusive, as well as, active sampling. One criterion for selection of chemicals for this evaluation program is the number of sample requests. Analysis of xylenes is one of the most requested solvent determinations performed at SLTC.
1.1.2 Toxic effects (This section is for information only and should not be taken as the basis of OSHA policy.)
Xylenes
There is no appreciable difference in the toxicological effects of
the individual xylene isomers and those of mixed isomers. Xylenes are
eye, skin, and mucous membrane irritants. They can cause narcosis at
high levels. Xylenes can cause liver and kidney damage. There is
little (if any) evidence for the carcinogenicity of xylenes in
experimental animals. The ACGIH
Ethylbenzene
Ethylbenzene is a skin and mucous membrane irritant. It has acute
and possibly chronic central nervous system effects that include
vertigo, unconsciousness, tremors, and changes in respiration. Animal
experiments suggest that ethylbenzene causes damage to the liver,
kidneys, and testes. It was the opinion of the ACGIH TLV Committee
that no systemic effects would be expected at concentrations which
produce skin and eye irritation. The ACGIH
1.1.3 Workplace exposure
The main source of mixed xylenes since World War II has been reformed petroleum fractions. Earlier, xylenes were produced from coal. Coal may again become an important source as the large coal reserves in the United States are developed for petrochemical uses.8 U.S. production of xylenes in 1995 was 9.4 billion pounds, and that for ethylbenzene was 13.7 billion pounds.9
Most mixed xylenes are used to blend gasoline. Mixed xylenes are
also used in the paint and coatings industry.
1.1.4 Physical properties (12
unless otherwise noted)
|
| |||||
| xylenes | m-xylene | o-xylene | p-xylene | ethylbenzene | |
|
| |||||
| CAS number13 | 1330-20-714 | 108-38-3 | 95-47-6 | 106-42-3 | 100-41-4 |
| IMIS number15 | 2590 | 1080 | |||
| molecular weight16 | 106.17 | 106.17 | 106.17 | 106.17 | 106.17 |
| boiling point (°C) | 137-145 | 138.8 | 144 | 138.5 | 136.19 |
| melting point (°C) | -47.4 | -25 | 13.2 | -95.0117 | |
| density (°C) | about 0.86 | 0.868 (15) | 0.880 (20/4) | 0.861 (20) | 0.867 (20) |
| molecular formula | C8H10 | C8H10 | C8H10 | C8H10 | C8H10 |
| flash point (°F) | 81-115 | 85 | 115 | 81 | 59 |
| vapor pressure (kPa, (°C))18, 19 |
1.1 (25) | 0.9 (25) | 1.2 (25) | 0.9 (20) | |
|
| |||||
Xylenes (dimethylbenzene, xylol) are soluble in alcohol and ether,
but insoluble in water. Each of the mixed xylenes is a clear,
colorless liquid at room temperature, however,
Structural formulas:
 m-xylene |
 o-xylene |
 p-xylene |
 ethyl benzene |
This method was evaluated according to OSHA SLTC "Evaluation Guidelines
for Air Sampling Methods Utilizing Chromatographic Analysis21.
The Guidelines define analytical parameters and specify required
laboratory tests, statistical calculations and acceptance criteria. The
analyte concentrations throughout this method are based on the recommended
sampling and analytical parameters. Air concentrations in ppm and ppb are
referenced to 25 °C and 101.3 kPa (760 mmHg).
1.2 Limit defining parameters
1.2.1 Detection limit of the analytical procedure
|
The detection limits of the analytical procedure (DLAP) are shown in Table 1.2.1. These are the amounts of analyte that will give detector responses significantly different from the response of a reagent blank. (Section 4.1) |
| |||||||||||||||||||||||||
1.2.2 Detection limit of the overall procedure
|
Charcoal tubes The detection limits of the overall procedure (DLOP) are shown in Table 1.2.2.1. These are the amounts of analyte spiked on the samplers that will give detector responses significantly different from the response of a sampler blank. (Section 4.2) |
| ||||||||||||||||||||
|
SKC The detection limits of the overall procedure (DLOP) are shown in Table 1.2.2.2. These are the amounts of analyte spiked on the samplers that will give detector responses significantly different from the response of a sampler blank. (Section 4.2) |
| ||||||||||||||||||||
1.2.3 Reliable quantitation limit
|
Charcoal tubes The reliable quantitation limits (RQL) are shown in Table 1.2.3.1. These are the amounts of analyte that will give detector responses that are considered the lower limits for precise quantitative measurements. (Section 4.2) |
| ||||||||||||||||||||
|
SKC 575-002 Passive Samplers The reliable quantitation limits (RQL) are shown in Table 1.2.3.2. These are the amounts of analyte that will give detector responses that are considered the lower limits for precise quantitative measurements. (Section 4.2) |
| ||||||||||||||||||||
|
1.2.4 Instrument calibration The coefficients of determination (r2) and of nondetermination (k2) for the calibration curves are shown in Table 1.2.4. The calibrated range was 0.5 to 2 times the OSHA PEL. (Section 4.3) |
| |||||||||||||||||||||||||||||||||||||||||||||
1.2.5 Precision (overall procedure)
|
Charcoal tubes The precision of the overall procedure at the 95% confidence
interval for the ambient temperature |
| ||||||||||
SKC
The precision of the overall procedure at the 95% confidence
interval for the ambient temperature
|
| |||||
| condition | xylenes | m-xylene | o-xylene | p-xylene | ethylbenzene |
|
| |||||
| both T and P known only T known only P known neither T nor P known |
18.2 19.1 23.7 24.4 |
18.3 19.2 23.7 24.4 |
18.1 19.0 23.6 24.3 |
18.3 19.2 23.7 24.4 |
18.4 19.3 23.8 24.5 |
|
| |||||
|
1.2.6 Recovery The recoveries from samples used in |
| |||||||||||||||
1.2.7 Reproducibility
Twelve samples (six active and six diffusive) collected from test atmospheres were submitted for analysis by SLTC. The samples were analyzed according to instructions presented in a draft copy of this method after 16 and 22 days of storage at ambient temperature for the active and diffusive samplers, respectively. No individual result deviated from its theoretical value by more than the precision reported in Section 1.2.5. (Section 4.6)
2. Sampling procedure
All safety practices that apply to the work area being sampled should be followed. The sampling equipment should be attached to the worker in such a manner that it will not interfere with work performance or safety.
2.1 Apparatus
2.1.1 Charcoal tubes
Samples are collected with a personal sampling pump calibrated, with the sampler attached, to within ±5% at 50 mL/min.
Samples are collected with
2.1.2 SKC
Samples are collected with SKC
A thermometer and a barometer are needed to determine sampling site temperature and pressure.
2.2 Reagents
None required.
2.3 Technique
2.3.1 Charcoal tubes
Immediately before sampling, break off both ends of the flame sealed sampling tube to provide openings approximately half the internal diameter of the tube. Wear eye protection when breaking tubes. Use sampling tube holders to shield the employee from the sharp, jagged ends of the sampling tubes. All sampling tubes should be from the same lot.
Use the smaller charcoal section of the sampling tube as a
Draw air to be sampled directly into the tube inlet. Sampled air is not to pass through any hose or tubing before entering the sampling tube.
Remove the sampler and seal the tube with plastic end caps after
sampling for the appropriate time. Seal each sample
Submit at least one blank sample with each set of samples. Handle the blank sampler in the same manner as the other samples, except draw no air through it.
Record sample air volume in liters for each sample, and record any potential interference.
Submit the samples to the laboratory for analysis as soon as possible after sampling. Store the samples at reduced temperature if delay is unavoidable. Ship any bulk samples separate from air samples.
2.3.2 SKC
Remove the sampler from the clear package just before sampling.
CAUTION - The monitor begins to sample as soon as it is removed from
this package. Retain the
Record the start time on the sampler label, or on the Form OSHA-91A.
Attach the sampler near the worker's breathing zone with the perforations in the sampler facing out. Assure that the area directly in front of the sampler is unobstructed throughout the sampling period.
Remove the sampler from the worker immediately at the end of the
sampling period. Attach the cover with the
Prepare a blank sample by removing it from its clear package, and
then immediately attaching a cover with the
Seal each sample with an
Verify that sampling times are properly recorded on Form
Record sampling site temperature and atmospheric pressure
(station pressure) on Form
List any chemicals that could be considered potential interferences, especially solvents, that are in use in the sampling area.
Submit the samples to the laboratory for analysis as soon as possible. Store the samples in a refrigerator if delay is unavoidable. Include the port plugs and PTFE tubes which will be used in the laboratory analysis.
Ship any bulk samples separate from air samples.
2.4 Sampler capacity
2.4.1 Charcoal tubes
The sampling capacity of SKC Lot 2000 charcoal tubes was tested by
sampling from a dynamically generated test atmosphere of mixed xylenes
(1027 mg/m3 or 237 ppm). Samples were
collected at 50 mL/min and the relative humidity was about 78% at
2.4.2 SKC 575-002 Passive Samplers
The sampling rate and capacity of SKC
2.5 Extraction efficiency
It is the responsibility of the analytical laboratory to occasionally determine or confirm extraction efficiency because the adsorbent material, reagents, or technique may be different from those presented in this method.
2.5.1 Charcoal tubes
|
| |||
| m-xylene | o-xylene | p-xylene | ethylbenzene |
|
| |||
| 96.3 | 93.8 | 96.1 | 97.2 |
|
| |||
Mean extraction efficiencies (EE) of the analytes from SKC Lot 2000 charcoal are presented in Table 2.5.1. The range studied was from the RQL to 2 times the 100 ppm OSHA PEL for each xylene isomer, and for ethylbenzene. The extraction efficiency was not affected by the presence of water. (Section 4.8.1)
2.5.2 SKC 575-002 Passive Samplers
|
| |||
| m-xylene | o-xylene | p-xylene | ethylbenzene |
|
| |||
| 96.1 | 89.4 | 95.3 | 99.1 |
|
| |||
Mean extraction efficiencies (EE) of the analytes from SKC Anasorb
747 (the adsorbent in SKC
2.6 Recommended sampling time and sampling rate
2.6.1 Charcoal tubes
Sample for up to 4 hours at 50 mL/min when using SKC
2.6.2 SKC 575-002 Passive Samplers
|
Sample for up to 4 hours when using SKC |
| ||||||||||||||||||||
2.6.3 The air concentration equivalent to the reliable quantitation
limit becomes larger when
2.7 Sampling interferences (Section 4.9)
2.7.1 Charcoal tubes
Retention
The ability of the sampler to retain the analytes following
collection was tested. The retention efficiency of all analytes for
all samples was above 100.8% when three charcoal tubes containing 3 mg
of mixed xylenes were used to sample 9 L of
Low relative humidity
The ability of the sampler to collect and retain the analytes at
low relative humidity was tested. The collection efficiency of all
analytes for all samples was above 99.2% when three charcoal tubes
were used to sample 12 L of air containing two times the target
concentration of mixed xylenes and having a relative humidity of 5% at
Low concentration
The ability of the sampler to collect and retain the analytes at
low concentration was tested. The collection efficiency of all
analytes for all samples was above 94.6% when three charcoal tubes
were used to sample 12 L of air containing 0.1 times the target
concentration of mixed xylenes and having a relative humidity of 80%
at
Interference
The ability of the sampler to collect and retain the analytes in
the presence of potential sampling interferences was tested. The
collection efficiency of all analytes for all samples was above 101.2%
when three charcoal tubes were used to sample 12 L of air containing
one times the target concentration of mixed xylenes, 365
mg/m3 toluene, 372
mg/m3 butyl acetate, and a relative humidity
of 81% at
2.7.2 SKC
Reverse diffusion
The sampling method was tested for reverse diffusion. The retention
efficiency of all analytes for all samples was above 99.6% when three
SKC
Low relative humidity
The sampling method was tested to determine if the sampling rates
remained constant at low relative humidity. The sampling rate of all
analytes for all samples was above 97.8% of the sampling rate reported
in Section 2.6.2 when three SKC
Low concentration
The sampling method was tested to determine if the sampling rates
remained constant at low concentration. The sampling rate of all
analytes for all samples was above 95.0% of the sampling rate reported
in Section 2.6.2 when three SKC
Interference
The sampling method was tested to determine if the sampling rates
remained constant in the presence of sampling interferences. The
sampling rate for all analytes for all samples was above 94.3% of the
sampling rate reported in Section 2.6.2 when three SKC
3. Analytical procedure
Adhere to the rules set down in your Chemical Hygiene Plan (which is mandated by the OSHA Laboratory Standard). Avoid skin contact and inhalation of all chemicals.
3.1 Apparatus
3.1.1 A GC equipped with a flame ionization (FID) detector. A
3.1.2 A GC column capable of separating mixed xylenes from the
extraction solvent, internal standards, and potential interferences. A
J&W Scientific
3.1.3 An electronic integrator or other suitable means of measuring GC detector response. A Waters Millennium Chromatography Manager system was used in this evaluation.
3.1.4 Two and
3.1.5 One and
3.1.6 A SKC Desorption Shaker with rack (226D-03K) was used to
extract SKC
3.2 Reagents
3.2.1 Xylenes, Isomers plus ethylbenzene, 98.5+%, A.C.S. reagent, Aldrich Chemical Co., Lot TR 02505LR, was used in this evaluation.
3.2.2
3.2.3 o-Xylene, 98%, Spectrophotometric Grade, Aldrich Chemical Co., Lot 07946PN, was used in this evaluation.
3.2.4 p-Xylene, 99+%, anhydrous, Aldrich Chemical Co., Lot TQ 25949MQ, was used in this evaluation.
3.2.5 Ethylbenzene, 99.8%, anhydrous, Aldrich Chemical Co., Lot DR 03249JQ, was used in this evaluation.
3.2.6 Carbon disulfide (CS2), 99.9+%, low benzene content, Aldrich Chemical Co., Lot 07546PN, was used in this evaluation.
3.2.7 1-Phenylhexane (hexylbenzene), 97%, Aldrich Chemical Co., Lot
03006PZ, was used as an internal standard for SKC
3.2.8 p-Cymene, 99%, Aldrich Chemical Co., Lot 11703TR, was used as an internal standard for charcoal tube samples in this evaluation.
3.2.9 The extraction solvent used for this evaluation consisted of
1 µL of the appropriate internal standard per milliter of
CS2. CAUTION: extraction efficiency
of the internal standard from the sampling medium has an effect on
sample results. This effect is especially significant for SKC
3.2.10 GC grade nitrogen, air, and hydrogen were used in this evaluation.
3.3 Standard preparation
3.3.1 Prepare stock mixed standards by weighing
3.3.2 Prepare working range standards for the analysis of charcoal
tubes by injecting microliter quantities of the stock mixed standard
into
3.3.3 Prepare working range standards for the analysis of SKC
3.3.4 Prepare a sufficient number of standards so that sample results will likely be bracketed with standards. If sample results are outside the range of prepared standards, prepare and analyze additional standards, or dilute high samples with extraction solvent and then reanalyze the diluted samples.
3.4 Sample preparation
3.4.1 Charcoal tubes
Remove the plastic end caps from the sampling tube and carefully
transfer each section of the adsorbent into separate
Add 1.0 mL of extraction solvent to each vial and immediately seal
each vial with a
Shake the vials vigorously several times during the
3.4.2 SKC
Cut off the ends of the two protruding tubes of each sampler with a razor blade or a sharp knife.
Secure the sampler by clipping it to a rail of the detachable SKC Desorption Shaker rack. Carefully and slowly add 2.0 mL of extraction solvent through the protruding tube nearest the outside edge of the sampler using a volumetric pipet. The tip of the pipet should fit just inside the sampler tube. Immediately seal the sampler tubes with the plugs supplied by the manufacturer.
Replace the rack onto the SKC Desorption Shaker and shake the samples for one hour.
Do not allow the extracted sample to remain in the sampler.
Transfer the extracted sample into
3.5 Analysis
3.5.1 GC conditions
| zone temperatures: | column | 40 °C, hold 1 min, program at |
| injector | 220 °C | |
| detector | 220 °C | |
| gas flows: | hydrogen (carrier) | 4.4 mL/min (115 kPa head pressure) |
| nitrogen (makeup) | 38 mL/min | |
| hydrogen (FID) | 35 mL/min | |
| air (FID) | 455 mL/min | |
| signal range: | 3 | |
| injection volume: | 1 µL (20:1 split) | |
| column: | 60 m × fused silica 0.32-mm i.d. DB Wax 0.5-µm df |
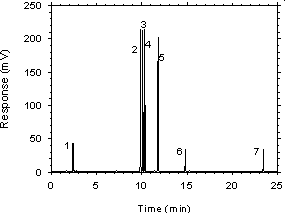
Figure 3.5.1 Chromatogram of a sample desorbed from charcoal. Concentration is approximately the100-ppm PEL for each analyte. Key: (1) CS2, (2) ethylbenzene,(3) p-xylene, (4) m-xylene, (5) o-xylene, (6) p-cymene, (7) 1-phenylhexane.
3.5.2 Measure peak areas with an electronic integrator or other suitable means.
3.5.3 An internal standard (ISTD) method is used to calibrate the
instrument in terms of micrograms of analyte per sample. Prepare a
calibration curve by analyzing standards, and constructing calibration
curves by plotting
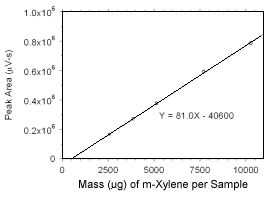 Figure 3.5.3.1 Calibration curve for m-xylene standards used to analyze charcoal tubes constrcted from the data in Table 4.3.1. |
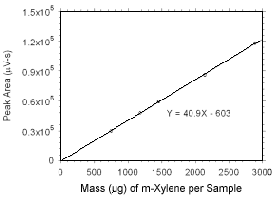 Figure 3.5.3.2 Calibration curve for m-xylene standards used to analyze SKC 575-002 Passive Samplers constructed from the data in Table 4.3.5. |
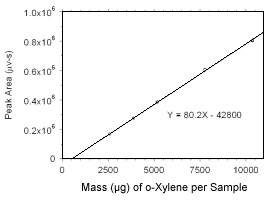 Figure 3.5.3.3 Calibration curve for o-xylene standards used to analyze charcoal tubes constructed from the data in Table 4.3.2. |
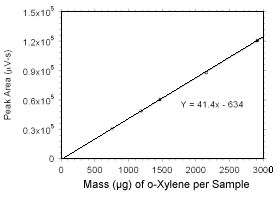 Figure 3.5.3.4 Calibration curve for o-xylene standards used to analyze SKC |
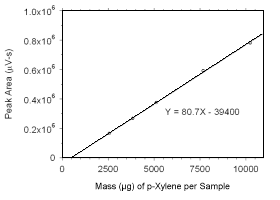 Figure 3.5.3.5 Calibration curve for p-xylene standards used to analyze charcoal tubes constructed from the data in Table 4.3.3. |
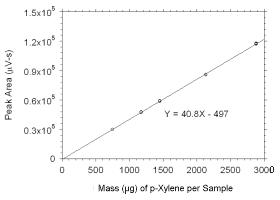 Figure 3.5.3.6 Calibration curve for p-xylene standards used to analyze SKC |
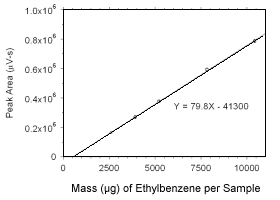 Figure 3.5.3.7 Calibration curve for ethylbenzene standards used to analyze charcoal tubes constructed from the data in Table 4.3.4. |
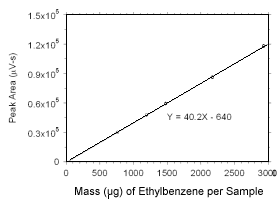 Figure 3.5.3.8 Calibration curve for ethylbenzene standards used to analyze SKC |
3.6 Interferences (analytical)
3.6.1 Any chemical that produces an FID response and has a similar retention time as any of the analytes or internal standard is a potential interference. Any reported potential interferences should be considered before samples are extracted. Generally, chromatographic conditions can be altered to separate an interference from an analyte or an internal standard.
3.6.2 The identity or purity of an analyte peak can be confirmed with additional analytical data. (Section 4.10)
3.7 Calculations
3.7.1 Charcoal tubes
Obtain separate amounts of each analyte
(
| mg/m3 = | micrograms of analyte per sample
liters of air sampled × extraction efficiency |
| ppm = | 24.46 × mg/m3
106.17 |
| Where | 24.46 is the molar volume at 25 °C and 101.3 kPa (760
mmHg) 106.17 is the molecular weight of |
3.7.2 SKC
Obtain separate amounts of each analyte
(
|
| |||
| m-xylene | o-xylene | p-xylene | ethylbenzene |
|
| |||
| 13.82 | 14.24 | 13.94 | 13.83 |
|
| |||
Sampling time, sampling site temperature

Assume sampling site temperature is 22.2 °C if it is not given. If sampling site pressure is not given, it can be calculated by the following formula:
P = ( 3.887 × 10⁻⁷ ) E2 - ( 2.7467 × 10⁻² ) E + 760
Where
P is the approximate sampling site barometric
pressure. E is the sampling site elevation. E can be
estimated from airports near the sampling site location using a web
site such as http://www.osha-slc.gov/pls/oshaweb/owaredirect.html?p_url=http://www.airnav.com
Liters of air sampled is calculated by multiplying the appropriate SRamb by sampling time.
Air concentrations are then calculated using the following
formulas. Calculate xylenes exposure by summing the individual xylene
isomer results.
| mg/m3 = | micrograms of analyte per sample
liters of air sampled × extraction efficiency |
| ppm = | 24.46 × mg/m3
106.17 |
| Where | 24.46 is the molar volume at 25 °C and 101.3 kPa (760
mmHg) 106.17 is the molecular weight of |
4. Backup Data
General background information about determination of detection limits and precision of the overall procedure is found in OSHA SLTC "Evaluation Guidelines for Air Sampling Methods Utilizing Chromatographic Analysis"22. The Guidelines define analytical parameters and specify required laboratory tests, statistical calculations and acceptance criteria.
4.1 Detection limit of the analytical procedure (DLAP)
|
| |
| analyte | DLAP (pg) |
|
| |
| xylenes m-xylene o-xylene p-xylene ethylbenzene |
14.5 2.1 8.4 14.0 5.7 |
|
| |
The DLAP is measured as the mass of analyte introduced into the
chromatographic column. Ten standards were prepared in equal descending
increments of analyte, such that the highest standard produced a peak
approximately 10 times the response of a reagent blank. These standards,
and a reagent blank, were analyzed using the recommended analytical
parameters
|
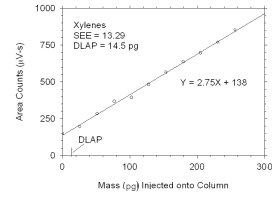 Figure 4.1.1 Plot of data used to determine DLAP for xylenes. | |||||||||||||||
|
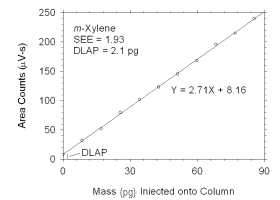 Figure 4.1.2 Plot of data used to determine DLAP for m-xylene. | |||||||||||||||
|
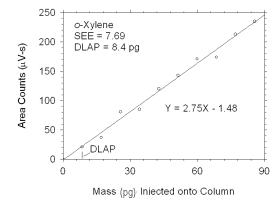 Figure 4.1.3 Plot of data used to determine DLAP for o-xylene. | |||||||||||||||
|
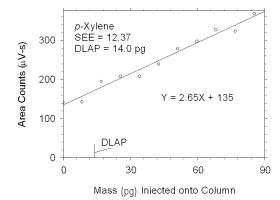 Figure 4.1.4 Plot of data used to determine DLAP for p-xylene. | |||||||||||||||
|
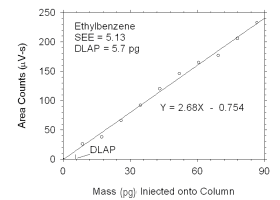 Figure 4.1.5 Plot of data used to determine DLAP for ethylbenzene. | |||||||||||||||
4.2 Detection limit of the overall procedure (DLOP) and reliable quantitation limit (RQL)
|
| ||||||
| analyte | charcoal tubes |
SKC 575-002 Passive Samplers | ||||
| ng | µg/m3 | ppb | ng | µg/m3 | ppb | |
|
| ||||||
| xylenes m-xylene o-xylene p-xylene ethylbenzene |
322 159 239 100 129 |
26.8 13.2 19.9 8.3 10.8 |
6.2 3.0 4.6 1.9 2.5 |
847 448 325 437 315 |
252.8 134.9 95.0 130.8 94.9 |
58.2 31.1 21.9 30.1 21.9 |
|
| ||||||
The DLOP is measured as mass per sample and expressed as equivalent
air concentrations, based on the recommended sampling parameters. Ten
|
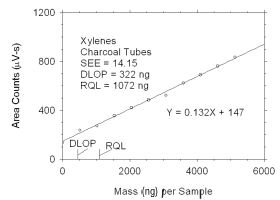 Figure 4.2.1 Plot of data used to determine DLOP and RQL for xylenes. | ||||||||||
|
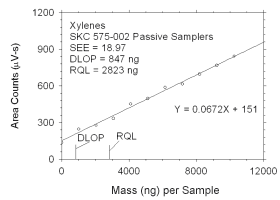 Figure 4.2.2 Plot of data used to determine DLOP and RQL for xylenes. | ||||||||||
|
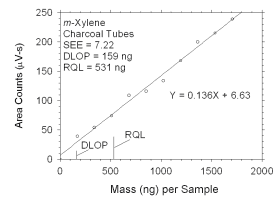 Figure 4.2.3 Plot of data used to determine DLOP and RQL for m-xylene. | ||||||||||
|
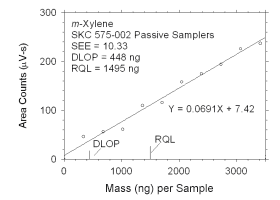 Figure 4.2.4 Plot of data used to determine DLOP and RQL for m-xylene. | ||||||||||
|
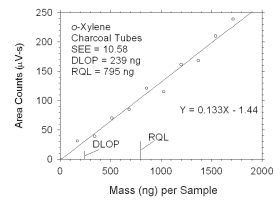 Figure 4.2.5 Plot of data used to determine DLOP and RQL for o-xylene. | ||||||||||
|
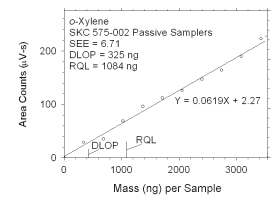 Figure 4.2.6 Plot of data used to determine DLOP and RQL for o-xylene. | ||||||||||
|
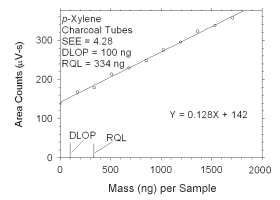 Figure 4.2.7 Plot of data used to determine DLOP and RQL for p-xylene. | ||||||||||
|
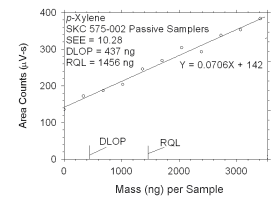 Figure 4.2.8 Plot of data used to determine DLOP and RQL for p-xylene. | ||||||||||
|
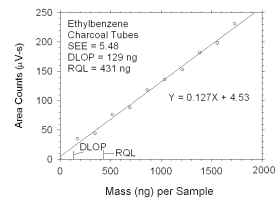 Figure 4.2.9 Plot of data used to determine DLOP and RQL for ethylbenzene. | ||||||||||
|
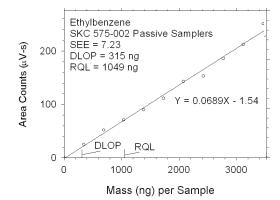 Figure 4.2.10 Plot of data used to determine DLOP and RQL for ethylbenzene. | ||||||||||
The RQL is considered the lower limit for precise quantitative
measurements. It is determined from the regression line parameters
obtained for calculation of DLOP, providing the extraction efficiency
(EE) is 100 ± 25% at the RQL.
|
| ||||||||
| charcoal tubes |
SKC 575-002 Passive Samplers | |||||||
| analyte | ng | µg/m3 | ppb | EE(%) | ng | µg/m3 | ppb | EE(%) |
|
| ||||||||
| xylenes m-xylenes o-xylenes p-xylenes ethylbenzene |
1072 531 795 334 431 |
89.3 44.2 66.2 27.8 35.9 |
20.6 10.2 15.3 6.4 8.3 |
98.4 98.9 95.6 99.9 99.4 |
2823 1495 1084 1456 1049 |
842.7 450.3 317.0 435.9 316.0 |
194.1 103.7 73.0 100.4 72.8 |
93.6 96.4 84.9 95.6 97.6 |
|
| ||||||||
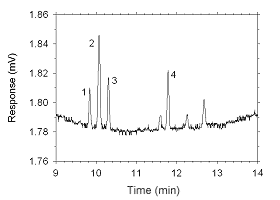 Figure 4.2.11 Chromatogram of a sample containing masses of analytes approximating the RQLs extracted from a charcoal tube. Key: (1) ethylbenzene, (2) |
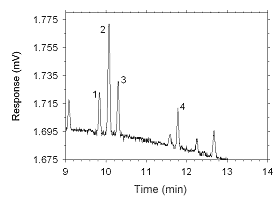 Figure 4.2.12 Chromatogram of a sample containing masses of analytes approximating the RQLs extracted from a SKC 575-002 Passive Sampler. Key: (1) ethylbenzene, |
4.3 Instrument calibration
|
The instrument was calibrated for xylene isomers and ethylbenzene over a range of from 0.5 to 2 times the 100 ppm PEL for each analyte. Calibration was performed at concentrations appropriate for both active and diffusive samplers. Calibration curves were constructed from the tabulated data and are shown in Section 3.5.3. Coefficients of determination (r2) and of nondetermination (k2) are shown in Table 4.3. |
| |||||||||||||||||||||||||||||||||||||||||||||
|
| |||||
| × OSHA PEL (µg/sample) |
0.5× 2568 |
0.75× 3852 |
1× 5136 |
1.5× 7704 |
2× 10272 |
|
| |||||
| area (µV-s) | 164794 164754 164983 164992 165047 165182 |
269791 269445 269434 269351 269191 268965 |
375905 375908 376753 376901 375901 375624 |
593689 592710 593187 592430 591644 593035 |
783759 784944 786776 784541 784130 783251 |
|
| |||||
|
| |||||
| × OSHA PEL (µg/sample) |
0.5× 2590 |
0.75× 3884 |
1× 5179 |
1.5× 7769 |
2× 10358 |
|
| |||||
| area (µV-s) | 167753 167760 167934 167902 167961 168094 |
274897 274708 274660 274497 274406 274212 |
383480 383480 384309 384433 383472 383231 |
606183 605143 605576 605029 604460 605477 |
801612 802500 804231 802144 801744 800999 |
|
| |||||
|
| |||||
| × OSHA PEL (µg/sample) |
0.5× 2559 |
0.75× 3839 |
1× 5118 |
1.5× 7678 |
2× 10237 |
|
| |||||
| area (µV-s) | 164552 164539 164734 164768 164807 164923 |
268846 268538 268527 268449 268265 268051 |
374277 374271 375116 375271 374253 374021 |
590454 589602 590062 589284 588468 589848 |
779090 780366 782170 779941 779572 778654 |
|
| |||||
|
| |||||
| × OSHA PEL (µg/sample) |
0.5× 2608 |
0.75× 3912 |
1× 5216 |
1.5× 7824 |
2× 10432 |
|
| |||||
| area (µV-s) | 164275 164292 164473 164518 164581 164665 |
269560 269199 269224 269089 268885 268679 |
375888 375846 376676 376857 375780 375508 |
593883 593063 593502 592685 591749 593173 |
783759 785278 787146 784787 784405 783391 |
|
| |||||
|
| |||||
| × OSHA PEL (µg/sample) |
0.5× 749 |
0.75× 1177 |
1× 1455 |
1.5× 2140 |
2× 2889 |
|
| |||||
| area (µV-s) | 29838 29955 29857 29887 29836 29842 |
47626 47689 47832 47847 47796 47774 |
58960 59183 59046 59397 59004 59284 |
86200 86119 86097 85956 85933 85854 |
117788 117903 117765 118128 117561 117760 |
|
| |||||
|
| |||||
| × OSHA PEL (µg/sample) |
0.5× 755 |
0.75× 1187 |
1× 1467 |
1.5× 2158 |
2× 2913 |
|
| |||||
| area (µV-s) | 30464 30579 30508 30521 30486 30483 |
48643 48697 48848 48880 48780 48795 |
60209 60434 60309 60692 60248 60531 |
88024 87973 87915 87801 87757 87695 |
120324 120516 120317 120670 120081 120298 |
|
| |||||
|
| |||||
| × OSHA PEL (µg/sample) |
0.5× 746 |
0.75× 1173 |
1× 1450 |
1.5× 2133 |
2× 2879 |
|
| |||||
| area (µV-s) | 29754 29867 29774 29817 29771 29772 |
47433 47507 47680 47672 47625 47597 |
58707 58961 58809 59157 58765 59041 |
85808 85716 85692 85590 85545 85468 |
117229 117319 117199 117578 116981 117192 |
|
| |||||
|
| |||||
| × OSHA PEL (µg/sample) |
0.5× 761 |
0.75× 1195 |
1× 1478 |
1.5× 2173 |
2× 2934 |
|
| |||||
| area (µV-s) | 29797 29920 29824 29882 29834 29816 |
47592 47668 47822 47826 47764 47738 |
58904 59197 59043 59390 58958 59261 |
86193 86089 86057 85970 85917 85830 |
117774 117857 117737 118148 117530 117767 |
|
| |||||
4.4 Precision (overall procedure)
4.4.1 Charcoal tubes
|
The precision at the 95% confidence level is obtained by
multiplying the SEE by 1.96 (the |
| |||||||||||||||
4.4.2 SKC
The precision at the 95% confidence level is obtained by
multiplying the SEE by 1.96 (the
|
| ||||||||||
| condition | xylenes | m-xylene | o-xylene | p-xylene | ethylbenzene | |||||
| SEE (%) |
precision (±%) |
SEE (%) |
precision (±%) |
SEE (%) |
precision (±%) |
SEE (%) |
precision (±%) |
SEE (%) |
precision (±%) | |
|
| ||||||||||
| both T and P known only T known only P known neither T nor P known |
9.29 9.76 12.07 12.43 |
18.2 19.1 23.7 24.4 |
9.32 9.79 12.09 12.46 |
18.3 19.2 23.7 24.4 |
9.24 9.71 12.03 12.40 |
18.1 19.0 23.6 24.3 |
9.33 9.80 12.10 12.46 |
18.3 19.2 23.7 24.4 |
9.39 9.86 12.14 12.51 |
18.4 19.3 23.8 24.5 |
|
| ||||||||||
4.5 Storage tests
4.5.1 Charcoal tubes
Storage stability samples were prepared by sampling (at 50 mL/min
for four hours) dynamically generated test atmospheres of mixed
xylenes with SKC
|
| ||||||
| time (days) |
ambient storage recovery (%) |
refrigerated storage recovery (%) | ||||
|
| ||||||
| 0 3 7 10 14 16 |
97.0 101.1 102.2 96.5 101.6 99.8 |
98.9 102.5 97.4 97.9 96.7 97.0 |
96.8 100.3 103.1 99.2 97.9 101.1 |
97.0 103.1 96.3 100.4 101.3 101.7 |
98.9 101.3 100.2 98.2 99.4 93.8 |
96.8 100.3 100.8 98.8 100.2 102.0 |
|
| ||||||
|
| ||||||
| time (days) |
ambient storage recovery (%) |
refrigerated storage recovery (%) | ||||
|
| ||||||
| 0 3 7 10 14 16 |
97.3 101.4 102.5 97.0 101.9 100.6 |
99.1 102.8 97.8 98.3 97.2 98.7 |
97.2 100.6 103.3 99.5 99.8 101.9 |
97.3 103.3 97.6 100.7 101.6 102.0 |
99.1 101.6 100.7 98.7 99.7 93.7 |
97.2 100.6 101.2 99.2 100.5 102.3 |
|
| ||||||
|
| ||||||
| time (days) |
ambient storage recovery (%) |
refrigerated storage recovery (%) | ||||
|
| ||||||
| 0 3 7 10 14 16 |
96.1 100.7 101.5 95.2 101.0 99.5 |
98.4 101.8 96.3 97.0 95.6 95.8 |
95.9 99.5 102.6 98.4 98.5 100.6 |
96.1 102.5 95.6 99.6 100.6 101.1 |
98.4 100.7 99.2 96.9 98.8 94.4 |
95.9 99.6 100.0 97.7 99.5 101.4 |
|
| ||||||
|
| ||||||
| time (days) |
ambient storage recovery (%) |
refrigerated storage recovery (%) | ||||
|
| ||||||
| 0 3 7 10 14 16 |
97.0 101.1 102.1 96.6 101.6 99.6 |
98.8 102.5 97.5 98.0 96.8 97.0 |
96.8 100.3 103.0 99.2 93.1 101.1 |
97.0 103.0 96.4 100.4 101.3 101.7 |
98.8 101.3 100.3 98.3 99.4 93.5 |
96.8 100.3 100.9 98.9 100.2 101.9 |
|
| ||||||
|
| ||||||
| time (days) |
ambient storage recovery (%) |
refrigerated storage recovery (%) | ||||
|
| ||||||
| 0 3 7 10 14 16 |
98.2 102.1 103.1 98.2 102.5 100.0 |
99.7 103.6 99.0 99.3 98.6 97.5 |
98.3 101.6 103.9 100.3 100.8 101.4 |
98.2 104.0 97.5 101.6 102.3 102.6 |
99.7 102.3 101.9 100.1 100.6 93.5 |
98.3 101.3 102.2 100.3 101.2 103.0 |
|
| ||||||
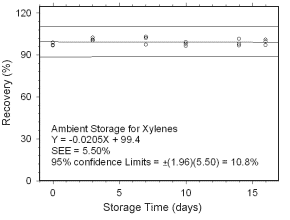 Figure 4.5.1.1 Ambient storage test for xylenes collected on charcoal tubes. |
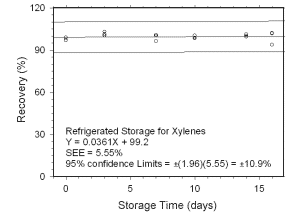 Figure 4.5.1.2 Regrigerated storage test for xylenes collected on charcoal tubes. | |
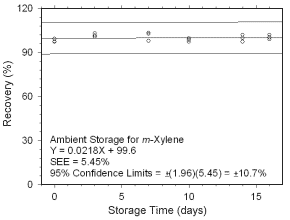 Figure 4.5.1.3 Ambient storage test for |
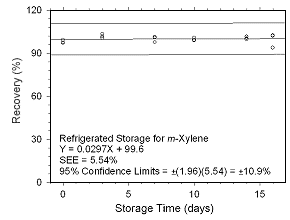 Figure 4.5.1.4 Regrigerated storage test for | |
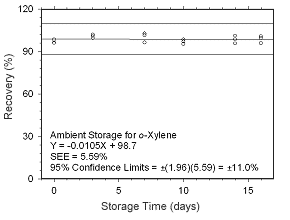 Figure 4.5.1.5 Ambient storage test for |
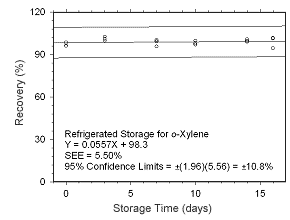 Figure 4.5.1.6 Regrigerated storage test for | |
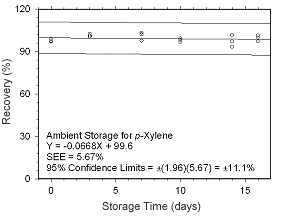 Figure 4.5.1.7 Ambient storage test for |
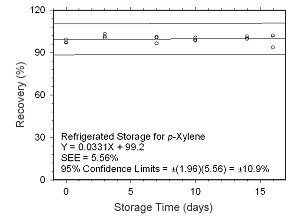 Figure 4.5.1.8 Regrigerated storage test for | |
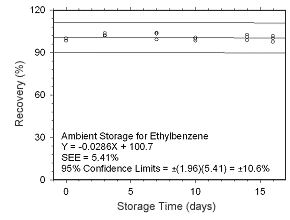 Figure 4.5.1.9 Ambient storage test for ethylbenzene collected on charcoal tubes. |
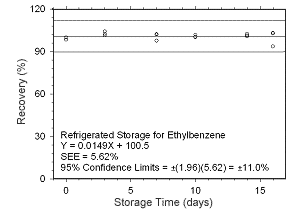 Figure 4.5.1.10 Regrigerated storage test for ethylbenzene collected on charcoal tubes. |
4.5.2 SKC 575-002 Passive Samplers
Storage stability samples were prepared by sampling dynamically
generated test atmospheres of mixed xylenes with SKC
|
| ||||||
| time (days) |
ambient storage recovery (%) |
refrigerated storage recovery (%) | ||||
|
| ||||||
| 0 3 7 10 14 16 |
96.6 101.0 104.6 101.1 98.0 97.4 |
97.3 101.6 93.5 102.8 92.9 98.9 |
97.1 102.5 99.7 97.2 99.7 94.4 |
96.6 101.2 100.9 100.5 100.6 102.4 |
97.3 102.5 100.0 99.5 99.4 100.9 |
97.1 101.4 98.6 100.7 100.5 97.9 |
|
| ||||||
|
| ||||||
| time (days) |
ambient storage recovery (%) |
refrigerated storage recovery (%) | ||||
|
| ||||||
| 0 3 7 10 14 16 |
96.8 101.5 105.1 101.6 98.4 97.9 |
97.5 102.2 93.9 103.3 93.3 99.4 |
97.4 103.1 100.2 97.6 100.1 94.9 |
96.8 101.8 101.3 100.9 101.1 102.9 |
97.5 103.1 100.4 100.0 99.9 101.4 |
97.4 101.9 99.0 101.1 101.0 98.4 |
|
| ||||||
|
| ||||||
| time (days) |
ambient storage recovery (%) |
refrigerated storage recovery (%) | ||||
|
| ||||||
| 0 3 7 10 14 16 |
96.2 99.7 103.4 99.9 96.9 96.2 |
96.8 100.4 92.4 101.5 92.1 97.7 |
96.6 101.1 98.6 96.1 99.0 93.1 |
96.2 99.7 99.9 99.4 99.3 101.1 |
96.8 101.1 98.8 98.4 98.2 99.6 |
96.6 100.4 97.3 99.6 99.3 96.7 |
|
| ||||||
|
| ||||||
| time (days) |
ambient storage recovery (%) |
refrigerated storage recovery (%) | ||||
|
| ||||||
| 0 3 7 10 14 16 |
96.6 101.2 104.8 101.3 98.1 97.5 |
97.2 101.8 93.6 103.1 92.9 99.1 |
97.0 102.8 99.9 97.3 99.6 94.5 |
99.6 101.5 101.0 100.6 100.7 102.5 |
97.2 102.8 100.2 99.7 99.5 101.0 |
97.0 101.5 98.7 100.8 100.7 98.0 |
|
| ||||||
|
| ||||||
| time (days) |
ambient storage recovery (%) |
refrigerated storage recovery (%) | ||||
|
| ||||||
| 0 3 7 10 14 16 |
97.4 103.0 106.5 103.0 99.6 99.1 |
98.1 103.6 95.2 104.7 94.3 100.8 |
98.0 104.4 101.5 98.8 101.0 96.1 |
97.4 103.2 102.6 102.2 102.7 104.4 |
98.1 104.4 101.7 101.3 101.2 102.9 |
98.0 103.5 100.4 102.4 102.4 99.7 |
|
| ||||||
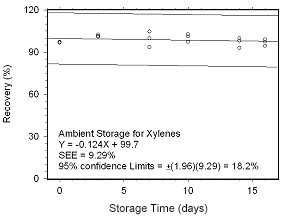 Figure 4.5.2.1 Ambient storage test for xylenes collected on SKC 575-002 Passive Samplers. |
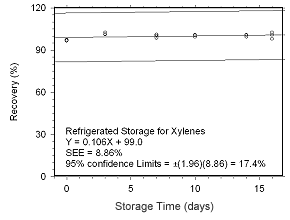 Figure 4.5.2.2 Regrigerated storage test for xylenes collected on SKC 575-002 Passive Samplers. | |
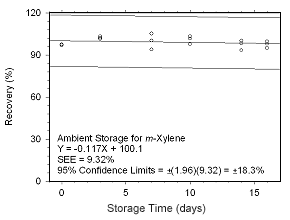 Figure 4.5.2.3 Ambient storage test for |
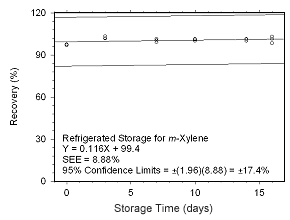 Figure 4.5.2.4 Regrigerated storage test for | |
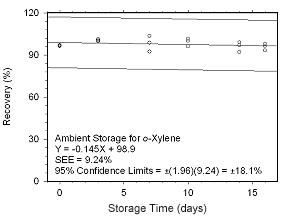 Figure 4.5.2.5 Ambient storage test for |
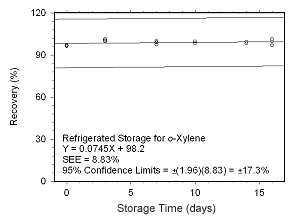 Figure 4.5.2.6 Regrigerated storage test for | |
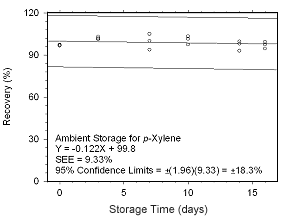 Figure 4.5.2.7 Ambient storage test for |
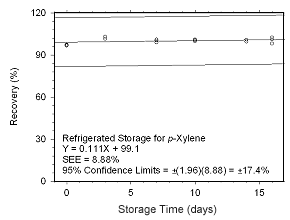 Figure 4.5.2.8 Regrigerated storage test for | |
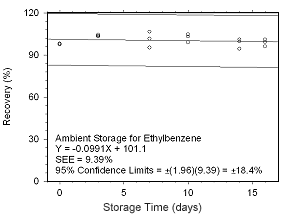 Figure 4.5.2.9 Ambient storage test for ethylbenzene collected on SKC 575-002 Passive Samplers. |
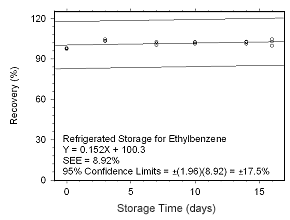 Figure 4.5.2.10 Regrigerated storage test for ethylbenzene collected on SKC 575-002 Passive Samplers. |
4.6 Reproducibility
Twelve samples (six charcoal tubes and six SKC
|
| |||||||||||||
| m-xylene | | | | |
o-xylene | | | | |
p-xylene | |||||||||
| theo µg/samp |
reported µg/samp |
recovery (%) |
deviation (%) |
theo µg/samp |
reported µg/samp |
recovery (%) |
deviation (%) |
theo µg/samp |
reported µg/samp |
recovery (%) |
deviation (%) | ||
|
| |||||||||||||
| 2555 2595 2623 2557 2564 2623 |
2552 2593 2427 2580 2593 2610 |
99.9 99.9 92.5 100.9 101.1 99.5 |
-0.1 -0.1 -7.5 0.9 1.1 -0.5 |
| | | | | | |
1189 1207 1221 1190 1193 1221 |
1245 1266 1158 1262 1263 1275 |
104.7 104.9 94.8 106.1 105.9 104.4 |
4.7 4.9 -5.2 6.1 5.9 4.4 |
| | | | | | |
1112 1129 1142 1129 1116 1142 |
1140 1158 1082 1152 1159 1166 |
102.5 102.6 94.7 102.0 103.9 102.1 |
2.5 2.6 -5.3 2.0 3.9 2.1 |
|
| |||||||||||||
|
| ||||||||
| xylenes | | | | |
ethylbenzene | ||||||
| theo µg/samp |
reported µg/samp |
recovery (%) |
deviation (%) |
theo µg/samp |
reported µg/samp |
recovery (%) |
deviation (%) | |
|
| ||||||||
| 4856 4931 4986 4876 4873 4986 |
4937 5017 4667 4994 5014 5051 |
101.7 101.7 93.6 102.4 102.9 101.3 |
1.7 1.7 -6.4 2.4 2.9 1.3 |
| | | | | | |
904.8 918.9 929.0 905.6 911.8 929.0 |
929.4 944.2 895.4 939.1 945.6 944.3 |
102.7 102.8 96.4 103.7 103.7 101.6 |
2.7 2.8 -3.6 3.7 3.7 1.6 |
|
| ||||||||
|
| |||||||||||||
| m-xylene | | | | |
o-xylene | | | | |
p-xylene | |||||||||
| theo µg/samp |
reported µg/samp |
recovery (%) |
deviation (%) |
theo µg/samp |
reported µg/samp |
recovery (%) |
deviation (%) |
theo µg/samp |
reported µg/samp |
recovery (%) |
deviation (%) | ||
|
| |||||||||||||
| 847.6 847.6 847.6 847.6 847.6 847.6 |
859.1 823.9 811.5 806.0 805.5 803.3 |
101.4 97.2 95.7 95.1 95.0 94.8 |
1.4 -2.8 -4.3 -4.9 -5.0 -5.2 |
| | | | | | |
401.3 401.3 401.3 401.3 401.3 401.3 |
430.8 417.1 408.8 399.0 406.3 398.9 |
107.4 103.9 101.9 99.4 101.2 99.4 |
7.4 3.9 1.9 -0.6 1.2 -0.6 |
| | | | | | |
372.8 372.8 372.8 372.8 372.8 372.8 |
404.9 389.1 383.0 381.0 380.2 380.4 |
108.6 104.4 102.7 102.2 102.0 102.0 |
8.6 4.4 2.7 2.2 2.0 2.0 |
|
| |||||||||||||
|
| ||||||||
| xylenes | | | | |
ethylbenzene | ||||||
| theo µg/samp |
reported µg/samp |
recovery (%) |
deviation (%) |
theo µg/samp |
reported µg/samp |
recovery (%) |
deviation (%) | |
|
| ||||||||
| 1622 1622 1622 1622 1622 1622 |
1695 1630 1603 1586 1592 1583 |
104.5 100.5 98.8 97.8 98.2 97.6 |
4.5 0.5 -1.2 -2.2 -1.8 -2.4 |
| | | | | | |
302.3 302.3 302.3 302.3 302.3 302.3 |
312.2 298.3 293.9 295.0 291.7 293.7 |
103.3 98.7 97.2 97.6 96.5 97.2 |
3.3 -1.3 -2.8 -2.4 -3.5 -2.8 |
|
| ||||||||
4.7 Sampler capacity
4.7.1 Charcoal tubes
The sampling capacity of charcoal tubes was tested by sampling
dynamically generated test atmospheres of mixed xylenes with SKC
4.7.2 SKC 575-002 Passive Samplers
The sampling rate and sampler capacity of SKC
|
| ||||||||
| time | m-xylene | o-xylene | p-xylene | ethylbenzene | ||||
| (h) | mL/min | RSD | mL/min | RSD | mL/min | RSD | mL/min | RSD |
|
| ||||||||
| 0.083 | 13.75 | 2.2 | 14.25 | 3.8 | 13.99 | 2.8 | 13.85 | 2.3 |
| 0.167 | 13.53 | 1.4 | 13.97 | 1.3 | 13.71 | 1.8 | 13.68 | 1.5 |
| 0.25 | 13.91 | 0.9 | 14.38 | 0.9 | 14.01 | 0.9 | 13.96 | 0.8 |
| 0.5 | 13.94 | 1.6 | 14.39 | 2.4 | 14.07 | 1.7 | 13.93 | 1.2 |
| 1 | 13.81 | 2.1 | 14.17 | 2.4 | 13.94 | 2.2 | 13.86 | 2.2 |
| 2 | 13.55 | 1.7 | 13.79 | 1.8 | 13.59 | 1.7 | 13.50 | 2.0 |
| 3 | 14.01 | 1.4 | 14.27 | 1.4 | 14.04 | 1.4 | 13.96 | 1.5 |
| 4 | 13.60 | 0.6 | 14.93 | 0.9 | 13.67 | 0.7 | 13.59 | 0.6 |
| 6 | 14.20 | 5.0 | 14.40 | 5.0 | 14.48 | 5.0 | 14.19 | 5.0 |
| 8 | 13.60 | 0.2 | 13.70 | 0.1 | 13.70 | 0.2 | 13.59 | 0.2 |
| 10 | 14.11 | 2.6 | 14.35 | 2.5 | 14.16 | 2.7 | 14.06 | 2.6 |
| mean | 13.82 | 14.24 | 13.94 | 13.83 | ||||
| RSD | 1.7 | 2.4 | 1.9 | 1.6 | ||||
|
| ||||||||
The preliminary sampling rate was determined by averaging the
values for the 0.5, 1, and 2 hour samples. Horizontal lines were
constructed 10% above and 10% below the preliminary sampling rate. All
the sampling rates were included in the calculated mean sampling rates
because all were between the two horizontal
lines.
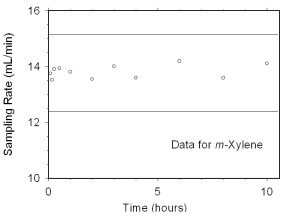 Figure 4.7.2.1 Sampler capacity data for m-xylene. |
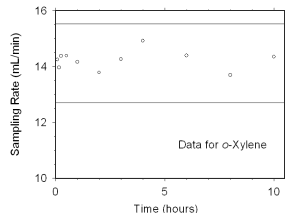 Figure 4.7.2.2 Sampler capacity data for o-xylene. | |
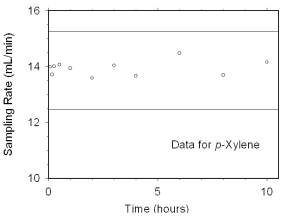 Figure 4.7.2.3 Sampler capacity data for p-xylene. |
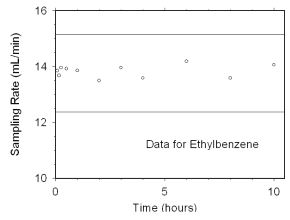 Figure 4.7.2.4 Sampler capacity data for ethylbenzene. |
4.8 Extraction efficiency and stability of extracted samples
Each laboratory must determine and confirm extraction efficiency periodically. Other solvents can be used in conjunction with this method provided the new solvent is tested. The new solvent should be tested as described below and the extraction efficiency must be greater than 75%.
A summary of the extraction efficiency results over the range of RQL
to 2 times the target concentration is presented in Table 4.8 for quick
reference.
|
| ||
| analyte | charcoal tubes |
SKC Passive Samplers |
|
| ||
| m-xylene | 96.3 | 96.1 |
| o-xylene | 93.8 | 89.4 |
| p-xylene | 96.1 | 95.3 |
| ethylbenzene | 97.2 | 99.1 |
|
| ||
4.8.1 Charcoal tubes
The extraction efficiencies (EEs) of the analytes were determined
by
|
| ||||||||
| level
|
sample number
| |||||||
| × OSHA PEL | µg per sample | 1 | 2 | 3 | 4 | 5 | 6 | mean |
|
| ||||||||
| RQL | 0.548 | 107.1 | 104.6 | 97.9 | 92.7 | 95.4 | 95.7 | 98.9 |
| 0.05 | 256 | 96.9 | 96.1 | 95.3 | 94.7 | 94.6 | 95.8 | 95.6 |
| 0.1 | 512 | 96.5 | 99.7 | 96.3 | 94.0 | 96.7 | 94.0 | 96.2 |
| 0.2 | 1024 | 96.5 | 95.2 | 94.6 | 96.5 | 95.6 | 94.4 | 95.5 |
| 0.5 | 2560 | 97.7 | 96.0 | 94.6 | 93.9 | 95.0 | 95.3 | 95.4 |
| 1.0 | 5136 | 97.0 | 96.5 | 96.5 | 97.6 | 98.1 | 97.9 | 97.3 |
| 2.0 | 10486 | 93.7 | 95.6 | 94.3 | 97.6 | 94.5 | 95.5 | 95.2 |
| wet (1.0) | 5136 | 98.0 | 96.4 | 97.7 | 97.4 | 96.6 | 97.9 | 97.3 |
|
The mean EE at concentrations from the RQL to 2 times the PEL (excepting the wet EE) is 96.3%. | ||||||||
|
| ||||||||
| level
|
sample number
| |||||||
| × OSHA PEL | µg per sample | 1 | 2 | 3 | 4 | 5 | 6 | mean |
|
| ||||||||
| RQL | 0.785 | 99.6 | 96.9 | 100.8 | 88.4 | 92.8 | 95.0 | 95.6 |
| 0.05 | 257 | 93.8 | 93.0 | 92.4 | 91.6 | 91.6 | 92.7 | 92.5 |
| 0.1 | 514 | 93.5 | 96.7 | 93.3 | 91.2 | 93.7 | 91.2 | 93.3 |
| 0.2 | 1028 | 93.6 | 92.3 | 91.8 | 93.6 | 92.6 | 91.4 | 92.6 |
| 0.5 | 2570 | 94.9 | 93.2 | 92.0 | 91.3 | 92.4 | 92.7 | 92.8 |
| 1.0 | 5179 | 94.6 | 94.0 | 94.0 | 95.1 | 95.4 | 95.4 | 94.8 |
| 2.0 | 10575 | 93.2 | 94.6 | 93.9 | 98.5 | 93.9 | 94.5 | 94.8 |
| wet (1.0) | 5179 | 95.2 | 93.8 | 95.1 | 94.8 | 93.9 | 95.1 | 94.7 |
|
The mean EE at concentrations from the RQL to 2 times the PEL (excepting the wet EE) is 93.8%. | ||||||||
|
| ||||||||
| level
|
sample number
| |||||||
| × OSHA PEL | µg per sample | 1 | 2 | 3 | 4 | 5 | 6 | mean |
|
| ||||||||
| RQL | 0.788 | 102.1 | 96.9 | 100.7 | 103.3 | 105.6 | 90.8 | 99.9 |
| 0.05 | 256 | 96.5 | 95.7 | 95.0 | 94.3 | 94.2 | 95.3 | 95.2 |
| 0.1 | 512 | 96.1 | 99.3 | 95.9 | 93.7 | 96.3 | 93.3 | 95.8 |
| 0.2 | 1024 | 96.2 | 94.8 | 94.2 | 96.1 | 95.1 | 94.0 | 95.1 |
| 0.5 | 2560 | 97.3 | 95.6 | 94.2 | 93.6 | 94.6 | 94.9 | 95.0 |
| 1.0 | 5118 | 96.6 | 96.0 | 96.0 | 97.2 | 97.7 | 97.5 | 96.8 |
| 2.0 | 10450 | 93.2 | 95.2 | 93.8 | 96.9 | 94.1 | 95.1 | 94.7 |
| wet (1.0) | 5118 | 97.5 | 95.9 | 97.3 | 96.9 | 96.2 | 97.5 | 96.9 |
|
The mean EE at concentrations from the RQL to 2 times the PEL (excepting the wet EE) is 96.1%. | ||||||||
|
| ||||||||
| level
|
sample number
| |||||||
| × OSHA PEL | µg per sample | 1 | 2 | 3 | 4 | 5 | 6 | mean |
|
| ||||||||
| RQL | 0.43 | 96.9 | 97.1 | 96.2 | 100.7 | 109.1 | 96.6 | 99.4 |
| 0.05 | 260 | 98.3 | 97.4 | 96.6 | 95.9 | 95.9 | 97.1 | 96.9 |
| 0.1 | 519 | 97.8 | 101.2 | 97.6 | 95.4 | 98.0 | 95.2 | 97.5 |
| 0.2 | 1038 | 97.9 | 96.5 | 95.8 | 97.9 | 96.8 | 95.8 | 96.8 |
| 0.5 | 2596 | 99.0 | 97.3 | 95.8 | 95.1 | 96.2 | 96.5 | 96.7 |
| 1.0 | 5216 | 98.2 | 97.7 | 99.0 | 98.8 | 99.3 | 99.1 | 98.7 |
| 2.0 | 10650 | 93.0 | 95.7 | 93.7 | 95.3 | 94.2 | 95.6 | 94.6 |
| wet (1.0) | 5216 | 99.3 | 97.7 | 99.0 | 98.6 | 97.9 | 99.3 | 98.6 |
|
The mean EE at concentrations from the RQL to 2 times the PEL (excepting the wet EE) is 97.2%. | ||||||||
|
| |||||
| punctured septa replaced
|
punctured septa retained
| ||||
| initial EE (%) |
EE after one day (%) |
difference (%) |
initial EE (%) |
EE after one day (%) |
difference (%) |
|
| |||||
| 97.0 | 97.4 | 0.4 | 97.6 | 96.1 | -1.5 |
| 96.5 | 97.1 | 0.6 | 98.1 | 96.7 | -1.4 |
| 96.5 | 98.2 | 1.7 | 97.9 | 95.9 | -2.0 |
| mean | mean | ||||
| 96.7 | 97.6 | 0.9 | 97.9 | 96.2 | -1.6 |
|
| |||||
|
| |||||
| punctured septa replaced
|
punctured septa retained
| ||||
| initial EE (%) |
EE after one day (%) |
difference (%) |
initial EE (%) |
EE after one day (%) |
difference (%) |
|
| |||||
| 94.6 | 95.1 | 0.5 | 95.1 | 93.6 | -1.5 |
| 94.0 | 94.6 | 0.6 | 95.4 | 94.1 | -1.3 |
| 94.0 | 95.8 | 1.8 | 95.4 | 93.2 | -2.2 |
| mean | mean | ||||
| 94.2 | 95.2 | 1.0 | 95.3 | 93.6 | -1.7 |
|
| |||||
|
| |||||
| punctured septa replaced
|
punctured septa retained
| ||||
| initial EE (%) |
EE after one day (%) |
difference (%) |
initial EE (%) |
EE after one day (%) |
difference (%) |
|
| |||||
| 96.6 | 97.0 | 0.4 | 97.2 | 95.6 | -1.6 |
| 96.0 | 96.7 | 0.7 | 97.7 | 96.2 | -1.5 |
| 96.0 | 97.8 | 1.8 | 97.5 | 95.3 | -2.2 |
| mean | mean | ||||
| 96.2 | 97.2 | 1.0 | 97.5 | 95.7 | -1.8 |
|
| |||||
|
| |||||
| punctured septa replaced
|
punctured septa retained
| ||||
| initial EE (%) |
EE after one day (%) |
difference (%) |
initial EE (%) |
EE after one day (%) |
difference (%) |
|
| |||||
| 98.2 | 98.6 | 0.4 | 98.8 | 97.2 | -1.6 |
| 97.7 | 98.2 | 0.5 | 99.3 | 97.8 | -1.5 |
| 99.0 | 99.4 | 0.4 | 99.1 | 97.0 | -2.1 |
| mean | mean | ||||
| 98.3 | 98.7 | 0.4 | 99.1 | 97.3 | -1.7 |
|
| |||||
4.8.2 SKC
The extraction efficiencies (EE) of the analytes were determined by
|
| ||||||||
| level
|
sample number
| |||||||
| × OSHA PEL | µg per sample | 1 | 2 | 3 | 4 | 5 | 6 | mean |
|
| ||||||||
| RQL | 1.422 | 93.0 | 90.1 | 99.0 | 89.9 | 105.4 | 100.9 | 96.4 |
| 0.05 | 73 | 98.6 | 97.7 | 97.6 | 97.2 | 98.2 | 97.6 | 97.8 |
| 0.1 | 145 | 95.9 | 95.9 | 93.7 | 95.0 | 95.8 | 95.3 | 95.3 |
| 0.2 | 290 | 93.2 | 93.6 | 94.2 | 94.1 | 94.9 | 95.6 | 94.3 |
| 0.5 | 725 | 94.1 | 95.1 | 95.6 | 96.3 | 94.7 | 97.1 | 95.5 |
| 1.0 | 1451 | 97.2 | 96.1 | 101.1 | 95.8 | 96.0 | 97.0 | 97.2 |
| 2.0 | 2902 | 99.3 | 95.3 | 96.0 | 95.8 | 96.4 | 95.8 | 96.4 |
| wet (1.0) | 1498 | 96.6 | 96.7 | 93.8 | 98.0 | 96.7 | 95.3 | 96.2 |
|
The mean EE at concentrations from the RQL to 2 times the PEL (excepting the wet EE) is 96.1%. | ||||||||
|
| ||||||||
| level
|
sample number
| |||||||
| × OSHA PEL | µg per sample | 1 | 2 | 3 | 4 | 5 | 6 | mean |
|
| ||||||||
| RQL | 1.075 | 83.9 | 76.4 | 86.3 | 87.8 | 86.6 | 88.1 | 84.9 |
| 0.05 | 73 | 92.3 | 90.9 | 91.0 | 90.4 | 91.8 | 91.5 | 91.3 |
| 0.1 | 146 | 89.8 | 89.6 | 87.5 | 89.0 | 89.9 | 89.3 | 89.2 |
| 0.2 | 292 | 87.7 | 88.0 | 88.4 | 88.4 | 89.0 | 89.8 | 88.6 |
| 0.5 | 728 | 88.4 | 89.2 | 89.8 | 90.4 | 88.8 | 91.2 | 89.6 |
| 1.0 | 1456 | 91.5 | 90.5 | 95.3 | 90.1 | 90.4 | 91.3 | 91.5 |
| 2.0 | 2913 | 93.7 | 88.7 | 90.7 | 90.5 | 90.9 | 90.4 | 90.8 |
| wet (1.0) | 1511 | 91.0 | 90.8 | 88.3 | 92.2 | 91.1 | 89.9 | 90.6 |
|
The mean EE at concentrations from the RQL to 2 times the PEL (excepting the wet EE) is 89.4%. | ||||||||
|
| ||||||||
| level
|
sample number
| |||||||
| × OSHA PEL | µg per sample | 1 | 2 | 3 | 4 | 5 | 6 | mean |
|
| ||||||||
| RQL | 1.542 | 98.2 | 95.7 | 92.2 | 90.9 | 97.3 | 99.3 | 95.6 |
| 0.05 | 73 | 97.6 | 97.2 | 96.9 | 96.0 | 97.4 | 96.7 | 97.0 |
| 0.1 | 145 | 95.0 | 94.8 | 93.0 | 94.3 | 95.1 | 94.7 | 94.5 |
| 0.2 | 290 | 92.4 | 92.9 | 93.4 | 93.3 | 94.2 | 94.7 | 93.5 |
| 0.5 | 725 | 93.3 | 94.3 | 94.8 | 95.4 | 93.9 | 96.2 | 94.7 |
| 1.0 | 1451 | 96.3 | 95.2 | 100.2 | 94.9 | 95.1 | 96.1 | 96.3 |
| 2.0 | 2902 | 99.7 | 94.5 | 95.2 | 95.0 | 95.6 | 94.9 | 95.8 |
| wet (1.0) | 1493 | 95.7 | 95.7 | 92.9 | 97.0 | 95.8 | 94.4 | 95.3 |
|
The mean EE at concentrations from the RQL to 2 times the PEL (excepting the wet EE) is 95.3%. | ||||||||
|
| ||||||||
| level
|
sample number
| |||||||
| × OSHA PEL | µg per sample | 1 | 2 | 3 | 4 | 5 | 6 | mean |
|
|
||||||||
| RQL | 1.058 | 99.7 | 105.0 | 93.7 | 88.5 | 95.2 | 103.4 | 97.6 |
| 0.05 | 74 | 102.2 | 101.2 | 101.1 | 100.2 | 101.2 | 100.8 | 101.1 |
| 0.1 | 147 | 99.1 | 99.1 | 97.3 | 98.6 | 99.3 | 98.6 | 98.7 |
| 0.2 | 294 | 96.3 | 96.8 | 97.5 | 97.2 | 98.4 | 98.8 | 97.5 |
| 0.5 | 736 | 97.3 | 98.4 | 98.9 | 99.5 | 98.3 | 100.5 | 98.8 |
| 1.0 | 1471 | 100.5 | 99.3 | 104.4 | 99.0 | 99.1 | 100.3 | 100.4 |
| 2.0 | 2942 | 102.6 | 98.3 | 99.1 | 98.8 | 99.6 | 98.9 | 99.6 |
| wet (1.0) | 1521 | 99.8 | 100.1 | 97.0 | 101.3 | 100.0 | 98.4 | 99.4 |
|
The mean EE at concentrations from the RQL to 2 times the PEL (excepting the wet EE) is 99.1%. | ||||||||
|
| |||||
| punctured septa replaced
|
punctured septa retained
| ||||
| initial EE (%) |
EE after one day (%) |
difference (%) |
initial EE (%) |
EE after one day (%) |
difference (%) |
|
| |||||
| 97.2 | 97.8 | 0.6 | 95.8 | 94.2 | -1.6 |
| 96.1 | 95.4 | -0.7 | 96.0 | 94.0 | -2.0 |
| 101.1 | 100.0 | -1.1 | 97.0 | 95.7 | -1.3 |
| mean | mean | ||||
| 98.1 | 97.7 | -0.4 | 96.3 | 94.6 | -1.6 |
|
| |||||
|
| |||||
| punctured septa replaced
|
punctured septa retained
| ||||
| initial EE (%) |
EE after one day (%) |
difference (%) |
initial EE (%) |
EE after one day (%) |
difference (%) |
|
| |||||
| 91.5 | 91.9 | 0.4 | 90.1 | 88.8 | -1.3 |
| 90.5 | 89.7 | -0.8 | 90.4 | 88.7 | -1.7 |
| 95.3 | 94.2 | -1.1 | 91.3 | 90.2 | -1.1 |
| mean | mean | ||||
| 92.4 | 91.9 | -0.5 | 90.6 | 89.2 | -1.4 |
|
| |||||
|
|
|||||
| punctured septa replaced
|
punctured septa retained
| ||||
| initial EE (%) |
EE after one day (%) |
difference (%) |
initial EE (%) |
EE after one day (%) |
difference (%) |
|
| |||||
| 96.3 | 96.9 | 0.6 | 94.9 | 93.5 | -1.4 |
| 95.2 | 94.6 | -0.6 | 95.1 | 93.3 | -1.8 |
| 100.2 | 99.3 | -0.9 | 96.1 | 94.9 | -1.2 |
| mean | mean | ||||
| 97.2 | 96.9 | -0.3 | 95.4 | 93.9 | -1.5 |
|
| |||||
|
| |||||
| punctured septa replaced
|
punctured septa retained
| ||||
| initial EE (%) |
EE after one day (%) |
difference (%) |
initial EE (%) |
EE after one day (%) |
difference (%) |
|
| |||||
| 100.5 | 101.0 | 0.5 | 99.0 | 97.3 | -1.7 |
| 99.3 | 98.7 | -0.6 | 99.1 | 97.1 | -2.0 |
| 104.4 | 103.4 | -1.0 | 100.3 | 98.8 | -1.5 |
| mean | mean | ||||
| 101.4 | 101.0 | -0.4 | 99.5 | 97.7 | -1.7 |
|
| |||||
4.9 Interferences (sampling)
4.9.1 Charcoal tubes
Retention
The ability of charcoal tubes to retain mixed xylenes after
collection was tested by sampling a test atmosphere containing 454
mg/m3, 211 mg/m3,
198 mg/m3, and 161
mg/m3
|
| ||||||||
| m-xylene | o-xylene | p-xylene | ethylbenzene | |||||
| (mg/m3) | (% mean) | (mg/m3) | (% mean) | (mg/m3) | (% mean) | (mg/m3) | (% mean) | |
|
| ||||||||
| 1st
set 1 2 3 mean 2nd set 1 2 3 |
443.9 428.5 447.4 439.9 444.3 453.4 449.5 |
101.0 103.1 102.2 |
203.9 194.6 206.1 201.5 203.9 208.3 207.2 |
101.2 103.4 102.8 |
192.6 185.7 194.1 190.8 192.4 196.7 195.0 |
100.8 103.1 102.2 |
158.6 154.8 159.5 157.6 159.2 161.9 159.5 |
101.0 102.7 101.2 |
|
| ||||||||
Low relative humidity
The ability of charcoal tubes to collect mixed xylenes at low
humidity was tested by sampling a test atmosphere containing 468
mg/m3, 218 mg/m3,
204 mg/m3, 166
mg/m3
Low concentration
The ability of charcoal tubes to collect mixed xylenes at low
concentrations was tested by sampling a test atmosphere containing 22
mg/m3, 10 mg/m3,
10 mg/m3, 8 mg/m3
Interference
The ability of charcoal tubes to collect mixed xylenes in the
presence of sampling interferences was tested by sampling a test
atmosphere containing 230 mg/m3, 107
mg/m3, 100 mg/m3,
82 mg/m3, 365
mg/m3, 372
mg/m3
4.9.2 SKC 575-002 Passive Samplers
Reverse diffusion
The ability of SKC
|
| ||||||||
| m-xylene | o-xylene | p-xylene | ethylbenzene | |||||
| (mg/m3) | (% mean) | (mg/m3) | (% mean) | (mg/m3) | (% mean) | (mg/m3) | (% mean) | |
|
| ||||||||
| 1st
set 1 2 3 mean 2nd set 1 2 3 |
450.6 449.4 419.5 439.8 440.7 449.0 449.4 |
100.2 102.1 102.2 |
206.9 208.0 191.9 202.3 201.4 206.0 205.9 |
99.6 101.8 101.8 |
195.7 197.0 182.0 191.6 191.2 195.0 195.3 |
99.8 101.8 101.9 |
161.2 162.8 149.9 158.0 157.9 160.8 161.4 |
100.0 101.8 102.2 |
|
| ||||||||
Low relative humidity
The ability of SKC
Low concentration
The ability of SKC
Interference
The ability of SKC
4.10 Qualitative analysis
The identity of suspected mixed xylenes can be confirmed by GC/mass spectrometry. Mass spectra for the analytes are presented below.
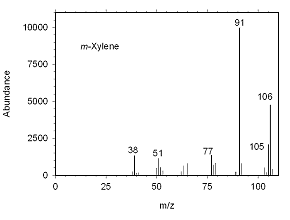 Figure 4.10.1 Mass spectrum for m-xylene. |
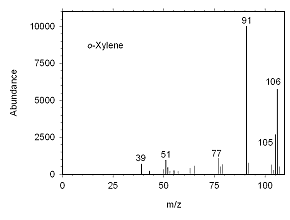 Figure 4.10.2 Mass spectrum for o-xylene. | |
| | ||
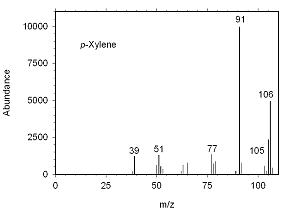 Figure 4.10.3 Mass spectrum for p-xylene. |
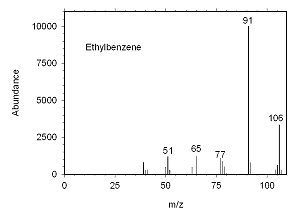 Figure 4.10.4 Mass spectrum for ethylbenzene. |
1. Kirk-Othmer Encyclopedia of Chemical
Technology; 3rd ed.; Grayson, M Ed.; John
Wiley & Sons: New York, 1984, Vol. 24; pp.
2. Documentation of the Threshold Limits Values and
Biological and Indices, 6th ed., American
Conference of Governmental Industrial Hygienists, Inc: Cincinnati, OH,
1991, Vol. III, pp.
3. OSHA Analytical Methods Manual; Vol. 1; U.S. Department of Labor, Occupational Safety and Health Administration; Directorate for Technical Support, OSHA Salt Lake Technical Center: Salt Lake City, UT, 1990; Method 7: Organic Vapors; American Conference of Governmental Hygienists (ACGIH): Cincinnati, OH; Publication No. 4542.
4. NIOSH Manual of Analytical Methods,
4th ed.; U.S. Department of Health and Human
Services, Public Health Service, Centers for Disease Control and
Prevention, National Institute for Occupational Safety and Health:
Cincinnati, OH, 1996, Method 1501: Hydrocarbons, Aromatic; (NIOSH)
Cincinnati, OH; Publication No.
5. Documentation of the Threshold Limits Values and
Biological and Indices, 6th ed., American
Conference of Governmental Industrial Hygienists, Inc: Cincinnati, OH,
1991, Vol. III, pp.
6. Documentation of the Threshold Limits Values and
Biological and Indices, 6th ed., American
Conference of Governmental Industrial Hygienists, Inc: Cincinnati, OH,
1991, Vol. I, pp.
7. 1998 TLVs and BEIs, Threshold Limit Values for
Chemical Substances and Physical Agents, ISBN:
8. Kirk-Othmer Encyclopedia of Chemical
Technology, 3rd ed.; Grayson, M Ed.; John
Wiley & Sons: New York, 1984, Vol. 24; pp.
9. ACS Publications; http://www.osha-slc.gov/pls/oshaweb/owaredirect.html?p_url=http://pubs.acs.org/hotartcl/cenear/960624/prod.html (accessed March 1999).
10. Kirk-Othmer Encyclopedia of Chemical
Technology, 3rd ed.; Grayson, M Ed.; John
Wiley & Sons: New York, 1984, Vol. 24; pp.
11. The Condensed Chemical Dictionary, 8th ed.; Revised by Hawley, G., Ed., Van Nostrand Reinhold: New York, 1971, p. 358, 942, 943.
12. The Condensed Chemical Dictionary, 8th ed.; Revised by Hawley, G., Ed., Van Nostrand Reinhold: New York, 1971, p. 358, 942, 943.
13. Kirk-Othmer Encyclopedia of Chemical
Technology, 3rd ed.; Grayson, M Ed.; John
Wiley & Sons: New York, 1984, Vol. 24; pp.
14. OSHA Computerized Information System Database, Chemical Sampling Information, Salt Lake Technical Center, Occupational Safety and Health Administration, Salt Lake City, UT March 1999.
15. OSHA Computerized Information System Database, Chemical Sampling Information, Salt Lake Technical Center, Occupational Safety and Health Administration, Salt Lake City, UT March 1999.
16. Kirk-Othmer Encyclopedia of Chemical
Technology, 3rd ed.; Grayson, M Ed.; John
Wiley & Sons: New York, 1984, Vol. 24; pp.
17. Documentation of the Threshold Limits Values
and Biological and Indices, 6th ed.,
American Conference of Governmental Industrial Hygienists, Inc:
Cincinnati, OH, 1991, Vol. II, pp.
18. Documentation of the Threshold Limits Values
and Biological and Indices, 6th ed.,
American Conference of Governmental Industrial Hygienists, Inc:
Cincinnati, OH, 1991, Vol. III, pp.
19. Documentation of the Threshold Limits Values
and Biological and Indices, 6th ed.,
American Conference of Governmental Industrial Hygienists, Inc:
Cincinnati, OH, 1991, Vol. I, pp.
20. The Condensed Chemical Dictionary, 8 th ed.; Revised by Hawley, G., Ed., Van Nostrand Reinhold: New York, 1971, p. 358, 942, 943.
21. Burright, D.; Chan, Y.; Eide, M.; Elskamp, C.;
Hendricks, W.; Rose, M. "Evaluation Guidelines for Air Sampling Methods
Utilizing Chromatographic Analysis", OSHA Salt Lake Technical Center, U.S.
Department of Labor: Salt Lake City, UT, 1999
22. Burright, D.; Chan, Y.; Eide, M.; Elskamp, C.;
Hendricks, W.; Rose, M. "Evaluation Guidelines for Air Sampling Methods
Utilizing Chromatographic Analysis", OSHA Salt Lake Technical Center, U.S.
Department of Labor: Salt Lake City, UT, 1999
