
TETRACHLOROETHYLENE
TRICHLOROETHYLENE
| Method number: | 1001 | ||
| Matrix: | Air | ||
| TWA
|
Ceiling (5 min)
|
Peak
| |
| Target concentration: | |||
| Tetrachloroethylene Trichloroethylene |
100 ppm (678 mg/m3) 100 ppm (537 mg/m3) |
200 ppm (1356 mg/m3) 200 ppm (1074 mg/m3) |
300 ppm (2034 mg/m3) 300 ppm (1612 mg/m3) |
| OSHA PEL: | |||
| Tetrachloroethylene Trichloroethylene |
100 ppm (678 mg/m3) 100 ppm (537 mg/m3) |
200 ppm (1356 mg/m3) 200 ppm (1074 mg/m3) |
300 ppm (2034 mg/m3) 300 ppm (1612 mg/m3) |
| ACGIH TLV: | |||
| Tetrachloroethylene Trichloroethylene |
25 ppm (169 mg/m3) 50 ppm (269 mg/m3) |
100 ppm (678
mg/m3)(STEL) 100 ppm (537 mg/m3)(STEL) |
none none |
| Procedure: | Adsorbent tube samples are collected by drawing
workplace air through coconut shell charcoal tubes using personal
sampling pumps. Diffusive samples are collected by exposing SKC
| ||
| Recommended sampling parameters: | |||
| Charcoal tubes
Sampling rate: Sampling time: |
TWA Samples
50 mL/min < 240 min |
Ceiling Samples
50 mL/min > 5 min |
Peak Samples
50 mL/min > 1 min |
| SKC 575-002 Samplers
Exposure time: |
< 240 min |
> 5 min |
> 5 min |
| Charcoal Tubes
|
SKC 575-002 Samplers
| |
| Reliable quantitation limit: (240-min samples) | ||
| Tetrachloroethylene Trichloroethylene |
14 ppb (98 µg/m3) 13 ppb (68 µg/m3) |
104 ppb (705 µg/m3) 61 ppb (325 µg/m3) |
| Standard error of estimate at: |
Tetrachloroethylene
|
Trichloroethylene
| ||
TWA: (240 min) Ceiling: (5 min) Peak: (1 min) |
Char. Tubes
5.1% 5.0% 5.2% |
SKC 575-002
9.0%* 9.6%* ---- |
Char. Tubes
5.1% 5.0% 5.1% |
SKC 575-002
9.1%* 9.1%* ---- |
| *For samples where sampling site atmospheric pressure and temperature are known. When either or both of these values are unknown, see Table 4.4.2 for applicable standard errors of estimate. | ||||
| Status of method: | Evaluated method. This method has been subjected to the established evaluation procedures of the OSHA SLTC Methods Development Team. | |||
| May 1999 | Carl J. Elskamp | |||
Methods Development Team
Industrial Hygiene Chemistry
Division
OSHA Salt Lake Technical Center
Salt Lake City UT
84115-1802
1. General Discussion
-
1.1 Background
1.1.1 History
The determinations of tetrachloroethylene and trichloroethylene in workplace air have consistently been among the top analyses for solvent vapors done at the OSHA Salt Lake Technical Center (SLTC). Until this present evaluation was completed, OSHA did not have fully validated methodologies to determine workplace exposures to vapors of either of these solvents. This method is an extension of the evaluation work recently completed for toluene where diffusive as well as active samplers were investigated.(1) As with toluene, exposure limits to both of these solvents are covered in Table
Z-2, thus tests were conducted at TWA, ceiling and peak target concentrations. After the toluene method was completed, by consensus it was decided that future evaluation work by the OSHA SLTC Methods Development Team for solvent vapors would first address charcoal tubes for active sampling as well as SKC575-002 Samplers (which contain Anasorb 747) for diffusive sampling. It was also decided that carbon disulfide (CS2) would be the first choice for the extraction solvent for each of these samplers. Using these two samplers and CS2 as the extraction solvent, sampling and analytical methods for both tetrachloroethylene and trichloroethylene were fully validated at TWA, ceiling and peak target concentrations.1.1.2 Toxic effects (This section is for information only and should not be taken as the basis of OSHA policy.)
Overexposure to tetrachloroethylene through inhalation can affect the central nervous system and liver. Prolonged exposure to 200 ppm causes dizziness, headache, confusion, nausea, and eye and mucous membrane irritation. These effects are intensified and include incoordination and drunkenness when concentrations exceed 600 ppm. When concentrations exceed 1000 ppm, anesthetic and respiratory depression effects can cause unconsciousness and death. One single, brief exposure to greater than 6000 ppm can be immediately dangerous to life. Prolonged exposures to greater than 200 ppm have reportedly caused reversible changes to the liver. Alcohol consumption before or after exposures may increase adverse effects. Repeated exposure to liquid tetrachloroethylene may defat the skin, causing dermatitis. It can cause significant discomfort if splashed in the eyes and can cause transient, reversible corneal damage.(2)
Exposure to high concentrations of trichloroethylene can cause headaches, vertigo, tremors, nausea with vomiting, fatigue, intoxication, unconsciousness, and even death. It is acutely toxic, primarily because of its anesthetic effect on the central nervous system. Exposure by inhalation is followed by rapid absorption into the bloodstream. Concentrations of 3000 ppm can cause unconsciousness in less than 10 minutes and anesthetic effects can occur after
20-minute exposure to 400 ppm. Skin contact may cause dermatitis.(3)1.1.3 Workplace exposure
About 50% of the demand for tetrachloroethylene is used in the dry cleaning industry where around 80% of all dry cleaners use it as their primary cleaning agent. It is also used as a feedstock in the production of fluorocarbons, which accounts for 30% of the current demand. About 12% of the demand is used as a degreaser for metals and the remaining 8% is utilized in miscellaneous applications such as transformer insulating fluid, chemical maskant formulations, and as a process solvent for desulfurizing coal.(4)
Around 85% of the trichloroethylene produced in the United States is used in degreasing of fabricated metal parts with the remaining 15% divided equally between exports and use in miscellaneous applications. Some of these applications include use as a component in adhesive and
paint-stripping formulations, a low temperatureheat-transfer medium, a nonflammable solvent carrier in industrial paint systems, and a solvent base for metal phosphatizing systems. It is also used in the textile industry as a carrier solvent for spotting fluids and as a solvent in waterless preparation dyeing and finishing operations. Because of the environmental regulations that have been placed on the use of trichloroethylene, for many of these applications it is gradually being replaced with alternative solvents such as1,1,1-trichloroethane. (5)1.1.4 Physical properties
Tetrachloroethylene:(6)
CAS number: 127-18-4 IMIS number: 2020 molecular weight: 165.83 boiling point: 121.2°C melting point: -22.7°C appearance: colorless liquid density: 1.623 molecular formula: C2Cl4 vapor pressure: 5.47 kPa at 40°C flash point: none odor: etheral(7) explosive limits: not applicable solubility: 15 mg is soluble in 100 g of water at 25°C; miscible with chlorinated solvents and most other common solvents. synonyms: Perchloroethylene; ethylene tetrachloride; tetrachloroethylene; Nema; Tetracap; Tetropil; Perclene; Ankilostin; Didakene.(8) structural formula: Cl2C=CCl2
Trichloroethylene:(9)
CAS number: 79-01-6 IMIS number: 2490 molecular weight: 131.39 boiling point: 87.3°C melting point: -86.5°C appearance: colorless liquid density: 1.464 molecular formula: C2HCl3 vapor pressure: 9.3 kPa at 25°C flash point: none odor: sweet smelling, chloroform-like explosive limits: 8% to saturation at 25°C solubility: 107 mg is soluble in 100 g of water at 20°C; miscible with many organic liquids. synonyms: Trichloroethene; ethinyl trichloride; Tri-Clene; Trilene; Trichloren; Algylen; Trimar; Triline; Trethylene; Westrosol; Chlorylen; Gemalgene; Germalgene.(10)structural formula: Cl2C=CHCl
This method was evaluated according to the OSHA SLTC "Evaluation
Guidelines for Air Sampling Methods Utilizing Chromatographic Analyses" (11)
in which the terms used and evaluation procedures followed for this method
are fully discussed and explained. The analyte air concentrations
throughout this method are based on the recommended sampling and
analytical parameters. TWA target concentration samples are based on 240
minutes and ceiling samples on 5 minutes of charcoal tube sampling and
diffusive sampler exposure. Peak samples are based on 1 minute of sampling
with charcoal tubes. Air concentrations listed in ppb and ppm are
referenced to 25°C and 101.3 kPa (760 mmHg).
- 1.2 Limit defining parameters
- 1.2.1 Detection limit of the analytical procedure
The detection limits of the analytical procedure are 16.2 pg of tetrachloroethylene and 11.2 pg of trichloroethylene. These are the amounts of analytes that will give detector responses that are significantly different from the responses of a reagent blank. (Section 4.1)
1.2.2 Detection limit of the overall procedure
The detection limits of the overall procedure are 0.35 µg of tetrachloroethylene per sample (4.3 ppb or 29 µg/m3) and 0.24 µg of trichloroethylene per sample (3.7 ppb or 20 µg/m3) for charcoal tubes and 0.66 µg of tetrachloroethylene per sample (31 ppb or 211 g/m3) and 0.33 µg of trichloroethylene per sample (18 ppb or 97 µg/m3) for SKC
575-002 Samplers. These are the amounts of analytes spiked on the respective samplers that will give detector responses that are significantly different from the responses of respective sampler blanks. (Section 4.2)1.2.3 Reliable quantitation limit
The reliable quantitation limits are 1.17 µg of tetrachloroethylene per sample (14 ppb or 98 µg/m3) and 0.81 µg of trichloroethylene per sample (13 ppb or 68 µg/m3) for charcoal tubes and 2.21 µg of tetrachloroethylene per sample (104 ppb or 705 µg/m3) and 1.11 µg of trichloroethylene per sample (61 ppb or 325 µg/m3) for SKC
575-002 Samplers. These are the amounts of analytes spiked on the respective samplers that will give detector responses that are considered the lower limits for precise quantitative measurements. (Section 4.2)1.2.4 Instrument calibration
The coefficient of determination (r2) is 0.99996 for tetrachloroethylene and 0.99993 for trichloroethylene over the ranges of 21.1 to 16,230 µg/mL and 19.0 to 12,874 µg/mL respectively. The coefficient of
non-determination (k2) is 4×10⁻⁵ for tetrachloroethylene and 7×10⁻⁵ for trichloroethylene over the same ranges. These ranges correspond to 0.5 times the ceiling target concentrations for SKC575-002 Samplers to 2 times the TWA target concentrations for charcoal tubes. (Section 4.3)1.2.5 Precision (overall procedure)
Charcoal tubes
The precisions of the overall procedure at the 95% confidence level from the ambient temperature storage tests for TWA, ceiling and peak samples for charcoal tubes are given in Table 1.2.5.1. The TWA samples are
240-min samples taken from 100-ppm atmospheres, the ceiling samples are5-min samples taken from200-ppm atmospheres and the peak samples are1-min samples taken from300-ppm atmospheres. (Section 4.4)Table 1.2.5.1
Precision of the Overall Procedure at the 95% Confidence Interval for Charcoal Tubes
analyte TWA samples ceiling samples peak samples
tetrachloroethylene
trichloroethylene±9.9%
±9.9%±9.9%
±9.9%±10.2%
±10.0%
SKC
575-002 SamplersThe precisions of the overall procedure at the 95% confidence level from the ambient temperature storage tests for TWA and ceiling samples for SKC
575-002 Samplers are given in Table 1.2.5.2. The TWA samples are240-min samples taken from100-ppm atmospheres and the ceiling samples are5-min samples taken from200-ppm atmospheres. There are different values given for each analyte at each of the levels, depending on whether both, either, or neither temperature or atmospheric pressure are known at the sampling site. If the temperature is not known, it is assumed to be 22.2 ± 15°C (72 ± 27°F) and a variability of ±7.7% is included. If the atmospheric pressure is not known, it is estimated from the sampling site elevation and a variability ±3% is included. (Section 4.4)Table 1.2.5.2
Precision of the Overall Procedure at the 95% Confidence Interval for SKC575-002 Samplers When Sampling Site Temperature (T) or Atmospheric Pressure (P) are Known or Unknown
analyte TWA samples ceiling samples
tetrachloroethylene
both T&P known
only T known
only P known
neither T nor P known
trichloroethylene
both T&P known
only T known
only P known
neither T nor P known
±17.7%
±18.6%
±23.3%
±23.9%
±17.9%
±18.8%
±23.3%
±24.1%
±18.9%
±19.8%
±24.1%
±24.9%
±17.9%
±18.9%
±23.5%
±24.1%
1.2.6 Recovery
The recovery of tetrachloroethylene from TWA samples in
17-day storage tests remained above 99.5% and 98.6% for charcoal tubes and SKC575-002 Samplers respectively when the samples were stored at ambient temperatures. The recovery of trichloroethylene from TWA samples in17-day storage tests remained above 98.5% and 96.8% for charcoal tubes and SKC575-002 Samplers respectively when the samples were stored at ambient temperatures. The recovery of tetrachloroethylene from ceiling samples in17-day storage tests remained above 100% and 97.3% for charcoal tubes and SKC575-002 Samplers respectively when the samples were stored at ambient temperatures. The recovery of trichloroethylene from ceiling samples in17-day storage tests remained above 98.8% and 97.4% for charcoal tubes and SKC575-002 Samplers respectively when the samples were stored at ambient temperatures. The recoveries of tetrachloroethylene and trichloroethylene from charcoal tube peak samples in17-day storage tests remained above 97.3% and 96.5% respectively when the samples were stored at ambient temperatures. (Section 4.5)1.2.7 Reproducibility
Six samples for both samplers at the TWA and ceiling target concentrations and six charcoal tube samples at the peak target concentrations that were collected from controlled test atmospheres, along with a draft copy of this procedure, were submitted to an SLTC service branch for analysis. All samples were analyzed 22 days after generation and had been stored at room temperature. No individual sample result deviated from its theoretical value by more than the precisions reported in Section 1.2.5. (Section 4.6)
2. Sampling Procedure
All safety practices that apply to the work area being sampled should be followed. The sampling equipment should be attached to the worker so that it will not interfere with work performance or safety.
-
2.1 Apparatus
2.1.1 Adsorbent tubes
Samples are collected with
7-cm ×4-mm i.d. ×6-mm o.d. glass sampling tubes packed with two sections of coconut shell charcoal. The tubes contain 100 mg of adsorbent in the front section and 50 mg in the back section. The adsorbent sections are held in place with glass wool plugs and are separated by urethane foam plugs. The ends of the glass sampling tubes are heat sealed. SKC Lot 2000 (SKC Inc., Fullerton, CA, Cat. No.226-01) charcoal tubes were used for this evaluation.Samples are collected using personal sampling pumps that have been calibrated, with sampling devices attached, to within ±5% at the recommended flow rate of 50 mL/min. The charcoal tubes are contained in commercially available tube holders (SKC Cat. No. 222-3-1) which are connected to the pumps with flexible,
non-crimpable tubing.2.1.2 Diffusive samplers
Samples are collected with SKC
575-002 Passive Samplers (SKC, Inc., Fullerton, CA). The samplers contain 500 mg of Anasorb 747 adsorbent. Lot 263 samplers were used in this evaluation.A thermometer and barometer to determine the sampling site conditions.
2.2 Reagents
None required
2.3 Technique
2.3.1 Charcoal tubes
Immediately before sampling, break off the ends of the charcoal tube. All tubes should be from the same lot.
Connect the sampling tube to the sampling pump with flexible,
non-crimpable tubing. It is desirable to utilize a sampling tube holder that shields the employee from the sharp, jagged end of the sampling tube. Position the tube so that sampled air first passes through the larger adsorbent section.Air being sampled should not pass through any hose or tubing before entering the sampling tube.
To avoid channeling, place the sampling tube vertically in the employee's breathing zone. Position the sampler so it does not impede work performance or safety.
After sampling for the appropriate time, immediately remove the sampling tube and seal it with plastic caps. Wrap each sample lengthwise with a Form
OSHA-21 seal.Submit at least one blank sampling tube with each sample set. Blanks should be handled in the same manner as samples, except no air is drawn through them.
Record air volume (in liters), sampling time (minutes) and sampling rate (mL/min) for each sample on Form
OSHA-91A. Also list any compounds that could be considered potential interferences, especially solvents, that are being used in the sampling area.
Ship any bulk sample(s) in a container separate from the air samples.
2.3.2 SKC
575-002 Samplers (In general, follow the manufacturer's instructions supplied with the samplers.)Remove the sampler, which is enclosed in an airtight clear bag, from the container. Keep the
O-ring, press-on cover, cover retainer, port plugs and Teflon tube for later use.Remove the sampler from the clear bag when ready to begin sampling. CAUTION - The monitor immediately begins to sample when it is removed from this bag.
Record the start time on the sampler label or on a Form
OSHA-91A. Attach the sampler to the worker near his/her breathing zone with the perforations in the sampler facing out. Assure that the area directly in front of the sampler is unobstructed throughout the sampling period.
At the end of the sampling period, immediately detach the sampler from the worker and with the
O-ring in place, attach the cover onto the sampler securing it with the cover retainer. Visually inspect theO-ring to be sure it is forming a proper seal around the entire circumference of the sampler. Record the stop time on sampler label or on a FormOSHA-91A. Prepare a blank by removing an unused sampler from its clear bag and immediately attaching a cover, with the
O-ring in place, onto it. Secure the cover with a retainer.Seal each sampler with an
OSHA-21 form.Verify that the sampling times are properly recorded on the Form
OSHA-91A for each sample. Also, identify blank samples on this form.Record the room temperature and atmospheric pressure (station pressure) of the sampling site on the Form
OSHA-91A. List any compounds that could be considered potential interferences, especially solvents, that are being used in the sampling area.
Submit the samplers to the laboratory for analysis as soon as possible. Include all port plugs and Teflon tubes which will be used in the laboratory analyses.
Ship any bulk sample(s) in a container separate from the air samples.
2.4 Sampler capacity (charcoal tubes) and sampler rate/capacity (SKC
575-002 Samplers)2.4.1 Charcoal tubes
The sampling capacity of the front section of charcoal sampling tubes was tested by sampling from a dynamically generated test atmosphere of tetrachloroethylene at 192.7 ppm (1306 mg/m3) and from another atmosphere containing 192.0 ppm (1031 mg/m3) of trichloroethylene. The samples were collected at nominal flow rates of 50 mL/min and the mean relative humidity of the tetrachloroethylene atmosphere was 65% at 26.1°C and the trichloroethylene atmosphere was 64.5% RH at 25.8°C. The breakthrough from the front sections of charcoal tubes did not exceed 0.1% when sampling from the tetrachloroethylene atmosphere for 9.5 hours (
 28.5 liters), indicating the capacity of charcoal tubes is
about 37 mg of tetrachloroethylene. The mean 5% breakthrough volume
was determined to be approximately 23.3 liters (
 7.8 hours) when sampling from the trichloroethylene
atmosphere, indicating a capacity of about 24 mg of trichloroethylene
before 5% breakthrough occurred. (Section 4.7.1)
7.8 hours) when sampling from the trichloroethylene
atmosphere, indicating a capacity of about 24 mg of trichloroethylene
before 5% breakthrough occurred. (Section 4.7.1)2.4.2 SKC
575-002 SamplersThe sampling rate and capacity of SKC
575-002 Samplers were determined by taking samples from a dynamically generated test atmosphere of tetrachloroethylene (nominal concentration of 200 ppm or 1356 mg/m3) and trichloroethylene (nominal concentration of 200 ppm or 1074 mg/m3) for increasing time intervals. A sampling rate of 13.06 mL/min (at 760 mmHg, 25°C) and capacity of greater than 12 mg per sample for tetrachloroethylene and a sampling rate of 14.24 mL/min (at 760 mmHg, 25°C) and capacity of greater than 10 mg per sample for trichloroethylene were obtained from this test. (Section 4.7.2)2.5 Extraction efficiency
It is the responsibility of each analytical laboratory to determine the extraction efficiency for each analyte because the internal standard, adsorbent material, reagents and laboratory techniques may influence the results and be different than the those listed in this evaluation.
2.5.1 Charcoal tubes (Section 4.8.1)
The mean respective extraction efficiencies for tetrachloroethylene and trichloroethylene from SKC Lot 2000 charcoal tubes over the range of the RQL to 2 times the target concentrations are 98.8% and 99.3% for TWA levels, 98.3% and 98.8% for ceiling levels and 98.5% and 99.0% for peak levels. The mean extraction efficiencies for the RQL and all of the eighteen other concentrations are 98.5% for tetrachloroethylene and 99.1% for trichloroethylene.
The mean respective extraction efficiencies for tetrachloroethylene and trichloroethylene from SKC Lot 2000 charcoal tubes that had humid air drawn through them before they were spiked at the target concentrations are 98.9% and 99.5% for TWA levels, 98.6% and 98.9% for ceiling levels and 98.6% and 98.8% for peak levels.
Extracted samples remain stable for at least 24 h.
2.5.2 SKC
575-002 Samplers (Section 4.8.2)The mean respective extraction efficiencies for tetrachloroethylene and trichloroethylene from SKC
575-002 Samplers over the ranges of the RQL to 2 times the target concentrations are 96.2% and 97.7% for TWA levels and 94.9% and 97.3% for ceiling levels. The mean extraction efficiencies for the RQL and all of the twelve other concentrations are 95.4% for tetrachloroethylene and 97.5% for trichloroethylene.The mean respective extraction efficiencies for tetrachloroethylene and trichloroethylene from SKC
575-002 Samplers that had been exposed to humid air before they were spiked at the target concentrations are 93.2% and 95.3% for TWA levels and 94.0% and 96.0% for ceiling levels.Extracted samples remain stable for at least 24 h.
2.6 Recommended air volume and sampling rate for charcoal tube samples and recommended exposure time for SKC
575-002 Samplers2.6.1 For TWA (long-term) samples, sample up to 12 L of air at 50 mL/min (up to 240 min) when using charcoal tubes. When using SKC
575-002 Samplers, sample for as long as 240 minutes.2.6.2 For ceiling samples, sample greater than 0.25 L of air at 50 mL/min (greater than 5 min) when using charcoal tubes. When using SKC
575-002 Samplers, sample for greater than 5 minutes.2.6.3 For peak samples, sample at least 0.05 L of air at 50 mL/min (at least 1 min) when using charcoal tubes. When using SKC
575-002 Samplers, sample for 5 minutes or longer.2.6.4 When
short-term samples are collected, the air concentrations equivalent to the reliable quantitation limits become larger. For example, the respective reliable quantitation limits for tetrachloroethylene and trichloroethylene samples collected on charcoal tubes become 0.71 ppm (4.8 mg/m3) and 0.60 ppm (3.2 mg/m3) for5-min samples and 3.6 ppm (24 mg/m3) and 3.0 ppm (16 mg/m3) for1-min samples.2.7 Interferences (sampling)
2.7.1 The presence of other contaminants in the sampled air can potentially reduce the capacity of the samplers to collect the analyte of interest. Also, the sampling rates of the SKC
575-002 Samplers could possibly be altered. Interference studies were performed by sampling for 240 minutes from a test atmosphere (70% RH, 24°C, 659 mmHg) containing 100 ppm of tetrachloroethylene with 83 ppm of methylene chloride, 70 ppm of isopropyl alcohol, 71 ppm of2-butanone (MEK), 26 ppm of butyl acetate, 17 ppm of dioxane and 16 ppm of amyl acetate. Another test was done by sampling for 240 minutes from a test atmosphere (59% RH, 27°C, 659 mmHg) containing 100 ppm of trichloroethylene plus the aforementioned solvent vapors. The presence of these compounds, which may represent typical substances that may be collected with tetrachloroethylene or trichloroethylene, did not have a significant effect on sample results using either of the samplers. (Section 4.9.1)2.7.2 A reverse diffusion study for the SKC
575-002 Samplers and a stripping study for the charcoal tubes was performed by sampling an atmosphere (65% RH, 26C, 651 mmHg) containing 193 ppm of tetrachloroethylene and 194 ppm trichloroethylene for 60 minutes with six of each samplers. Three samplers from each set were additionally subjected to 180 minutes of the same atmosphere without the analytes present to determine if any of the collected solvents diffused off of the SKC575-002 Samplers and also whether it was stripped off of the charcoal tubes. Upon analysis of the samples, the mean recovery of the removed samplers versus the mean recovery of the samplers that were additionally exposed to the atmosphere without analyte was greater than 90% for both samplers, indicating that reverse diffusion and stripping are not significant. (Section 4.9.2)2.7.3 Sampling from relatively dry atmospheres was investigated by sampling from an atmosphere (3% RH, 26°C, 650 mmHg) containing 198 ppm of tetrachloroethylene and 199 ppm of trichloroethylene for 240 minutes with both samplers. Sampling from dry atmospheres did not have a significant effect on the results for either of the analytes using either of the samplers. (Section 4.9.3)
2.7.4 Sampling from atmospheres containing low concentrations of analytes was investigated by sampling from an atmosphere (67% RH, 26°C, 649 mmHg) containing 9.0 ppm of tetrachloroethylene and 10.7 ppm of trichloroethylene for 240 minutes with both samplers. Sampling these low concentrations did not have a significant effect on results using either of the samplers for either of the analytes. (Section 4.9.4)
2.7.5 Suspected interferences should be reported to the laboratory with submitted samples.
3. Analytical Procedure
Adhere to the rules set down in your Chemical Hygiene Plan, which is mandated by the OSHA laboratory standard. Avoid skin contact and inhalation of all chemicals.
-
3.1 Apparatus
3.1.1 A GC equipped with a flame ionization detector. For this evaluation, a
Hewlett-Packard 6890 Series Gas Chromatograph equipped with an Automatic Liquid Sampler was used.3.1.2 A GC column capable of separating analyte from the extraction solvent, internal standard and any interferences. A
60-m ×0.32-mm i.d. fused silica Stabilwax capillary column (Cat. No. 10657) with a1.0-µm df from Restek Corporation (Bellefonte, PA) was used in this evaluation.3.1.3 An electronic integrator or some other suitable means of measuring peak areas. A Waters Millennium 2020 Networking Computer System was used in this evaluation.
3.1.4
Two-milliliter vials withTeflon-lined caps.3.1.5 A dispenser capable of delivering 1.0 mL of extraction solvent to prepare standards and samples. If a dispenser is not available, a 1.0-mL volumetric pipet may be used.
3.1.6 A sampler rack (SKC Cat. No.
226-04-5) and a specialized shaker (SKC Cat. No.226D-03-1) to facilitate the extraction of SKC575-002 Samplers.3.2 Reagents
3.2.1 Tetrachloroethylene (CAS
127-18-4), reagent grade. Aldrich A.C.S. reagent grade (Cat. No.44,378-6) Lot TR06115EN, was used in this evaluation.3.2.2 Trichloroethylene (CAS
79-01-6), reagent grade. Aldrich A.C.S. reagent grade (Cat. No.25,140-2) Lot DR0306BQ, was used in this evaluation.3.2.3 Carbon disulfide (CS2) [CAS
75-15-0], chromatographic grade. Aldrich 99.9+% low benzene grade (Cat. No.34,227-0) Lot 1054JQ, was used in this evaluation.3.2.4 A suitable internal standard, reagent grade. Supelco Neat EPA Standard, Lot LA59304, ethylbenzene (CAS
100-41-4) was used in this evaluation.3.2.5 The extraction solvent consists of CS2 containing 1.0 milliliter of internal standard per liter of solution (1µL/mL).
3.2.6 GC grade nitrogen, air and hydrogen.
3.3 Standard preparation
3.3.1 Prepare standards by injecting microliter amounts of analyte into vials containing 1.0 mL (for charcoal tubes) or 2.0 mL (for SKC
575-002 Samplers) of extraction solvent delivered from the same dispenser used to extract samples. For example, inject 5.00 µL of tetrachloroethylene into a vial containing 1.0 mL of extraction solvent. Assuming the density of tetrachloroethylene is 1.623 g/mL, (which is dependent on the temperature of the tetrachloroethylene) this standard contains 8115 µg of tetrachloroethylene per milliliter.3.3.2 Bracket sample concentrations with standard concentrations. If upon analysis, sample concentrations fall outside the range of prepared standards, prepare and analyze additional standards to ascertain the linearity of instrument response or dilute high samples with extraction solvent and reanalyze the diluted samples.
3.4 Sample preparation
3.4.1 Charcoal tube samples
Transfer each section of adsorbent from the sampling tubes to separate labeled vials. Discard the glass tubes, urethane foam plugs and glass wool plugs.
Add 1.0 mL of extraction solvent to each vial using the same dispenser as used for preparation of standards.
Immediately cap the vials.
Allow the adsorbent sections to extract for 30 minutes. Periodically apply gentle agitation to the vials during the extraction period.
3.4.2 SKC
575-002 Samplers (In general, follow the manufacturer's instructions supplied with the samplers.)Cut off the ends of the two protruding tubes of each sampler with a razor blade or sharp knife.
Slowly add 1.0 mL of extraction solvent through one of the protruding tubes (ports). After about 30 seconds, slowly add another 1.0 mL of extraction solvent and then immediately insert plugs into the ports.
Mount the samplers in the sampler rack (SKC Cat. No.
226-04-5) of a specialized shaker (SKC Cat. No.226D-03-1) and shake the samplers for 1 hour.Transfer each extracted sample by removing the plugs from the sampler ports, firmly inserting the tapered end of a supplied Teflon tube into the outer port and carefully pouring the solution through the Teflon tube into a labeled autosampler vial.
3.5 Analysis
3.5.1 GC conditions
zone temperatures: column-
injector-
detector-100°C (isothermal)
200°C
250°Cgas flows: hydrogen (carrier)-
nitrogen (makeup)-
hydrogen (flame)-
air-2.5 mL/min (89 kPa head pressure)
50 mL/min
38 mL/min
450 mL/mininjection volume: 1.0 µL (with a 15:1 split) signal range: 0 column: 60-m × 0.32-mm i.d. fused silica, Stabilwax 1.0-µm df retention times: trichloroethylene-
tetrachloroethylene-
ethylbenzene-
(CS2- 2.9 min)4.7 min
5.3 min
7.6 min (internal standard)
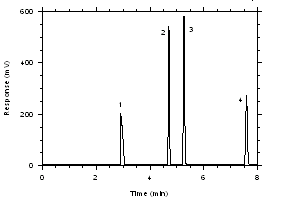 Figure 3.5.1.1. Chromatogram of a standard near the TWA target concentrations for charcoal tubes. Key: (1) CS2, (2) trichloroethylene, (3) tetrachloroethylene, (4) ethylbenzene. |
 Figure 3.5.1.2. Chromatogram of a standard near the TWA target concentrations for SKC 575-002 Samplers. Key: (1) CS2, (2) trichloroethylene, (3) tetrachloroethylene, (4) ethylbenzene. | |
 Figure 3.5.1.3. Chromatogram of a standard near the ceiling target concentrations for charcoal tubes. Key: (1) CS2, (2) trichloroethylene, (3) tetrachloroethylene, (4) ethylbenzene. |
 Figure 3.5.1.4. Chromatogram of a standard near the ceiling target concentrations for SKC 575-002 Samplers. Key: (1) CS2, (2) trichloroethylene, (3) tetrachloroethylene, (4) ethylbenzene. |
Figure 3.5.1.5. Chromatogram of a standard near the peak target concentrations charcoal tubes. Key: (1) CS2, (2) trichloroethylene, (3) tetrachloroethylene, (4) ethylbenzene.
-
3.5.2 Peak areas are measured by an integrator or other suitable means.
3.5.3 An internal standard (ISTD) calibration method is used. A calibration curve is prepared by analyzing standards and plotting micrograms of analyte per milliliter versus
ISTD-corrected area counts of the analyte peaks. Sample concentrations must be bracketed by standards.
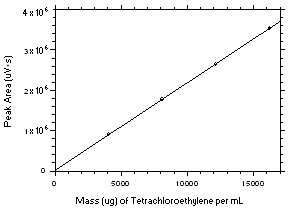 Figure 3.5.3.1. Calibration curve for tetrachloroethylene constructed from the data in Table 4.3.1. The equation of the line is Y = 216.8X + 10648. |
 Figure 3.5.3.2. Calibration curve for trichloroethylene constructed from the data in Table 4.3.2. The equation of the line is Y = 224.8X - 827. |
-
3.6 Interferences (analytical)
3.6.1 Any compound that produces a response on a flame ionization detector and has the same general retention time of the analyte of interest or the internal standard is a potential interference. Possible interferences should be reported to the laboratory with submitted samples by the industrial hygienist. These interferences should be considered before samples are extracted.
3.6.2 GC parameters (i.e. column and column temperature) may be changed to possibly circumvent interferences.
3.6.3 The extraction efficiencies from "wet" samplers for both analytes at the various target concentrations were investigated. The extraction efficiencies were comparable to those obtained from samplers that had not been exposed to humid air. (Section 2.5)
3.6.4 When necessary, the identity or purity of an analyte peak may be confirmed with additional analytical data, such as mass spectrometry. (Section 4.10)
3.7 Calculations
3.7.1 Charcoal tube samples
The analyte concentration for samples is obtained from the appropriate calibration curve in terms of micrograms per milliliter, uncorrected for extraction efficiency. The air concentration is calculated using the following formulae. The back (50-mg) section is analyzed primarily to determine if there was any breakthrough from the front section during sampling. If a significant amount of analyte is found on the back section (e.g., greater than 25% of the amount found on the front section), this fact should be reported with sample results. If any analyte is found on the back section, it is added to the amount found on the front section. This total amount is then corrected by subtracting the total amount (if any) found on the blank.
mg/m3 = (µg of analyte per mL)(1.0 mL) / ((L of air sampled)(extraction efficiency))
where L of air sampled is [(sampling time, min)(sampling rate, mL/min)] / 1000
extraction efficiency is expressed in decimal fractionppm = (mg/m3)(24.46) / (molecular weight of analyte)
where 24.46 is the molar volume at 25°C and 101.3 kPa (760 mmHg)
MW of tetrachloroethylene is 165.83
MW of trichloroethylene is 131.393.7.2 SKC 575-002 Samplers
The analyte concentration for samples is obtained from the appropriate calibration curve in terms of micrograms per milliliter, uncorrected for extraction efficiency. The air concentration is calculated using the following formulae.
mg/m3 = (µg of analyte per mL)(2 mL) / ((L of air sampled)(extraction efficiency))
where L of air sampled is [(sampling time, min)(sampling rate, mL/min)]/1000
extraction efficiency is expressed in decimal fraction
Sampling rate for tetrachloroethylene is (13.06)(760/P)(T/298.2)1.5
Sampling rate for trichloroethylene is (14.24)(760/P)(T/298.2)1.5
P is the sampling site atmospheric pressure (mmHg)
T is the sampling site temperature (K)If the sampling site temperature is not provided, assume that it is 22.2°C (295.4 K, 72°F). If the sampling site atmospheric pressure is not given, calculate an approximate value (P) based on the sampling site elevation (E) from the following equation. P = (3.887 × 10⁻⁷)(E2) - (2.7467 × 10⁻²)(E) + 760 ppm = (mg/m3)(24.46) / (molecular weight of analyte)
where 24.46 is the molar volume at 25°C and 101.3 kPa (760 mmHg)
MW of tetrachloroethylene is 165.83
MW of trichloroethylene is 131.39
4. Backup Data
This method was evaluated according to the OSHA SLTC "Evaluation Guidelines for Air Sampling Methods Utilizing Chromatographic Analyses"(12) in which the terms used and evaluation procedures followed for this method are fully discussed and explained.
-
4.1 Detection limit of the analytical procedure (DLAP)
The DLAP is measured as the mass of analyte introduced onto the chromatographic column. Ten analytical standards were prepared in equal increments with the highest standard containing 2.43 µg of tetrachloroethylene and 1.90 µg of trichloroethylene per mL. Injection of the highest standards produced peaks approximately 10 times the baseline noise of a reagent blank when a
1-µL injection with a 1:15 split was made onto the GC column. Standards, plus a reagent blank, were analyzed and the data obtained were used to determine the required parameters (A and SEE) for the calculation of the DLAP for each analyte. SEE values of 18.3 and 15.3 and A values of 3.392 and 4.089 were obtained for tetrachloroethylene and trichloroethylene respectively. The DLAP was calculated to be 16.2 pg for tetrachloroethylene and 11.2 pg for trichloroethylene.
|
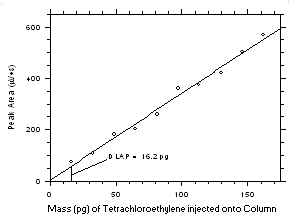 Figure 4.1.1 Plot of data from Table 4.1.1 to determine the DLAP. The equation of the line is | ||||||||||||||||
|
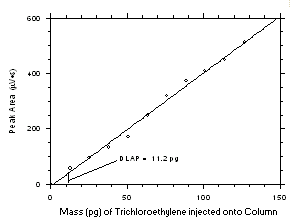 Figure 4.1.2 Plot of data from Table 4.1.2 to determine the DLAP. The equation of the line is | ||||||||||||||||
-
4.2 Detection limit of the overall procedure (DLOP) and reliable quantitation limit (RQL)
The DLOP is measured as mass per sample and expressed as equivalent air concentrations, based on the recommended sampling parameters. Ten samplers of each type were spiked with equal descending increments of tetrachloroethylene and trichloroethylene such that the highest sampler loadings were 2.43 µg/sample and 1.90 µg/sample for the charcoal tubes and 4.87 µg/sample and 3.80 µg/sample for SKC
575-002 Samplers of tetrachloroethylene and trichloroethylene respectively. (The SKC575-002 Samplers were spiked with twice the amounts of analytes compared to charcoal tubes because they are extracted with 2.0 mL of solvent versus 1.0 mL for the charcoal tubes.) These are the amounts, when spiked on the samplers, that would produce peaks approximately 10 times the baseline noise for sample blanks. These spiked samplers, plus blanks, were analyzed with the recommended analytical parameters, and the data obtained used to calculate the required parameters (A and SEE) for the calculation of the DLOPs. Respective A and SEE values of 238.1 and 27.9 for tetrachloroethylene and 264.8 and 21.5 for trichloroethylene were obtained from charcoal tube samples to give DLOPs of 0.35 µg of tetrachloroethylene per sample (4.3 ppb or 29µg/m3) and 0.24 µg of trichloroethylene sample (3.7 ppb or 20 g/m3). Respective A and SEE values of 107.2 and 23.7 for tetrachloroethylene and 118.1 and 13.1 for trichloroethylene were obtained from SKC575-002 Samplers to give DLOPs of 0.66 µg of tetrachloroethylene per sample (31 ppb or 211 µg/m3) and 0.33 µg of trichloroethylene sample (18 ppb or 97 µg/m3).
|
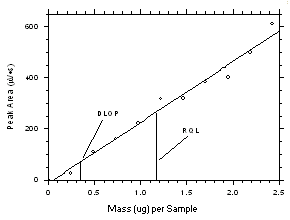 Figure 4.2.1 Plot of data from Table 4.2.1 to determine the DLAP. The equation of the line is | |||||||||||
|
 Figure 4.2.2 Plot of data from Table 4.2.2 to determine the DLAP. The equation of the line is | |||||||||||
|
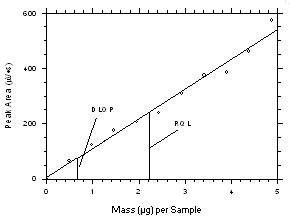 Figure 4.2.3. Plot of data from Table 4.2.3 to determine the DLOP/RQL for tetrachloroethylene from SKC 575-002 Samplers. The equation of the line is | |||||||||||
|
 Figure 4.2.4. Plot of data from Table 4.2.4 to determine the DLOP/RQL for trichloroethylene from SKC 575-002 Samplers. The equation of the line is | |||||||||||
-
The RQL is considered the lower limit for precise quantitative measurements. It is determined from the regression line data obtained for the calculation of the DLOP. The RQLs were calculated to be 1.17 µg per sample (14 ppb or 98 µg/m3) and 0.81 µg per sample (13 ppb or 68 µg/m3) respectively for tetrachloroethylene and trichloroethylene from charcoal tubes and 2.21 µg per sample (104 ppb or 705 µg/m3) and 1.11 µg per sample (61 ppb or 325 µg/m3) respectively for tetrachloroethylene and trichloroethylene from SKC
575-002 Samplers. The recoveries at these levels are 99.5%, 98.8%, 97.2% and 97.6% respectively.
Figure 4.2.5. Chromatogram near the RQLs.
Key: (1) CS2, (2) trichloroethylene,
(3) tetrachloroethylene, (4) ethylbenzene.4.3 Instrument calibration
The instrument was calibrated using standards over concentration ranges equivalent to 0.5 times the ceiling target concentrations for SKC
575-002 Samplers to 2 times the TWA target concentrations for charcoal tube samples. Calibration curves were constructed as shown in Section 3.5.3 from six replicate injections of five standards equally spaced over these ranges. The coefficient of determination (r2) is 0.99996 for tetrachloroethylene and 0.99993 for trichloroethylene. The coefficient ofnon-determination (k2) is 4×10⁻⁵ for tetrachloroethylene and 7×10⁻⁵ for trichloroethylene.Table 4.3.1
Tetrachloroethylene Standards used for Instrument Calibration
standard concn
(µg/mL)response in peak areas (µV • s) × 10-3
21.1
4058
8115
12172
162304.6945
904.56
1775.2
2649.1
3529.24.6979
903.81
1770.0
2645.5
3531.84.7172
904.63
1771.2
2644.1
3524.84.6936
903.90
1772.3
2650.8
3525.04.6995
902.18
1769.5
2643.3
3527.84.6970
904.97
1772.2
2642.9
3521.7
Table 4.3.2
Trichloroethylene Standards used for Instrument Calibration
standard concn
(µg/mL)response in peak areas (µV • s) × 10-3
19.0
3219
6437
9656
128744.3280
715.66
1461.8
2177.6
2891.24.3264
714.21
1451.5
2175.1
2898.64.3216
711.91
1455.5
2174.7
2887.34.2951
711.87
1457.2
2184.8
2880.94.2926
709.61
1456.7
2170.6
2879.54.2970
713.48
1455.2
2169.3
2878.0
4.4 Precision (overall procedure)
The precision of the overall procedure is determined from the storage data in Section 4.5. The SEEs and precisions of the overall procedure are given in the following tables for charcoal tubes and SKC
575-002 Samplers. All values are based on the ambient storage tests in Section 4.5.Table 4.4.1
SEEs and Precisions of the Overall Procedure at the 95% Confidence Interval for Charcoal Tube Samples
TWA samples
ceiling samples
peak samples
analyte SEE precision SEE precision SEE precision
tetrachloroethylene
trichloroethylene5.06%
5.06%±9.9%
±9.9%5.05%
5.04%±9.9%
±9.9%5.21%
5.09%±10.2%
±10.0%
Table 4.4.2
SEEs and Precisions of the Overall Procedure at the 95% Confidence Interval for SKC575-002 Samplers when Sampling Site Temperature (T) or Atmospheric Pressure (P) are Known or Unknown
TWA samples
ceiling samples
analyte SEE precision SEE precision
tetrachloroethylene
both T&P known
only T known
only P known
neither T nor P known
trichloroethylene
both T&P known
only T known
only P known
neither T nor P known
9.03%
9.51%
11.9%
12.2%
9.13%
9.61%
11.9%
12.3%
±17.7%
±18.6%
±23.3%
±23.9%
±17.9%
±18.8%
±23.3%
±24.1%
9.63%
10.1%
12.3%
12.7%
9.14%
9.62%
12.0%
12.3%
±18.9%
±19.8%
±24.1%
±24.9%
±17.9%
±18.9%
±23.5%
±24.1%
4.5 Storage tests
Charcoal tube storage samples were prepared by sampling at 50 mL/min from controlled test atmospheres that were at approximately 80% RH and 22.2°C and at an atmospheric pressure of 655 mmHg. Storage samples for SKC
575-002 Samplers were prepared by exposing them to the same atmospheres as were generated for the charcoal tube samples. The flow of the atmospheres through the exposure chamber provided for face velocities of approximately 0.4 m/s on the SKC575-002 Samplers. TWA samples were prepared by sampling from100-ppm atmospheres for 240 minutes, ceiling samples from200-ppm atmospheres for 5 minutes and peak samples from300-ppm atmospheres for 1 minute. Six samples for each set were analyzed immediately after generation, fifteen were stored in a refrigerator at 0°C and fifteen were stored in a closed drawer at ambient temperatures of20-25°C. At approximatelythree-day intervals, three samples were selected from each of the storage sets and analyzed.
|
| |||||||
| time (days) |
refrigerated storage recovery (%) |
ambient storage recovery (%) | |||||
|
| |||||||
| 0 0 6 10 13 15 17 |
98.7 99.6 101.8 99.4 99.3 99.6 99.0 |
98.2 99.9 99.4 99.8 100.5 99.6 100.7 |
100.5 99.6 100.4 100.9 100.2 99.3 99.8 |
100.6 102.8 101.7 99.4 99.3 99.6 100.0 |
102.0 100.4 98.7 99.3 100.0 99.0 99.3 |
99.9 101.3 100.0 100.8 99.8 99.3 98.7 | |
|
| |||||||
 Figure 4.5.1.1. Tetrachloroethylene refrigerated storage test on charcoal tubes, 240-minute samples at 100 ppm. |
 Figure 4.5.1.2. Tetrachloroethylene ambient storage test on charcoal tubes, 240-minute samples at 100 ppm. |
|
| |||||||
| time (days) |
refrigerated storage recovery (%) |
ambient storage recovery (%) | |||||
|
| |||||||
| 0 0 6 10 13 15 17 |
99.7 99.6 101.6 98.8 98.8 99.2 98.4 |
98.6 100.2 98.9 99.4 99.8 99.3 100.4 |
100.7 100.2 100.0 100.4 99.8 98.9 99.3 |
99.7 99.6 100.9 98.8 98.2 99.0 99.2 |
98.6 100.2 97.8 98.6 99.2 98.5 98.4 |
100.7 100.2 99.3 100.5 99.0 98.7 98.0 | |
|
| |||||||
 Figure 4.5.2.1. Trichloroethylene refrigerated storage test on charcoal tubes, 240-minute samples at 100 ppm. |
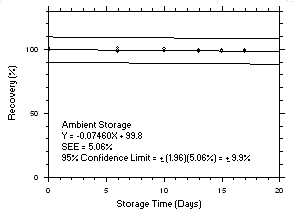 Figure 4.5.2.2. Trichloroethylene ambient storage test on charcoal tubes, 240-minute samples at 100 ppm. |
|
| |||||||
| time (days) |
refrigerated storage recovery (%) |
ambient storage recovery (%) | |||||
|
| |||||||
| 0 0 6 10 13 15 17 |
101.8 100.9 101.8 100.9 101.1 102.4 99.8 |
100.0 101.1 100.7 102.3 99.4 100.5 100.1 |
101.2 99.7 95.1 99.3 99.1 102.2 103.1 |
101.8 100.9 101.0 99.8 100.6 101.0 100.9 |
100.0 101.1 100.1 100.1 99.5 99.4 100.6 |
101.2 99.7 101.7 100.2 100.0 98.8 99.9 | |
|
| |||||||
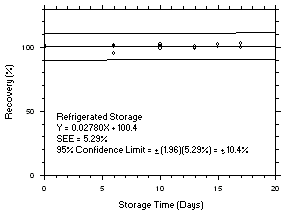 Figure 4.5.3.1. Tetrachloroethylene refrigerated storage test on charcoal tubes, 5-minute samples at 200 ppm. |
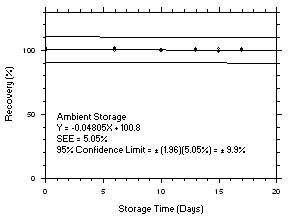 Figure 4.5.3.2. Tetrachloroethylene ambient storage test on charcoal tubes, 5-minute samples at 200 ppm. |
|
| |||||||
| time (days) |
refrigerated storage recovery (%) |
ambient storage recovery (%) | |||||
|
| |||||||
| 0 0 6 10 13 15 17 |
99.3 100.0 100.3 99.9 99.4 101.2 98.5 |
99.8 99.7 99.4 101.2 98.2 100.5 99.0 |
100.0 98.5 99.4 97.9 97.4 100.8 101.6 |
99.3 100.0 99.6 98.4 99.5 99.8 99.4 |
99.8 99.7 99.2 98.9 98.3 98.8 99.0 |
100.0 98.5 100.4 100.0 98.4 98.4 98.3 | |
|
| |||||||
 Figure 4.5.4.1. Trichloroethylene refrigerated storage test on charcoal tubes, 5-minute samples at 200 ppm. |
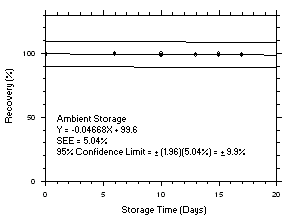 Figure 4.5.4.2. Trichloroethylene ambient storage test on charcoal tubes, 5-minute samples at 200 ppm. |
|
| |||||||
| time (days) |
refrigerated storage recovery (%) |
ambient storage recovery (%) | |||||
|
| |||||||
| 0 0 6 10 13 15 17 |
99.6 96.5 97.6 95.9 95.3 100.1 98.5 |
98.6 96.9 96.0 97.0 97.8 99.2 97.5 |
96.9 97.1 96.8 97.7 96.3 99.1 95.7 |
99.6 96.5 97.4 97.2 95.2 99.1 97.5 |
98.6 96.9 96.4 97.6 95.4 100.0 98.7 |
96.9 97.1 96.7 97.3 94.3 96.2 97.4 | |
|
| |||||||
 Figure 4.5.5.1. Tetrachloroethylene refrigerated storage test on charcoal tubes, 1-minute samples at 300 ppm. |
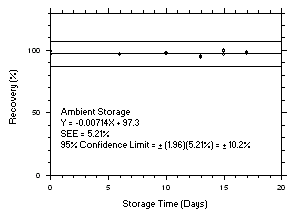 Figure 4.5.5.2. Tetrachloroethylene ambient storage test on charcoal tubes, 1-minute samples at 300 ppm. |
|
| |||||||
| time (days) |
refrigerated storage recovery (%) |
ambient storage recovery (%) | |||||
|
| |||||||
| 0 0 6 10 13 15 17 |
97.5 94.7 98.0 95.7 96.8 98.3 96.6 |
97.5 95.2 96.8 97.4 99.0 96.9 95.5 |
96.6 95.5 98.9 98.1 96.2 97.1 96.2 |
97.5 94.7 97.6 97.7 96.3 97.2 96.6 |
97.5 95.2 96.3 98.0 96.9 97.5 96.1 |
96.6 95.5 97.2 97.4 95.9 97.3 95.5 | |
|
| |||||||
 Figure 4.5.6.1. Trichloroethylene refrigerated storage test on charcoal tubes, 1-minute samples at 300 ppm. |
 Figure 4.5.6.2. Trichloroethylene ambient storage test on charcoal tubes, 1-minute samples at 300 ppm. |
|
| |||||||
| time (days) |
refrigerated storage recovery (%) |
ambient storage recovery (%) | |||||
|
| |||||||
| 0 0 6 10 13 15 17 |
102.3 99.1 96.6 102.2 99.3 99.3 98.2 |
100.7 99.4 100.2 96.1 98.6 95.2 101.5 |
100.3 96.6 97.4 95.3 98.4 98.6 102.1 |
102.3 99.1 99.9 94.6 99.6 100.2 97.4 |
100.7 99.4 99.8 96.9 98.1 103.6 99.2 |
100.3 96.6 94.1 97.0 100.3 96.2 100.0 | |
|
| |||||||
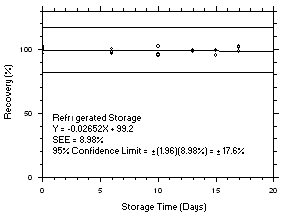 Figure 4.5.7.1. Tetrachloroethylene refrigerated storage test SKC 575-002, 240-minute samples at 100 ppm. |
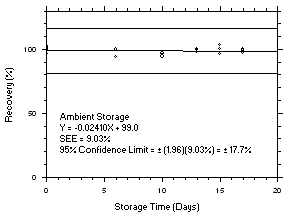 Figure 4.5.7.2. Tetrachloroethylene ambient storage test on SKC 575-002, 240-minute samples at 100 ppm. |
|
| |||||||
| time (days) |
refrigerated storage recovery (%) |
ambient storage recovery (%) | |||||
|
| |||||||
| 0 0 6 10 13 15 17 |
103.0 99.1 94.7 100.7 97.4 97.7 97.0 |
100.2 98.8 98.6 94.2 96.9 94.0 100.1 |
99.2 95.1 95.0 93.3 96.4 97.2 100.6 |
103.0 99.1 97.4 92.9 98.2 98.6 96.8 |
100.2 98.8 97.0 95.2 96.4 102.2 97.9 |
99.2 95.1 92.0 95.2 98.0 93.8 98.3 | |
|
| |||||||
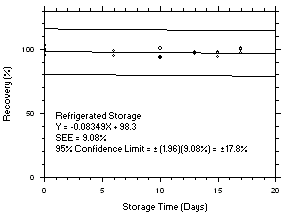 Figure 4.5.8.1. Trichloroethylene refrigerated storage test SKC 575-002, 240-minute samples at 100 ppm. |
 Figure 4.5.8.2. Trichloroethylene ambient storage test on SKC 575-002, 240-minute samples at 100 ppm. |
|
| |||||||
| time (days) |
refrigerated storage recovery (%) |
ambient storage recovery (%) | |||||
|
| |||||||
| 0 0 6 10 13 15 17 |
102.1 100.2 97.5 94.1 93.4 98.2 105.0 |
114.1 113.9 99.1 95.3 95.2 99.4 103.8 |
113.0 103.5 105.2 100.9 105.7 105.8 102.8 |
102.1 100.2 98.0 98.8 97.5 99.4 99.1 |
114.1 113.9 100.4 104.0 96.6 100.8 97.1 |
113.0 103.5 108.2 100.2 98.7 98.3 99.4 | |
|
| |||||||
 Figure 4.5.9.1. Tetrachloroethylene refrigerated storage test SKC 575-002 Samplers, 5-minute at 200 ppm. |
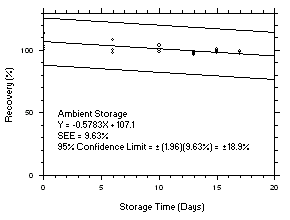 Figure 4.5.9.2. Tetrachloroethylene ambient storage test on SKC 575-002 Samplers, 5-minute at 200 ppm. |
|
| |||||||
| time (days) |
refrigerated storage recovery (%) |
ambient storage recovery (%) | |||||
|
| |||||||
| 0 0 6 10 13 15 17 |
102.5 102.0 99.9 94.5 97.5 99.6 106.8 |
106.1 105.6 102.1 98.0 100.1 101.4 104.4 |
102.0 97.6 96.3 99.1 104.1 105.1 105.4 |
102.5 102.0 100.8 95.3 98.2 99.2 98.9 |
106.1 105.6 103.7 101.0 96.7 100.4 99.4 |
102.0 97.6 96.5 94.7 94.8 97.8 99.3 | |
|
| |||||||
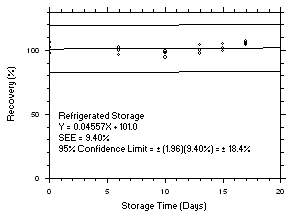 Figure 4.5.10.1. Trichloroethylene refrigerated storage test SKC 575-002 Samplers, 5-minute at 200 ppm. |
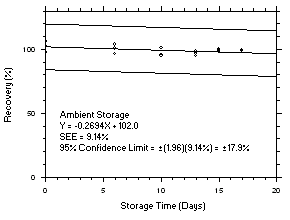 Figure 4.5.10.2. Trichloroethylene ambient storage test on SKC 575-002 Samplers, 5-minute at 200 ppm. |
-
4.6 Reproducibility
Six samples for both samplers at the TWA and ceiling target concentrations and six charcoal tube samples at the peak target concentrations that were collected from controlled test atmospheres, along with a draft copy of this procedure, were submitted to an SLTC service branch for analysis. All of samples were stored at room temperature and analyzed 22 days after generation. No sample result had a deviation greater than the precisions of the overall procedure determined in Section 4.4.
|
| |||||||||||||||||||||||||||||||||||||||||||||||||||
| | ||||||||||||||||||||||||||||||||||||||||||||||||||||
|
| |||||||||||||||||||||||||||||||||||||||||||||||||||
| | ||||||||||||||||||||||||||||||||||||||||||||||||||||
|
| |||||||||||||||||||||||||||||||||||||||||||||||||||
| | ||||||||||||||||||||||||||||||||||||||||||||||||||||
|
| |||||||||||||||||||||||||||||||||||||||||||||||||||
| | ||||||||||||||||||||||||||||||||||||||||||||||||||||
|
| |||||||||||||||||||||||||||||||||||||||||||||||||||
-
4.7 Sampler capacity and sampling rate
4.7.1 Charcoal tubes
The sampling capacity of the front section of charcoal sampling tubes was tested by sampling from a dynamically generated test atmosphere of tetrachloroethylene at 192.7 ppm (1306 mg/m3) and from another atmosphere containing 192.0 ppm (1031 mg/m3) of trichloroethylene). The samples were collected at a nominal flow rate of 50 mL/min and the mean relative humidity of the tetrachloroethylene atmosphere was 65% at 26.1°C and the trichloroethylene atmosphere was 64.5% RH at 25.8°C. Complete charcoal tubes were placed
in-line behind the front test sections and changed at measured intervals to check for breakthrough. No significant breakthrough (<0.1%) occurred when sampling from the tetrachloroethylene atmosphere for 9.5 hours ( 28.5 liters) which is equivalent to about 37 mg of
tetrachloroethylene. The mean 5% breakthrough volume from the
trichloroethylene atmosphere was determined to be about 23.3 liters
(
 7.8 hours), which is
equivalent to approximately 24 mg.
|
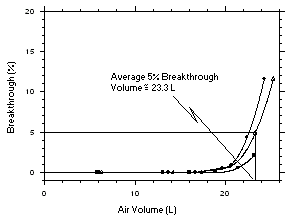 Figure 4.7.1. Determination of the 5% breakthrough volume for trichloroethylene collected with charcoal tubes. | |||||||||||||||||||||||||
-
4.7.2 SKC
575-002 SamplersThe sampling rates and capacities were determined by taking samples from a dynamically generated test atmosphere of tetrachloroethylene (nominal concentration of 200 ppm or 1356 mg/m3) and trichloroethylene (nominal concentration of 200 ppm or 1074 mg/m3) for increasing time intervals. The atmospheres were at approximately 70% relative humidity, 25°C and 660 mmHg. The flow of the atmospheres through the exposure chamber provided for face velocities of approximately 0.4 m/s on the SKC
575-002 Samplers. Three samples were taken for each sampling interval. Sampler capacity is exceeded when the sampling rate decreases rapidly. Because this did not occur for the time period tested, the capacity is determined to be greater than 12 mg for tetrachloroethylene and greater than 10 mg for trichloroethylene. Sampling rates standardized to 760 mmHg and 25°C of 13.06 mL/min for tetrachloroethylene and 14.24 mL/min for trichloroethylene were determined from the mean sample rates from samples collected from 5.0 to 600 minutes.
|
 Figure 4.7.2.1 Determination of sampling rate and capacity for tetrachloroethylene using SKC | ||||||||||||||||
| | |||||||||||||||||
|
 Figure 4.7.2.2 Determination of sampling rate and capacity for trichloroethylene using SKC | ||||||||||||||||
-
4.8 Extraction efficiency
4.8.1 Charcoal tubes
The extraction efficiencies of tetrachloroethylene and trichloroethylene were determined by liquid-spiking
100-mg portions of charcoal with the analytes at the RQL and 0.05 to 2 times the target concentrations for each of three levels. These samples were stored overnight at ambient temperature and then extracted and analyzed. The mean extraction efficiency over the ranges of the RQL to 2 times the TWA, ceiling and peak target concentration levels are 98.8%, 98.3% and 98.5% respectively for tetrachloroethylene and 99.3%, 98.8% and 99.0% for trichloroethylene. The mean extraction efficiencies for the RQL and all of the eighteen other concentrations are 98.5% for tetrachloroethylene and 99.1% for trichloroethylene.Extraction efficiencies from wet charcoal were also determined by drawing the recommended volume (12, 0.25 and 0.05 liters for TWA, ceiling and peak levels respectively) of humid air at approximately 80% RH, 22.2°C before the charcoal was spiked with the analytes. The mean respective extraction efficiencies for tetrachloroethylene and trichloroethylene are 98.9% and 99.5% for TWA levels, 98.6% and 98.9% for ceiling levels and 98.6% and 98.8% for peak levels.
Table 4.8.1.1
Extraction Efficiency of Tetrachloroethylene from Charcoal Tubes (TWA Levels)
level
sample number
× target
concnµg per
sample1 2 3 4 5 6 mean
(  RQL)
RQL)
0.05
0.1
0.2
0.5
1.0
2.0
1.0 (wet)1.22
405.8
811.5
1623
4058
8115
16230
811597.5
97.6
98.4
98.5
98.5
98.8
99.4
98.6100.1
97.9
99.0
98.5
98.5
98.4
99.4
98.897.8
97.8
98.1
98.8
98.6
98.9
99.4
98.8100.0
98.0
98.6
98.9
98.5
98.7
99.7
98.8101.5
97.7
98.3
98.6
98.6
98.8
99.3
98.896.8
98.2
98.5
98.7
98.5
98.7
99.5
99.199.5
97.9
98.5
98.7
98.5
98.7
99.4
98.9
Table 4.8.1.2
Extraction Efficiency of Tetrachloroethylene from Charcoal Tubes (Ceiling Levels)
level
sample number
× target
concnµg per
sample1 2 3 4 5 6 mean
(  RQL)
RQL)
0.05
0.1
0.2
0.5
1.0
2.0
1.0 (wet)1.22
16.88
33.76
67.52
168.8
337.6
675.2
337.697.5
97.7
98.9
97.6
97.9
98.2
98.8
98.7100.1
98.0
97.7
98.5
96.7
98.6
98.9
98.497.8
97.9
99.0
98.2
97.9
98.5
98.6
98.9100.0
98.7
98.6
97.9
96.7
98.7
99.3
98.7101.5
96.1
99.0
94.6
97.1
98.3
99.1
98.396.8
95.6
98.8
98.4
96.4
98.5
98.8
98.599.5
97.3
98.7
98.2
97.1
98.5
98.9
98.6
Table 4.8.1.3
Extraction Efficiency of Tetrachloroethylene from Charcoal Tubes (Peak Levels)
level
sample number
× target
concnµg per
sample1 2 3 4 5 6 mean
(  RQL)
RQL)
0.05
0.1
0.2
0.5
1.0
2.0
1.0 (wet)1.22
5.03
10.06
20.13
50.30
100.6
201.3
100.697.5
98.1
99.4
97.2
97.6
99.0
98.5
98.8100.1
101.8
96.3
97.5
98.0
98.9
99.0
98.8101.3
98.0
95.8
99.3
97.4
98.8
99.2
98.4100.0
97.3
96.0
98.1
98.9
98.7
99.1
98.4101.5
99.6
97.6
97.9
98.3
96.6
99.2
98.696.8
100.2
98.3
98.8
98.2
98.4
98.6
98.999.5
99.2
97.2
98.1
98.4
98.4
98.9
98.6
Table 4.8.1.4
Extraction Efficiency of Trichloroethylene from Charcoal Tubes (TWA Levels)
level
sample number
× target
concnµg per
sample1 2 3 4 5 6 mean
(  RQL)
RQL)
0.05
0.1
0.2
0.5
1.0
2.0
1.0 (wet)0.96
321.9
643.7
1287
3219
6437
12870
643794.9
98.6
100.0
99.4
98.2
98.6
100.0
99.297.5
98.9
100.3
99.2
98.9
99.4
100.0
99.4101.5
98.8
99.2
99.6
98.8
99.5
100.2
99.794.6
98.8
99.8
100.2
98.3
99.3
100.0
99.8102.4
98.7
99.8
99.7
99.4
99.2
99.8
99.4101.6
99.2
99.5
99.8
98.2
99.1
99.9
99.698.8
98.8
99.8
99.6
98.6
99.2
100.0
99.5
Table 4.8.1.5
Extraction Efficiency of Trichloroethylene from Charcoal Tubes (Ceiling Levels)
level
sample number
× target
concnµg per
sample1 2 3 4 5 6 mean
(  RQL)
RQL)
0.05
0.1
0.2
0.5
1.0
2.0
1.0 (wet)0.96
13.39
26.78
53.56
133.9
267.8
535.6
267.894.9
96.7
98.7
98.2
98.7
99.2
99.4
99.497.5
98.3
99.5
99.7
98.0
99.3
99.6
98.8101.5
98.2
99.8
99.5
99.2
99.4
99.4
98.994.6
98.6
98.4
98.3
97.6
99.4
99.9
99.0102.4
99.5
98.3
98.9
97.9
99.1
99.9
98.698.6
96.7
98.7
98.7
97.2
99.7
99.4
98.998.8
98.0
98.9
98.9
98.1
99.4
99.6
98.9
Table 4.8.1.6
Extraction Efficiency of Trichloroethylene from Charcoal Tubes (Peak Levels)
level
sample number
× target
concnµg per
sample1 2 3 4 5 6 mean
(  RQL)
RQL)
0.05
0.1
0.2
0.5
1.0
2.0
1.0 (wet)0.96
3.99
7.98
15.96
39.91
79.82
159.6
79.8294.9
103.2
98.2
100.0
99.2
100.3
99.3
99.897.5
100.3
97.5
99.6
98.3
99.7
99.8
98.8101.5
93.7
100.8
100.0
98.9
99.6
99.9
98.994.6
98.3
100.7
98.4
98.0
99.2
99.7
98.6102.4
101.1
98.8
98.6
97.4
97.7
100.2
98.498.6
96.4
99.1
98.1
98.5
99.4
99.2
98.698.8
98.8
99.2
99.1
98.4
99.3
99.7
98.8
Stability of extracted charcoal tubes samples
The stability of extracted samples was investigated by reanalyzing the target concentration samples 24 h after the initial analyses. After the original analyses for each target concentration level were performed, three vials from each set were recapped with new septa, while the remaining three retained their punctured septa. The samples were reanalyzed with fresh standards. The mean percent change was 0.0%, -0.5% and -0.2% for TWA, ceiling and peak tetrachloroethylene samples respectively that were resealed with new septa and
-0.7%, -1.6% and -1.4% for those that retained their punctured septa. The mean percent change was +0.7%, -0.5% and -0.5% for TWA, ceiling and peak trichloroethylene samples respectively that were resealed with new septa and -3.6%, -5.6% and -5.4% for those that retained their punctured septa.Table 4.8.1.7
Stability of Extracted Tetrachloroethylene Samples (TWA)
punctured septa replaced
punctured septa retained
initial
DE
(%)DE after
one day
(%)difference initial
DE
(%)DE after
one day
(%)difference
98.8
98.4
98.9
98.798.6
98.8
98.8
(means)
98.7-0.2
+0.4
-0.1
0.098.7
98.8
98.7
98.797.7
98.1
98.2
(means)
98.0-1.0
-0.7
-0.5
-0.7
Table 4.8.1.8
Stability of Extracted Tetrachloroethylene Samples (Ceiling)
punctured septa replaced
punctured septa retained
initial
DE
(%)DE after
one day
(%)difference initial
DE
(%)DE after
one day
(%)difference
98.2
98.6
98.5
98.497.9
98.0
98.0
(means)
98.0-0.3
-0.6
-0.5
-0.598.7
98.3
98.5
98.596.8
97.0
96.8
(means)
96.9-1.9
-1.3
-1.7
-1.6
Table 4.8.1.9
Stability of Extracted Tetrachloroethylene Samples (Peak)
punctured septa replaced
punctured septa retained
initial
DE
(%)DE after
one day
(%)difference initial
DE
(%)DE after
one day
(%)difference
99.0
98.9
98.8
98.998.8
98.8
98.4
(means)
98.7-0.2
-0.1
-0.4
-0.298.7
96.6
98.4
97.997.1
95.0
97.3
(means)
96.5-1.6
-1.6
-1.1
-1.4
Table 4.8.1.10
Stability of Extracted Trichloroethylene Samples (TWA)
punctured septa replaced
punctured septa retained
initial
DE
(%)DE after
one day
(%)difference initial
DE
(%)DE after
one day
(%)difference
98.6
99.4
99.5
99.298.8
100.6
100.2
(means)
99.9+0.2
+1.2
+0.7
+0.799.3
99.2
99.1
99.294.8
95.6
96.4
(means)
95.6-4.5
-3.6
-2.7
-3.6
Table 4.8.1.11
Stability of Extracted Trichloroethylene Samples (Ceiling)
punctured septa replaced
punctured septa retained
initial
DE
(%)DE after
one day
(%)difference initial
DE
(%)DE after
one day
(%)difference
99.2
99.3
99.4
99.398.7
98.9
98.8
(means)
98.8-0.5
-0.4
-0.6
-0.599.4
99.1
99.7
99.493.6
94.5
93.4
(means)
93.8-5.8
-4.6
-6.3
-5.6
Table 4.8.1.12
Stability of Extracted Trichloroethylene Samples (Peak)
punctured septa replaced
punctured septa retained
initial
DE
(%)DE after
one day
(%)difference initial
DE
(%)DE after
one day
(%)difference
100.3
99.7
99.6
99.999.4
99.4
99.4
(means)
99.4-0.9
-0.3
-0.2
-0.599.2
97.7
99.4
98.894.4
91.8
93.9
(means)
93.4-4.8
-5.9
-5.5
-5.4
4.8.2 SKC
575-002 SamplersThe extraction efficiencies of tetrachloroethylene and trichloroethylene were determined by
liquid-spiking 500-mg portions of Anasorb 747 with the analytes at 0.05 to 2 times the target concentrations. These samples were stored overnight at ambient temperature and then extracted and analyzed. The mean extraction efficiency over the ranges of the RQL to 2 times the TWA and ceiling levels are 96.2% and 94.9% respectively for tetrachloroethylene and 97.7% and 97.3% for trichloroethylene. The mean extraction efficiencies for the RQL and all of the twelve other concentrations are 95.4% for tetrachloroethylene and 97.5% for trichloroethylene.Extraction efficiencies from wet Anasorb 747 were also determined by exposing the samplers for the recommended times (240 and 5 minutes for TWA and ceiling levels respectively) to humid air at approximately 80% RH, 22.2°C before the samplers were spiked with the analytes. The mean respective extraction efficiencies for tetrachloroethylene and trichloroethylene are 93.2% and 95.3% for TWA levels and 94.0% and 96.0% for ceiling levels.
Table 4.8.2.1
Extraction Efficiency of Tetrachloroethylene from SKC575-002 Samplers (TWA Levels)
level
sample number
× target
concnµg per
sample1 2 3 4 5 6 mean
(  RQL)
RQL)
0.05
0.1
0.2
0.5
1.0
2.0
1.0 (wet)2.43
107.1
214.2
428.5
1071
2142
4285
214296.0
96.5
96.1
95.3
96.9
95.8
96.7
93.396.6
95.9
95.6
95.2
96.8
96.4
96.2
92.997.5
95.7
95.1
94.8
96.7
96.0
96.6
93.1101.4
95.6
95.4
94.6
96.1
96.4
96.4
92.997.7
96.4
95.8
95.0
96.5
96.5
96.6
93.194.1
96.0
95.6
95.0
96.7
96.0
96.7
93.897.2
96.0
95.6
95.0
96.6
96.2
96.5
93.2
Table 4.8.2.2
Extraction Efficiency of Tetrachloroethylene from SKC575-002 Samplers (Ceiling Levels)
level
sample number
× target
concnµg per
sample1 2 3 4 5 6 mean
(  RQL)
RQL)
0.05
0.1
0.2
0.5
1.0
2.0
1.0 (wet)2.43
4.38
8.76
17.5
43.8
87.6
175.2
87.696.0
94.5
96.4
96.3
90.0
94.7
92.5
94.396.6
95.6
93.3
95.3
91.1
94.6
91.5
94.497.5
98.3
94.0
98.0
91.5
95.2
90.6
93.9101.4
95.0
98.2
96.4
93.2
94.9
91.0
94.297.7
97.1
92.8
98.0
91.8
93.8
92.6
93.594.1
98.0
96.6
97.1
93.3
95.1
92.4
93.697.2
96.4
95.2
96.8
91.8
94.7
91.8
94.0
Table 4.8.2.3
Extraction Efficiency of Trichloroethylene from SKC575-002 Samplers (TWA Levels)
level
sample number
× target
concnµg per
sample1 2 3 4 5 6 mean
(  RQL)
RQL)
0.05
0.1
0.2
0.5
1.0
2.0
1.0 (wet)1.23
96.56
193.1
386.2
965.6
1931
3862
1931101.2
98.1
97.9
97.6
98.7
97.6
98.0
95.494.1
97.7
97.4
97.4
98.1
98.2
97.0
94.798.6
97.7
96.7
97.3
98.2
97.4
98.4
95.299.2
97.1
97.1
96.8
97.6
98.1
97.9
95.194.5
98.1
97.7
97.3
98.0
98.1
98.2
95.498.0
98.0
97.8
97.2
98.3
97.4
98.5
95.897.6
97.9
97.4
97.3
98.2
97.8
98.0
95.3
Table 4.8.2.4
Extraction Efficiency of Trichloroethylene from SKC575-002 Samplers (Ceiling Levels)
level
sample number
× target
concnµg per
sample1 2 3 4 5 6 mean
(  RQL)
RQL)
0.05
0.1
0.2
0.5
1.0
2.0
1.0 (wet)1.23
3.95
7.90
15.80
39.50
79.00
158.0
79.00101.2
95.8
99.6
96.7
93.5
97.1
94.8
96.194.1
102.7
99.8
97.1
92.8
96.4
94.3
97.498.6
99.0
97.1
96.7
95.5
96.4
93.5
97.799.2
102.9
102.4
97.8
96.7
96.3
94.0
96.094.5
102.1
99.6
98.5
94.9
95.8
95.0
95.798.0
98.9
101.0
98.9
96.4
96.8
94.7
95.297.6
100.2
99.9
97.6
95.0
96.5
94.4
96.0
Stability of extracted SKC
575-002 SamplersThe stability of extracted samples was investigated by reanalyzing the target concentration samples 24 h after the initial analyses. After the original analyses for each target concentration level were performed, three vials from each set were recapped with new septa, while the remaining three retained their punctured septa. The samples were reanalyzed with fresh standards. The mean percent change was -0.4% and +1.0% for TWA and ceiling tetrachloroethylene samples respectively that were resealed with new septa and -1.0% and +0.3% for those that retained their punctured septa. The mean percent change was -0.4% and +0.9% for TWA and ceiling trichloroethylene samples respectively that were resealed with new septa and 4.0% and 1.6% for those that retained their punctured septa.
Table 4.8.2.5
Stability of Extracted Tetrachloroethylene Samples (TWA)
punctured septa replaced
punctured septa retained
initial
EE
(%)EE after
one day
(%)difference initial
EE
(%)EE after
one day
(%)difference
95.8
96.4
96.0
96.195.1
96.2
95.8
(means)
95.7-0.7
-0.2
-0.2
-0.496.4
96.5
96.0
96.395.0
95.5
95.4
(means)
95.3-1.4
-1.0
-0.6
-1.0
Table 4.8.2.6
Stability of Extracted Tetrachloroethylene Samples (Ceiling)
punctured septa replaced
punctured septa retained
initial
EE
(%)EE after
one day
(%)difference initial
EE
(%)EE after
one day
(%)difference
94.7
94.6
95.2
94.895.6
95.8
96.0
(means)
95.8+0.9
+1.2
+0.8
+1.094.9
93.8
95.1
94.695.1
95.0
94.7
(means)
94.9+0.2
+1.2
-0.4
+0.3
Table 4.8.2.7
Stability of Extracted Trichloroethylene Samples (TWA)
punctured septa replaced
punctured septa retained
initial
EE
(%)EE after
one day
(%)difference initial
EE
(%)EE after
one day
(%)difference
97.6
98.2
97.4
97.797.0
97.9
97.1
(means)
97.3-0.6
-0.3
-0.3
-0.498.1
98.1
97.4
97.992.2
94.9
94.7
(means)
93.9-5.9
-3.2
-2.7
-4.0
Table 4.8.2.8
Stability of Extracted Trichloroethylene Samples (Ceiling)
punctured septa replaced
punctured septa retained
initial
EE
(%)EE after
one day
(%)difference initial
EE
(%)EE after
one day
(%)difference
97.1
96.4
96.4
96.697.4
97.4
97.7
(means)
97.5+0.3
+1.0
+1.3
+0.996.3
95.8
96.8
96.394.5
94.8
94.7
(means)
94.7-1.8
-1.0
-2.1
-1.6
4.9 Interferences (sampling)
4.9.1 Interference studies were performed by sampling for 240 minutes from a test atmosphere (70% RH, 24°C, 659 mmHg) containing 100 ppm of tetrachloroethylene with 83 ppm of methylene chloride, 70 ppm of isopropyl alcohol, 71 ppm of
2-butanone (MEK), 26 ppm of butyl acetate, 17 ppm of dioxane and 16 ppm of amyl acetate. Another test was done by sampling for 240 minutes from a test atmosphere (63% RH, 27°C, 659 mmHg) containing 100 ppm of trichloroethylene plus the aforementioned solvent vapors. The presence of these compounds, which may represent typical substances that may be collected with tetrachloroethylene or trichloroethylene did not have a significant effect on sample results using either of the samplers.Table 4.9.1
Recovery (%) from the Atmosphere Described in 4.9.1 for each Analyte
tetrachloroethylene trichloroethylene
sample
no.charcoal
tubesSKC 575-002
Samplerscharcoal
tubesSKC 575-002
Samplers
1
2
3
mean101.6
100.0
102.0
101.2104.9
108.4
105.4
106.296.8
95.8
97.7
96.898.4
100.0
100.6
99.7
4.9.2 Reverse diffusion studies for the SKC
575-002 Samplers and stripping studies for the charcoal tubes was performed by sampling a193-ppm atmosphere of tetrachloroethylene and a194-ppm atmosphere of trichloroethylene (65% RH, 26°C, 651 mmHg) for 60 minutes with six of each samplers. Three samplers from each set were additionally subjected to 180 minutes of the same atmosphere without the analytes present to determine if any of the collected solvents diffused off of the SKC575-002 Samplers and also whether it was stripped off of the charcoal tubes. Upon analysis of the samples, the mean recovery of the removed samplers versus the mean recovery of the samplers that were additionally exposed to the atmosphere without analyte was greater than 90% for both samplers, indicating that reverse diffusion and stripping is insignificant. The first three samples in Table 4.9.2 for each sampler were used to sample the atmosphere for 60 minutes, while the last three were additionally exposed to a blank atmosphere for another 180 minutes.Table 4.9.2
Recovery (%) for the Circumstances Described in 4.9.2 for Each Analyte
(Samples1-3 used to sample atmosphere for 60 minutes,
samples4-6 for an additional 180 minutes of blank atmosphere)
tetrachloroethylene trichloroethylene
sample
no.charcoal
tubesSKC 575-002
Samplerscharcoal
tubesSKC 575-002
Samplers
1
2
3
mean (1-3)
4
5
6
mean (4-6)
mean (4-6) ÷ mean (1-3)100.2
99.0
100.6
99.9
101.7
101.8
101.7
101.7
1.02104.6
100.1
103.2
102.6
97.3
106.8
102.7
102.3
1.00100.7
99.1
101.1
100.3
101.4
101.8
101.4
101.5
1.01104.8
100.2
102.3
102.4
96.7
106.3
102.6
101.9
1.00
4.9.3 The effects from sampling from relatively dry atmospheres were investigated by sampling from an atmosphere (3% RH, 26°C, 650 mmHg) containing 198 ppm of tetrachloroethylene and 199 ppm of trichloroethylene for 240 minutes with both samplers. The mean results for the both analytes collected on both samplers was greater than 90% of the theoretical amounts.
Table 4.9.3
Recovery (%) for240-minute Samples from a
Dry Atmosphere for Each Analyte
tetrachloroethylene trichloroethylene
sample
no.charcoal
tubesSKC 575-002
Samplerscharcoal
tubesSKC 575-002
Samplers
1
2
3
mean100.0
99.3
100.0
99.8100.4
106.8
102.4
103.298.4
98.1
97.9
98.198.5
105.3
101.0
101.6
4.9.4 The effects from sampling from atmospheres containing low concentrations of analytes were investigated by sampling from an atmosphere (67% RH, 26°C, 649 mmHg) containing 9.0 ppm of tetrachloroethylene and 10.7 ppm of trichloroethylene for 240 minutes with both samplers. The mean results for both analytes collected on both samplers was greater than 90% of the theoretical amounts.
Table 4.9.4
Recovery (%) for240-minute Samples from a
Atmosphere Containing 9.0 ppm of Tetrachloroethylene
and 10.7 ppm of Trichloroethylene
tetrachloroethylene trichloroethylene
sample
no.charcoal
tubesSKC 575-002
Samplerscharcoal
tubesSKC 575-002
Samplers
1
2
3
mean100.2
100.2
100.8
100.4101.7
101.5
100.2
101.198.5
99.3
99.5
99.1100.2
100.6
98.2
99.7
4.10 Qualitative analysis
Tetrachloroethylene and trichloroethylene can easily be identified by GC/mass spectrometry. The following figures represent typical mass spectra of tetrachloroethylene and trichloroethylene.
 Figure 4.10.1 representative mass spectrum of tetrachloroethylene. |
 Figure 4.10.1 representative mass spectrum of trihloroethylene. |
1. Elskamp, C.J. "OSHA Method No. 111, Toluene"; OSHA Salt Lake Technical Center, Salt Lake City, UT. Unpublished work, 1998.
2.
3.
4. Kirk-Othmer Encyclopedia of Chemical Technology, pp 50-59.
5. Kirk-Othmer Encyclopedia of Chemical
Technology, pp
6. Kirk-Othmer Encyclopedia of Chemical
Technology, pp
7. The Merck Index, 12th ed.; Budavari, S., Ed.; Merck & Co., Whitehouse Station, NJ, 1996; 9332.
8. The Merck Index, 12th ed.; Budavari, S., Ed.; Merck & Co., Whitehouse Station, NJ, 1996; 9332.
9. Kirk-Othmer Encyclopedia of Chemical
Technology, pp
10. The Merck Index, 12th ed.; Budavari, S., Ed.; Merck & Co., Whitehouse Station, NJ, 1996; 9769.
11. "Evaluation Guidelines for Air Sampling Methods Utilizing Chromatographic Analyses", OSHA Salt Lake Technical Center, Salt Lake City, UT. Unpublished work, 1999.
12. "Evaluation Guidelines for Air Sampling Methods Utilizing Chromatographic Analyses", OSHA Salt Lake Technical Center, Salt Lake City, UT. Unpublished work, 1999.
